1. Introduction
This chapter summarises recent analysis of exports in services by UK country and region and research on the methods for making international comparisons of labour productivity contained in the following longer releases:
Estimating the value of service exports abroad from different parts of the UK: 2011 to 2016
Improving estimates of labour productivity and international comparisons
2. Service exports from the UK by region, functional category and product
The latest regional service exports release provided estimates of the value of service exports arising from the NUTS countries and regions of the UK. In addition to this, for the very first time this analysis compiled product-based estimates for each NUTS1 area in 2016, providing a more coherent picture of what specific services have been exported.
The total value of UK service exports is estimated at £254.0 billion in 2016, up from £229.4 billion in 2015, an increase of £24.5 billion. These values are on a current price basis and therefore do not account for the effects of inflation. Service exports from all NUTS1 areas in 2016, except the North West, increased compared with 2015; Northern Ireland’s service exports grew by the highest percentage of 17.0%, followed by the North East (14.3%) and London (13.2%).
London and the financial services sector continue to dominate overall service exports
In Figure 1 we use a tree diagram to explore the breakdown of each NUTS1 area and its constituent functional categories2. We can clearly observe that almost half of service exports originate from London. The largest functional categories of exports from London were £32.7 billion of financial services, followed by £19.8 billion of real estate, professional, scientific and technical services.
Figure 1: Great Britain service exports by NUTS1 area and functional category, 2016
Embed code
Source: Office for National Statistics
Notes
- Data for Northern Ireland by functional category are not included because selected categories had to be suppressed for reasons of confidentiality and reliability
In terms of growth in service exports by NUTS1 area between 2011 and 2016, the highest increase was seen in Scotland where service exports grew by 51.6%. This was followed by the North East (51.1%), Wales (45.1%), the West Midlands (44.5%) and the North West (42.2%), with the other six NUTS1 areas growing between 20% and 30%.
For real estate, professional, scientific and technical services, London, the South East and Scotland contributed the most to the 44.8% growth in this category between 2011 and 2016. All functional categories including information and communication, construction and retail saw an increase except wholesale and motor trades, which was the only category to experience a decline in exports of services between 2011 and 2016. It fell by 33.6%, and this decline was driven largely by London, accounting for 70.9% of the change.
In manufacturing service exports, the North West contributed more than 40.0% of the 55.9% growth in this category between 2011 and 2016, whereas London and the East of England contributed negatively. In financial services exports, even though London has the largest share (36.1%) of the 10.9% growth in exports between 2011 and 2016, it is followed very closely by Scotland, which contributed 29.6% to the change.
Excluding financial services, London and the South East still dominate services exports
New product level analysis excluding financial and some other services3 showed that business services4 was the most prominent type of service exported in 2016, accounting for £64.6 billion; over 60% of the business service exports came from London and the South East.
Telecommunications, computer and information services was the second-highest category of services exports for seven of the 11 NUTS1 areas. For three of the remaining four regions – the North West, Wales and the East of England – the second-largest product category exported was charges for the use of intellectual property services. Manufacturing, maintenance and repair services was the second-largest services export product category in the North East.
Figure 2: Share of selected product categories exported by each Great Britain NUTS1 area, 2016
Embed code
Source: Office for National Statistics
Figure 2 provides an interactive heatmap for selected product subcategories, to illustrate the share of each NUTS1 area in that category.
This graphic shows that 41.4% of research and development services were exported from the South East, whereas 18.4% were exported from the East of England and 13.2% from London. 62.3% of professional and management consulting services, the largest category within business services, were exported from London in 2016, followed by 13.5% from the South East. This product subcategory includes services such as accounting, legal services, business and management consulting, and advertising services, and it accounts for around 42.9% of exports of business services. This was followed by technical services, which accounted for 14.1% of business services and was primarily driven by engineering, but also includes architectural and other technical services.
Looking at the subcategories within professional and management consulting, London exported 84.9% of total legal services reported in the International Trade in Services (ITIS) survey, while the remaining NUTS1 areas had a small share of less than 3% each. Accounting, auditing, bookkeeping, and tax consulting services were also predominately exported from London (61.2%), followed by the South East (9.4%) and the West Midlands (5.2%). Advertising services, which accounted for 5.6% of the service exports reported in the ITIS survey, was mainly exported from London (73.4%), followed by the South East (11.6%) and the North West (4.8%).
Notes for: Service exports from the UK by region, functional category and product
The Nomenclature of Units for Territorial Statistics (NUTS) is a hierarchical classification of administrative areas, used across the EU for statistical purposes. There are 12 NUTS1 areas in the UK: Wales, Scotland, Northern Ireland, and the nine former English Government Office Regions.
Functional categories are defined using definitions from the Pink Book, and from the UK Standard Industrial Classification 2007: SIC 2007 classifications. For further detail see Table 1 in the full article.
This product analysis uses data from International Trade in Services (ITIS) excluding the finance, insurance, travel and transport categories. Therefore, in value terms, the analysis in this section only includes 45.0% of total UK service exports and covers only Great Britain.
We present 28 product classifications, which have been derived by aligning ITIS product codes from ITIS questionnaire returns with the Extended Balance of Payments Services (EBOPS) classification. For further information on these classifications, please refer to Table 2 in the full article.
3. International comparisons of productivity
Introduction
We have been producing international comparisons of productivity (ICP) statistics since October 2001, enabling domestic users to compare the UK against other G7 countries. We compare how much labour input is used (in hours worked and number of people) to produce the outputs (goods and services) in our economy and express this as output per hour and output per worker. The estimates throughout this period have shown significant differences in productivity between the UK and leading G7 countries, with output per hour worked in the UK being consistently lower than Germany, France and the USA. The long-standing trend in the data pointed to output being very low for the number of hours worked or the hours worked being very high for the output that was being produced. Whilst there may be structural differences across the economies (depending on whether they are production or service oriented), the magnitude of the differences in the levels meant that we needed to review our methodology and better understand how the data were compiled across the countries and how comparable they were.
This was particularly highlighted in 2014 when the Organisation for Economic Co-operation and Development (OECD) discontinued their Annual Labour Force Statistics (ALFS) database total employment measure, which we had historically used for estimating the employment measure in the ICP bulletin. For a limited period, we used alternative indicators from Eurostat and the OECD to estimate the missing values. However, this was not a sustainable strategy and in October 2018 we suspended the publication of ICP to review and explore potential new data sources to produce these statistics.
To review how other countries were compiling their labour inputs required international cooperation and so we initiated and partly funded a research project with the OECD, which resulted in the OECD’s working paper International productivity gaps: Are labour input measures comparable?.
This project issued a joint OECD and Eurostat questionnaire, across 41 countries, on understanding labour inputs recorded by countries. The questionnaire sought information on the methodologies used to compile labour inputs, the main and secondary sources used and which adjustments were applied to the labour inputs by each country to bring them in line with the national accounts concepts and the production boundary.
Main findings
Countries used the following four main sources as primary and secondary inputs to estimate labour inputs:
labour force survey
business statistics
population statistics
administrative sources
Although not all of these sources are used to estimate labour inputs within each country, the OECD drew the conclusion that no individual source was comprehensive and exhaustive enough to capture the three core concepts for aligning labour inputs. In fact, all four data sources had their own coverage and exhaustiveness constraints and so each on its own was insufficient to provide estimates of labour inputs that match the output concepts defined by the production boundary.
Therefore, certain adjustments were necessary to bridge the gap. The first concerned periodicity, where the original data sources may be collected on a different frequency to the labour inputs. For example, the labour force survey and business statistics may be collected monthly but national accounts and productivity estimates are compiled quarterly or annually. Similarly, some administrative data may be available annually and it may be necessary to spline the data into a quarterly series. The second adjustment concerns aligning persons to jobs or jobs to persons.
When the units of measurement in the original data source differ from those used in the national accounts, it is important to align these as the ratio of persons to jobs can differ across countries. The third adjustment was the economic territory. This covered adjustments that aligned estimates of workers with the economic territory in which they work. For example, we may need to capture non-resided persons working in domestic (resident) production units and exclude those in the resident population that work in non-resident units such as foreign embassies, consulates, foreign military bases within the reporting country or work abroad. This is known as the difference between the domestic and national boundary. This also captures conceptual adjustments where some activities and institutions may be excluded. For example, the labour force survey may exclude military and collective households whilst business statistics may exclude non-market services such as education and health, as well as the self-employed and unpaid family workers. The fourth concept covered the unobserved economy, that is the economic activity that is not recorded. Most sources typically miss information on employment and hours worked in the unobserved economy, even though they are included in output, for example, construction, trade, catering and personal services.
Methods for estimating hours worked
The sources that were available to each country and the adjustments applied also determined the method that countries were using to estimate hours worked, though countries broadly followed one of three main methods.
The first is the direct method. This annualises the average weekly hours worked directly collected from the data source, usually the labour force survey, for all weeks of the calendar year. Typically, countries will multiply the number of actual hours worked in the reference week, which are likely to be self-reported in the survey, by the number of working weeks in the year, after adjusting for public holidays. The UK uses this method as the best conceptual match to the required concept available from routine data collections.
The second is the direct method with additional adjustments and this is an extension of the direct method. Some countries used the direct method and applied additional adjustments that were necessary to reflect the source coverage, for example, residents working abroad and bias issues in the labour force survey such as over-reporting hours worked.
The third is the component method, where the starting point is data on a normal, usual paid or contractual hours basis and then adjusting the differences derived from a variety of data sources as components, for example, annual leave, sickness, maternity hours and strikes.
The report concluded that different countries use variations of the three approaches and that this heterogeneity significantly impacted on comparative productivity estimates. Table 1 summarises the methods, main sources and adjustments applied by each of the G7 countries. It shows France and Germany adjusting down the hours worked by employees up to 18.8% and 12.4% respectively and Canada adjusting down the number of self-employed people sourced by the labour force survey by 41%.
| G7 | Canada | France | Germany | Italy | Japan | UK | United States |
|---|---|---|---|---|---|---|---|
| Method | DM, WITH ADJ | CM | CM | CM | CM | DM | DM |
| Hours - main Employees | LFS | BS | AS | LFS/AS | BS | LFS | BS |
| Hours - main Self-employed | LFS | AS | LFS | LFS/AS | N/A | LFS | LFS |
| Hours - secondary Employees | AS | LFS/AS | LFS/BS/AS | BS/AS | LFS | AS | LFS/BS |
| Hours - secondary Self-employed | AS | LFS/AS | AS | BS/AS | N/A | N/A | N/A |
| Employment - main Employees | LFS | AS | BS/AS | LFS/BS/AS | LFS/PC | LFS | BS |
| Employment - main Self-employed | LFS | AS | LFS | LFS/BS/AS | LFS/PC | LFS | LFS |
| Employment - secondary Employees | PC/BS/AS | LFS/BS/AS | LFS/AS | AS | AS | BS/AS | AS |
| Employment - secondary Self - employed | PC/AS | LFS/AS | N/A | AS | AS | N/A | N/A |
| % change in average hours worked Employee | unquantified | -18.8% | -12.4% | N/A | 1.0% | 0.0% | 0.0% |
| % change in average hours worked Self-Employed | unquantified | 53.5% | -6.4% | N/A | 0.0% | 0.0% | 0.0% |
| % total adjustment made to number of employees | 10.0% | 0.3% | 6.3% | 9.9% | 3.3% | 0.0% | 2.6% |
| % adjustments made to number of self-employed | -41.0% | 0.1% | 0.9% | 0.0% | 8.6% | 0.0% | 0.0% |
Download this table Table 1: Labour input sources for G7 countries
.xls .csvOECD recommendations
The OECD recognises the direct method of estimating hours worked is not necessarily inferior to the component-based approach but without the use of additional adjustments the data collected suggest it could potentially overestimate the actual hours worked. Looking across the countries submitting data, they recommend the component method as the best compromise strategy for estimating labour inputs, though they recognise that not all countries may be able to capitalise on administrative sources. When making international comparisons, they encourage countries that use the direct method without adjustments to consider adapting a “simple” component method as an interim step. Re-estimating the labour inputs using this simplified component approach increases the UK’s relative productivity, narrowing the gap with the US by around 8 percentage points from 24% below US productivity to 16% below, because the UK currently uses the direct method.
Figure 3 shows the estimated labour productivity gaps in gross domestic product (GDP) per hour worked, measured using average hours worked from official national accounts and the OECD labour force survey-based simplified component method.
Figure 3: Estimated labour productivity gaps, selected OECD countries, 2016

Source: Organisation for Economic Cooperation and Development (2018): International productivity gaps: Are labour input measures comparable?
Download this image Figure 3: Estimated labour productivity gaps, selected OECD countries, 2016
.png (31.7 kB) .xls (70.7 kB)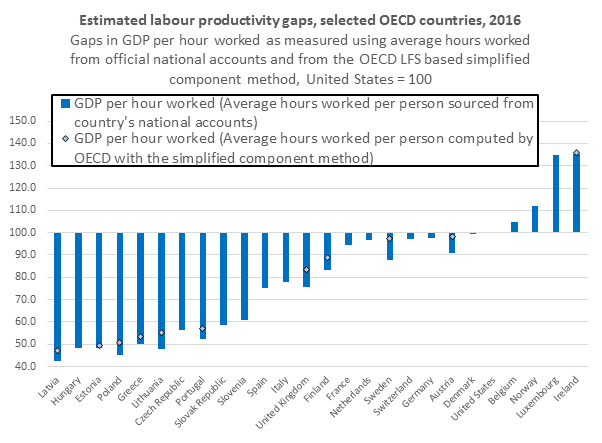
In light of these findings, the OECD is proposing to revise the country-specific labour inputs data presented in their productivity database using the following criteria:
For countries that apply the component method or the direct method with adjustments they will use the national accounts estimates.
For countries that apply the simple direct method, that is without any adjustments, the OECD will derive the employment estimates using a simplified component method with adjustments from the labour force survey.
Proposal for improving our international comparison of productivity estimates and wider impact on UK productivity inputs and National Statistics
When comparing labour productivity across countries we are faced with two options: Do we use the best estimate measured by each country, on the basis that the country understands its data better than any other or do we use a consistent method across all countries to produce estimates on the same basis?
Using data from the OECD’s productivity database alongside a small number of adjustments with a component method can bring those countries using the direct method into a broadly comparable basis to those that already apply the component method. However, for countries that apply the simple direct method the database will contain OECD derived values and will only include adjustments for actual hours sourced from the EU Labour Force Survey (EU-LFS). The EU LFS is another set of questions countries collect from the national labour force survey. As the data are collected across the EU countries systematically it can provide a comparable basis across the countries including the UK.
The aim is to identify a source that is comparable across all countries. So when compiling estimates of ICP, we propose to review incorporating the OECD’s proposed methodology in our ICP publication using the simplified component method, applying the same adjustment to estimates for deriving actual hours worked consistently across the countries. We recognise this may not necessarily be the best estimate of productivity across the countries as some may have better national sources such as administrative data to capitalise on; it is a more coherent method for making comparisons across countries.
Table 2 summarises the adjustments we propose to apply consistently to all countries when compiling ICP estimates. These are consistent with the OECD’s simplified component approach. This proposal is subject to the availability of relevant data from other countries and we would need to gain access to the EU-LFS data. In the absence of sustainable data sources, we would need to review if it is meaningful to continue producing estimates of ICP drawn from heterogeneous methods, sources and adjustments applied by different countries.
| Average weekly hours | x | Annual weeks worked |
|---|---|---|
| + usual hours in main job + extra hours in main job (= overtime + variable hours - flexi) + hours in additional jobs | 52 weeks less - holiday weeks - full week absence (non-holiday) - part-time absence - absence due to sickness and/or maternity |
Download this table Table 2: Proposals for improving international comparison of productivity (ICP) estimates
.xls .csvThese recent findings may also have a wider impact on the UK labour productivity estimates. The OECD findings do not on their own suggest that the UK should change its methodology, but the suggestion that the UK hours could be overstated is something we will investigate. We have estimated UK productivity using the direct method because it has historically been the best method given the data available in the UK. On a national level, it would not be possible to apply the component method in the short term. However, as work on administrative data is evolving, it may be possible to consider applying the component method in the long run.
In the interim we will complete a scoping study to identify sustainable sources to capture conceptual and exhaustiveness adjustments on the economic territory, the unobserved economy and any other adjustments that are consistent with the national accounts production boundary and Eurostat’s tabular approach used in the gross national income (GNI) process table. The study will review dependencies with wider labour market statistics and the current availability of administrative sources for estimating variables to derive actual hours worked such as sick absences that will be analysed against the current Labour Force Survey responses.
As national labour productivity estimates are a National Statistic and therefore follow the UK Statistics Authority’s Code of Practice for Statistics, which requires consultation with users, the final details of the feasibility study will be agreed after consultation with users.
Conclusions
We have seen significant differences in the productivity between the UK and other G7 countries with output per hour worked in the UK being lower than many G7 countries. With good international co-operation, we initiated a review that was led by the OECD, which concluded that although countries produced common variables of labour inputs, such as hours worked or employment in persons or jobs, the methodologies, data sources and adjustments varied significantly across countries. Actual hours worked across countries were significantly affected by the method used to estimate labour inputs.
When making international comparisons, a more harmonised method across all the countries is more favourable than the best estimate that is available by each country, as labour inputs can be compiled across countries using heterogenous methods and sources. The findings have also initiated a review of the current methodology used to compile our national labour productivity series.
The OECD recognises the direct method of estimating hours worked is not necessarily inferior to the component-based approach, though without the use of additional adjustments it could potentially overestimate the actual hours worked. The UK is particularly affected as it is one of the few countries using the direct method because it has historically been the best method to use given the data available. Although these methodological differences can partly explain the productivity gap between the UK and other G7 countries, it does not eliminate it. However, by improving our current methodology and reviewing the coverage and exhaustiveness of our data inputs, we can potentially make better informed comparisons of labour productivity.
References
Eurostat (2019) Statistics Explained, EU labour force survey – methodology
Eurostat (2005), Eurostat’s tabular approach to exhaustiveness, 5th Meeting of the GNI committee, Luxembourg (PDF 609KB), sourced from Statistics Denmark
Heys R (2018), Productivity gap narrows, ONS blog in economy
Organisation for Economic Co-operation and Development (2018), International productivity gaps: are labour input measures comparable?, OECD working papers 2018/12
Office for National Statistics (2019), Improving estimates of labour productivity and international comparisons
Office for National Statistics (2012), International comparisons of productivity quality and methodology information
Office for National Statistics (2018), International comparisons of UK productivity (ICP), final estimates: 2016
Office for National Statistics (2018), Labour force survey – user guidance
Office for National Statistics (2017), Labour productivity quality and methodology information
Nôl i'r tabl cynnwys