1. Main points
This article compares regional labour productivity in the UK, Germany, Italy, France, Spain and the Netherlands and also provides additional context on regional economic performance via data on employment rates and household incomes.
Île-de-France, which includes the city of Paris, is the region with the highest labour productivity, 54 % above the UK average, followed by London at 39% above the UK average.
Four of the next 10 ranked regions are to be found in Germany and two each in the Netherlands, Italy and Spain.
Of the UK’s 12 regions, 8 are amongst those with the lowest productivity levels; they make up 8 of the 14 lowest ranked regions alongside regions of eastern Germany and southern Italy.
UK regions rank more favourably when comparing disposable household incomes across regions, rather than productivity, with average household incomes per head in southern regions of Spain and Italy around 15% below those in the lowest ranked UK region; low employment rates in these southern regions of Spain and Italy are an important influencing factor.
The regions with the highest disposable household incomes per head are typically those that combine high productivity levels and above-average employment rates; this includes London, the South East and East of England regions in the UK alongside many regions in Germany.
2. Things you need to know about this release
To make valid international comparisons of economic performance across European countries, it is important that appropriate metrics of economic performance and comparable geographies are used and comparable geographies are used. This section outlines the metrics and geographies used in this article and provides the rationale behind these choices. It also notes why some alternative metrics and geographies risk providing misleading results.
What is labour productivity?
Labour productivity is defined as the quantity of goods and services produced per unit of labour input, for example, per hour worked, per filled job or per worker. It is one of the most widely used measures of economic performance of a nation or an area. Productivity matters because increasing productivity is critical to increasing economic growth in the long-run. This follows from the fact that economic output can only be increased by either increasing the amount of inputs or by raising productivity. Furthermore, changes in labour productivity are also related to changes in real wages. Increasing productivity is, therefore, an important aim for both national and local economies.
As shown in our Regional and subregional productivity publication, there is currently a wide spatial divergence in levels of productivity between different UK subregions. This article provides further context to those results by comparing UK regions with regional productivity levels in France, Germany, Italy, Netherlands and Spain.
Productivity metric (GDP per worker)
Labour productivity in this article is measured as gross domestic product (GDP) per worker where GDP is measured at current prices and expressed at the purchasing power standard (PPS) to avoid distortions arising from different price levels across countries. Note that gross value added (GVA) per hour worked would also be an appropriate measure of labour productivity to use in such an analysis. In this case, however, we have chosen GDP per worker as GVA per hour worked data are currently unavailable for every country in our sample. Differences between productivity based on GVA per hour worked and GDP per worker calculations are negligible.
Note that the labour market data used in the productivity calculations have been based on the area of workplace of each worker. This means the labour input is being measured on the same geographical basis as the economic output (GDP).
Choosing comparable geographies
The Nomenclature of Territorial Units for Statistics (NUTS) classification is a geographical classification for statistical production across Europe. There are three levels of the geography and in the UK, this equates to 12 NUTS1 regions, 40 NUTS2 regions and 173 NUTS3 regions. In this article, the NUTS1 geography is used to show data for regions, while a combination of NUTS2 and NUTS3 areas is used to show data for subregions. This combination of NUTS2 and NUTS3 subregions consists of all the UK NUTS2 areas along with all the NUTS2 areas from the other countries, provided the subregion’s population is less than 5 million inhabitants. For those NUTS2 areas where the population exceeds 5 million, the NUTS2 area has been replaced by its constituent NUTS3 subareas. This means the mix of NUTS2 and NUTS3 regions continues to provide full geographic coverage for all countries included but avoids comparing very differently sized areas.
The examples of London and Paris help to explain why we have chosen to conduct the subregional analysis on a mix of NUTS2 and NUTS3 regions. The guidance for NUTS2 geographies suggests, amongst other factors, that they should follow a population range between 800,000 and 3 million people. The majority (including all UK NUTS2 areas) do so. However, there are some important exceptions, such as Île-de-France, covering the Greater Paris area, which has a population of over 12.0 million but is counted as just one NUTS2 area. London by comparison is split into five NUTS2 areas each with a population between 1.1 million and 2.2 million. Comparing the whole of Île-de-France with separate areas of London is not ideal for statistical analysis. By replacing Île-de-France in the analysis with its eight constituent NUTS3 areas, which have populations between 1.2 million and 2.2 million, it allows for far more meaningful comparisons of the Paris and London data. Other NUTS2 areas that have been replaced with their constituent NUTS3 areas in this analysis include Lombardy, Andalusia and Dusseldorf.
The above mix of NUTS2 and NUTS3 areas has some clear benefits for analysis purposes over using NUTS2 areas alone, particularly in ensuring a more valid comparison across some of Europe’s largest cities. However, the method used is only one possible choice. A downside, for example, is that by introducing extra NUTS3 regions, there are several areas with small population levels introduced into the analysis. Overall, however, we view the benefits of the approach as outweighing the downsides.
For future analysis, alternative approaches could include setting a different threshold, or including a minimum population threshold (although that would mean full geographical coverage would be lost), or combining some of the NUTS3 areas within a large NUTS2 area to create new areas.
Additionally, for urban areas, it might be possible to base a future analysis on the Functional Urban Area geography developed by Eurostat, albeit this excludes rural areas. We would be happy to receive feedback on the approach we have taken in this report and ideas for how best to address these issues of comparability in future.
Data sources and comparability
Regional data for France, Germany, Italy, the Netherlands and Spain are taken from the Eurostat website, where comparable data are collated from all the EU countries. For the UK, the data are designed to be comparable to the data published in the annual Regional and subregional productivity release, although it should be noted the metrics used differ. In this publication, and on the Eurostat website, data are based on GDP per worker, as compared with GVA per job filled in the regular ONS publication. Both definitions fit the definition of labour productivity as the quantity of goods and services produced per unit of labour input.
The country data used in Figures 5 and 7 are also taken from the Eurostat website. Please note that the data in this publication are not an exact match with the data for European countries as reported in our International comparisons of productivity publication. Those data are compiled from Organisation for Economic Co-operation and Development (OECD) sources and there are some differences between those data and the data collated in this output. In this article, we have used the Eurostat data for countries to provide consistency with the regional data presented in the article. As such, the country data in this publication are only provided for indicative purposes to provide context to the regional data provided. For national comparisons of productivity data, the recommendation is to refer to and use the ONS International comparisons of productivity publication.
Net disposable income of private households per head
As well as providing data on productivity, this article also examines data on household incomes. This is to provide some additional context on economic performance. Unlike productivity, which is a workplace measure (it compares the output from workplaces with the labour input at the location of the workplace), household incomes are measured on a residence basis.
The definition used by Eurostat is:
“The disposable income of private households is the balance of primary income (operating surplus/mixed income plus compensation of employees plus property income received minus property income paid) and the redistribution of income in cash. These transactions comprise social contributions paid, social benefits in cash received, current taxes on income and wealth paid, as well as other current transfers. Disposable income does not include social transfers in kind coming from public administrations or non-profit institutions serving households.”
For the UK, these data are supplied to Eurostat to be comparable with the Regional gross disposable household income dataset published annually by Office for National Statistics (ONS).
Note on GVA (or GDP) per head
This article explores economic performance across regions through the deliberate use of a workplace productivity measure (GDP per worker) and a residence-based household income measure (net disposable household income per head). By contrast, GDP per head (or GVA per head) is not used and this omission is deliberate because GDP per head can provide misleading estimates of economic performance and disparities at the regional and subregional level, particularly for areas such as Inner London that have high net-commuting flows.
The problem is that the GDP per head gets heavily influenced by these commuting flows because it compares a workplace measure of economic output (GDP) with a residence-based measure of population. As an extreme example, consider the City of London (the local authority area of the City of London Corporation, often known as the square mile). A large share of its GDP is produced by commuters. A good productivity measure will take account of this and divide the output produced in the City of London by all the labour input involved including that from all the 300,000 plus in-commuters. However, GVA per head takes all this GDP, ignores all the net in-commuters, and just divides output by the small population (9,000) who live there. As such, GVA per head for the City of London is extremely high and provides neither an accurate proxy for productivity or household incomes for its inhabitants. Furthermore, analysis using GVA per head in this manner risks significantly over-estimating actual regional economic disparities that exist between areas.
GDP per head analysis for European NUTS2 geographies that shows Inner London West having vastly higher GDP per head than any other region is an example of this misleading over-estimation of regional disparities in action. The Inner London West data are highly influenced by in-commuting and as such should not be regarded as a valid estimate of its economic performance. To get a valid comparison between areas it is instead necessary to compare either productivity (as measured, for example, by GVA per worker) where both the numerator and denominator are measured on a workplace basis, or household incomes (as measured, for example, by gross disposable household income (GDHI) per head) where both the numerator and denominator are measured on a residence basis. This article provides data on both these measures.
Nôl i'r tabl cynnwys3. Results – labour productivity
Figure 1 shows labour productivity for the 52 NUTS1 regions of France (Blue), Germany (Grey), Italy (Green), the Netherlands (Orange), Spain (Yellow) and the UK (Red). Each region is shown in comparison with the average productivity level for the UK. Île-de-France, which includes the city of Paris, is the NUTS1 region with the highest productivity, at 54% above the UK average. This is followed by London at 39% above the UK average.
Following Île-de-France and London, 4 of the next 10 ranked regions are to be found in Germany and two each in the Netherlands, Italy and Spain. In the case of Germany, these four regions are Hamburg, Hesse, Bavaria and Baden-Württemberg, which include the cities of Hamburg, Frankfurt, Munich and Stuttgart respectively. In the Netherlands, the West region (including Amsterdam, The Hague and Utrecht) has the highest productivity followed by the North region (which includes Groningen). In Italy, productivity is highest in the Northwest region including Milan, Turin and Genoa followed by the Northeast region including Bologna. In Spain, productivity is highest in the NUTS1 regions of Community of Madrid and Northeast, which include the cities of Madrid and Bilbao respectively.
Aside from London, the only UK region amongst the top half of regions shown in Figure 1 is the South East (ranked 17 of the 52 regions). By contrast, UK regions dominate amongst those with the lowest productivity levels, alongside subregions of eastern Germany and southern Italy. Wales is the region with the lowest productivity, with an index of 78.5.
In the case of France, similar to UK, there is a large gap between the productivity of its capital city compared with the next highest-ranking region (the Central East region, which includes Lyon). However, unlike the UK, the rest of the French NUTS1 regions are then clustered at close to the UK average.
Figure 1: Labour productivity by NUTS1 regions in 2014
UK and selected EU countries, Index UK=100

Source: Office for National Statistics, Eurostat
Download this image Figure 1: Labour productivity by NUTS1 regions in 2014
.png (47.6 kB) .xls (30.2 kB)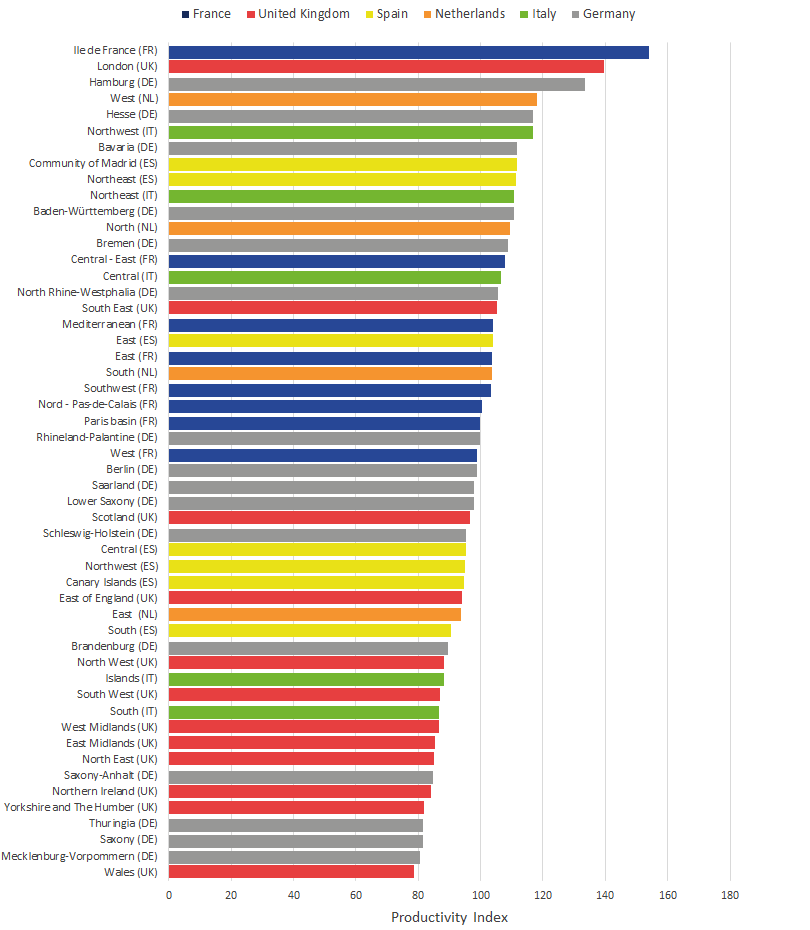
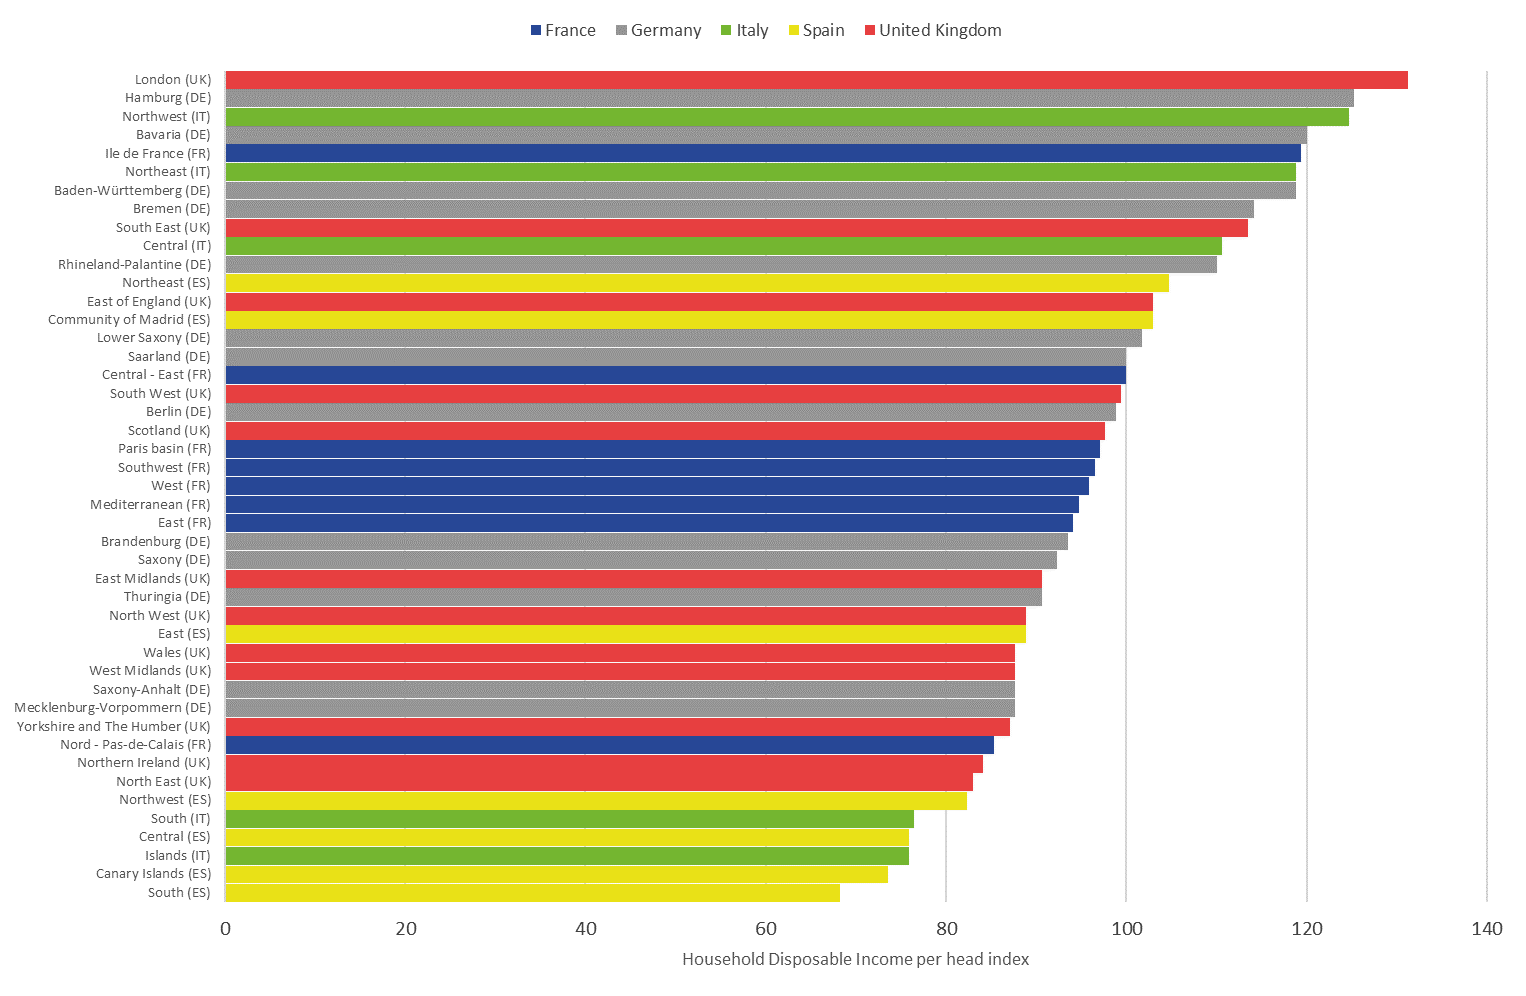
Figure 2 shows the distribution of labour productivity at a more disaggregated geographical level encompassing 221 NUTS2 and NUTS3 subregions covering the same countries of the UK, Germany, France, Spain, Italy and the Netherlands. The subregions with the highest and lowest labour productivity are then shown in greater detail in Figures 3 and 4.
Figure 2 shows that the majority of regions have labour productivity within 20% of the UK average, with only a relatively low share having productivity outside this range. The 40 UK subregions are shown as red dots in Figure 2. The majority of UK subregions are amongst the subregions with lower levels of productivity, with a large cluster at around 15% to 20% below the UK average (see Figure 4 for further details).
Figure 2: Labour productivity by selected NUTS2 and NUTS3 subregions in 2014
UK and selected EU countries, Index UK=100
Embed code
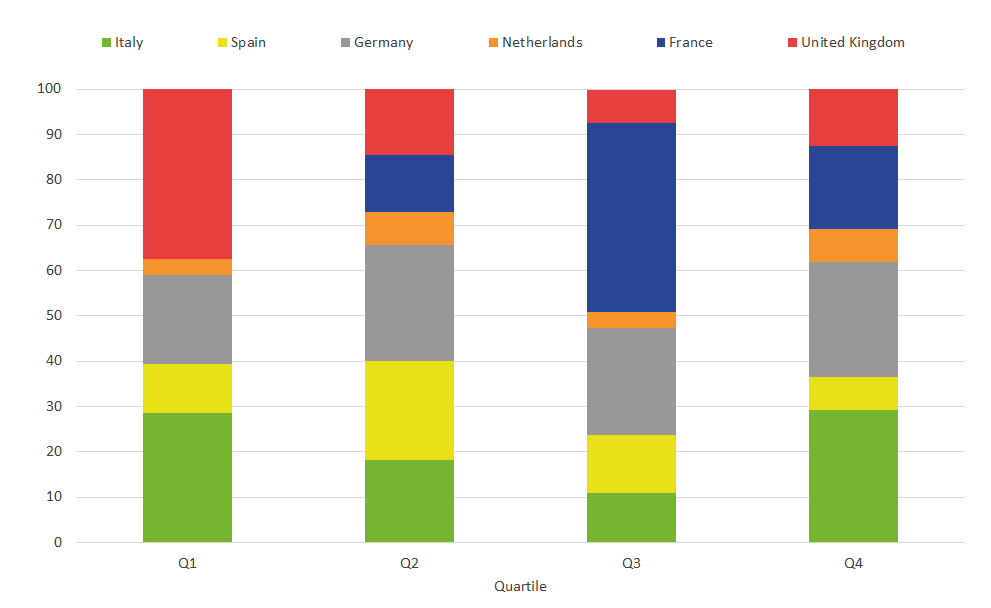
Figure 3 distributes the subregions into four quartiles (with equal numbers of regions in each) based on the labour productivity values. It shows 37.5% of the lowest productivity regions within Quartile 1 (Q1) belong to the UK (with productivity between 12% to 26% below the UK average). Italian subregions amount to 28.6% of the NUTS2 and NUTS3 regions in Q1, the next highest share in this quartile. No French subregions fall into this category.
By contrast, French NUTS2 and NUTS3 regions amount to 18.2% of the total composition of Quartile 4 (Q4) and 41.8% of the total composition of Quartile 3 (Q3). Germany has a relatively homogenous distribution comprising 19% to 25% of each quartile.
Figure 3: Productivity quartile distribution of selected NUTS2 and NUTS3 subregions in 2014
UK and selected EU countries, %
Source: Office for National Statistics, Eurostat
Download this image Figure 3: Productivity quartile distribution of selected NUTS2 and NUTS3 subregions in 2014
.png (12.1 kB) .xls (28.7 kB)
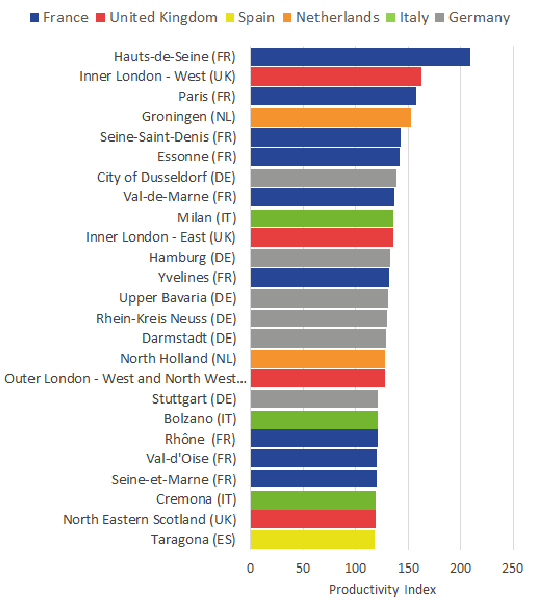
Figure 4 shows the 25 subregions with the highest levels of labour productivity. Hauts-de-Seine, which includes the La Défense area of Paris, and Inner London West, which includes the City of London, are the subregions with the highest productivity (seven other subregions of Île-de-France and two other subregions of London are also included in Figure 2). The only other UK subregion included is North Eastern Scotland, which includes Aberdeen with its focus on the oil industry.
Figure 4: Labour productivity in the 25 highest-ranking selected NUTS2 and NUTS3 subregions in 2014
UK and selected EU countries, Index UK=100
Source: Office for National Statistics, Eurostat
Download this image Figure 4: Labour productivity in the 25 highest-ranking selected NUTS2 and NUTS3 subregions in 2014
.png (28.3 kB)
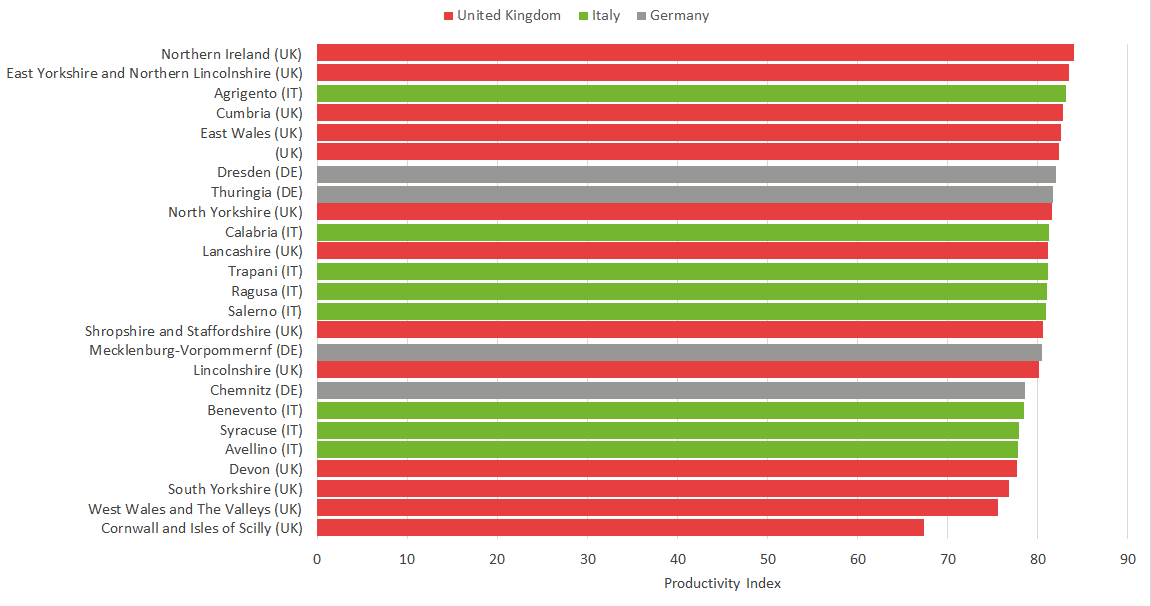
Figure 5 shows the 25 subregions with the lowest labour productivity. The subregions shown are all located either in the UK, southern Italy or eastern Germany, with no subregions of France, the Netherlands or Spain included.
Figure 5: Labour productivity in the 25 lowest-ranking selected NUTS2 and NUTS3 subregions in 2014
UK and selected EU countries, Index UK=100
Source: Office for National Statistics, Eurostat
Download this image Figure 5: Labour productivity in the 25 lowest-ranking selected NUTS2 and NUTS3 subregions in 2014
.png (32.4 kB) .xls (29.2 kB)
Overall, the aim of this article has been to provide data on a comparable basis to compare similarly-sized regions. However, Figure 6 provides one alternative treatment of the data that may help provide some extra context in considering UK regional productivity performance. It shows the 12 UK NUTS1 regions alongside country averages for each of the EU28 countries. The population of these countries can vary substantially, so care should be taken when comparing countries with the UK regions (whose populations range from around 1.8 million to 8.8 million). The data show the Republic of Ireland and Belgium as having comparable productivity levels to London, while at the lower end of the scale, the UK subregions with the lowest productivity (Northern Ireland and Wales) have similar productivity levels to Slovenia, Slovakia and the Czech Republic.
Figure 6: Labour productivity by UK NUTS1 regions and selected EU countries in 2014
Index UK=100
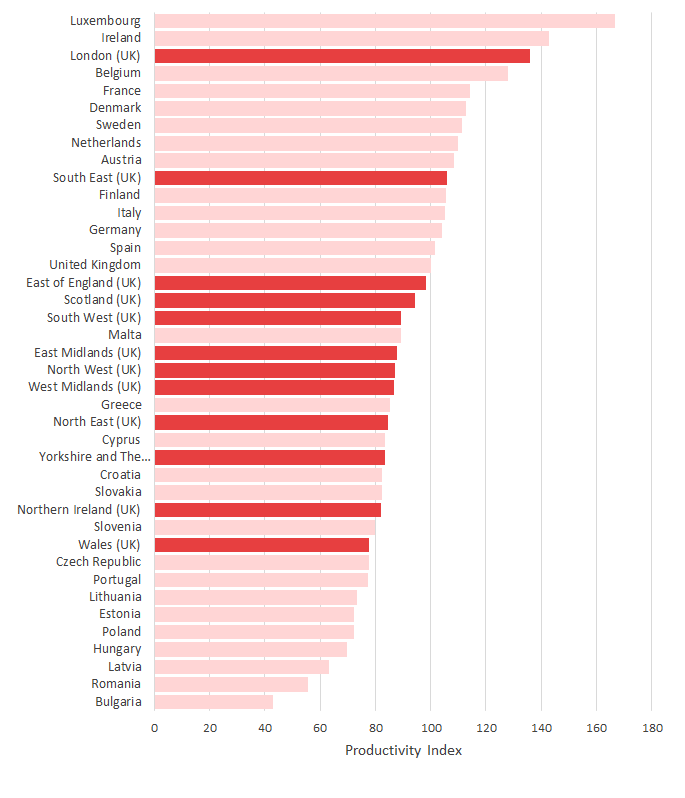
Source: Office for National Statistics, Eurostat
Download this image Figure 6: Labour productivity by UK NUTS1 regions and selected EU countries in 2014
.png (29.9 kB) .xls (30.7 kB)
4. Results – employment rates and household incomes
Figures 1 to 6 show that the productivity performance of many UK regions is relatively poor compared with regions across France, Germany, Italy, the Netherlands and Spain. Productivity performance is an important metric in assessing the economic performance of a region and over time growth in productivity is an important element towards increasing incomes and wealth in an economy. However, it is not the only metric to consider when assessing regional economic performance. This section provides some additional context to the productivity analysis by providing data on employment rates and household incomes, on both of which UK regions are ranked more highly.
Figure 7 shows regional employment rates1 across the six countries included in the analysis. A general pattern emerges whereby regions in the UK, Germany and the Netherlands cluster towards the upper end of the distribution, whilst regions in France and, in particular, Spain and Italy congregate at the lower end. Furthermore, the differences in employment rates between countries are quite large.
The employment rate in 2014 (note data are shown for 2014 to be consistent with other figures in this article) in the Islands region of Italy was 41.4%, in the South region of Spain it was 47.4%, and in the Nord-Pas-de-Calais region of France it was 57.6%. These employment rates were all much lower than the lowest ranked UK region, which was Northern Ireland, with an employment rate of 66.8%.
Figure 7: Employment rates by NUTS1 regions in 2014
UK and selected EU countries, %
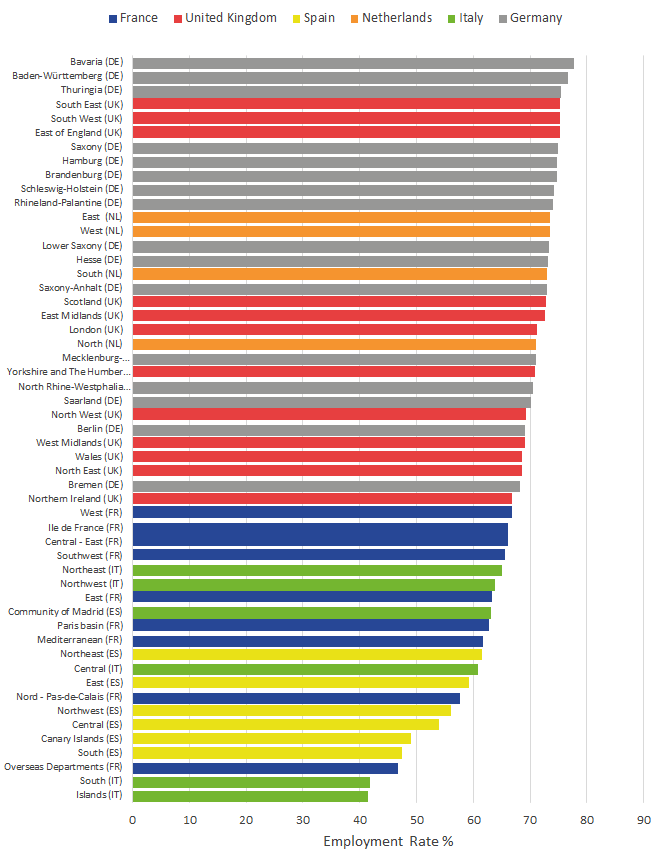
Source: Office for National Statistics, Eurostat
Download this image Figure 7: Employment rates by NUTS1 regions in 2014
.png (41.8 kB) .xls (31.2 kB)
Figure 8 ranks NUTS1 regions2 according to their household disposable income per head3. When compared with the similar chart (Figure 1) showing productivity comparisons, several differences are apparent, with regions in Germany and UK ranked relatively higher in terms of incomes than for productivity, while the opposite is true for Spain and Italy.
Figure 8 shows that it is regions in Spain and the south of Italy that have the lowest household incomes (by comparison, Figure 1 showed that the UK had the region with the lowest productivity). In the South region of Spain and the South region of Italy, household incomes per head are over 30% below the UK average and around 15% below the average for the lowest ranked UK region, Northern Ireland.
These data suggest therefore that while productivity (which measures output produced per worker) is relatively high in many Spanish and Italian regions compared with many in the UK, the much lower employment rates in those two countries, particularly in the regions in the south of each country, mean that the amount of household income per person in some of these regions is quite a bit lower than is the case in the UK.
At the other end of the distribution, the highest average household income per head is in London, closely followed by three German regions, Hamburg, Bavaria and Baden-Württemberg. Overall, 7 of the top 10 ranked regions are in Germany, reflecting the mix of strong productivity and high employment rates across much of the country. The other regions within the top 10 ranking are Île-de-France, covering the Greater Paris area, and the South East region of England.
Figure 8: Net disposable household income per head (PPS) by NUTS1 regions in 2014
UK and selected EU countries, Index UK=100
Source: Office for National Statistics, Eurostat
Download this image Figure 8: Net disposable household income per head (PPS) by NUTS1 regions in 2014
.png (54.8 kB) .xls (30.7 kB)
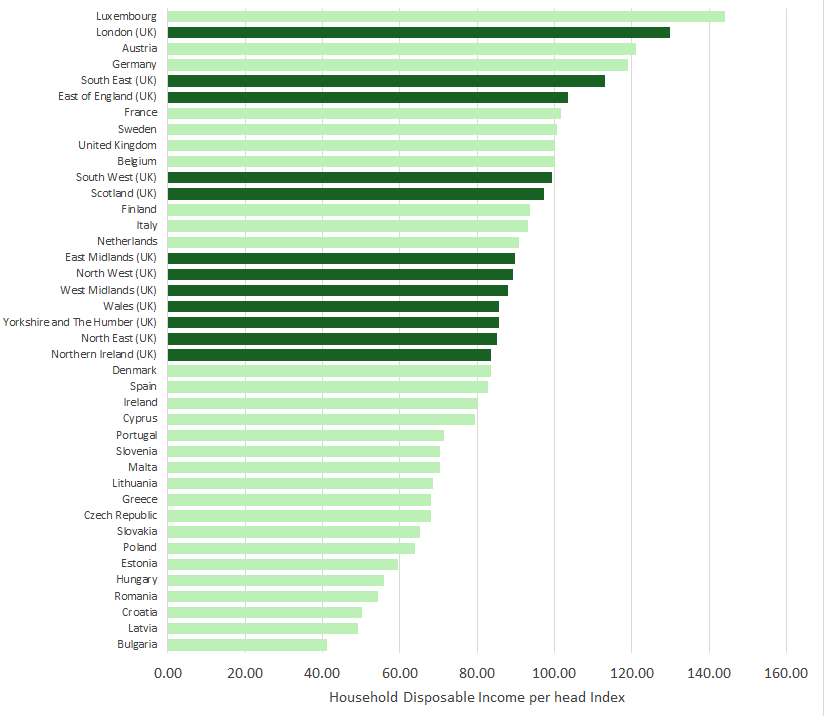
Data on household incomes are not available via Eurostat for all NUTS3 areas, so it is not possible to provide an equivalent NUTS2 and NUTS3 analysis to compare with Figures 2 to 4 on productivity. However, Figure 9 provides an equivalent chart to Figure 6 in ranking UK NUTS1 regions against EU countries (net disposable household income data are not available for Croatia and Luxembourg). Care should be taken when comparing regions with countries given the very different sized populations in some cases. However, it provides some indicative context.
London and the South East of England are shown to have household incomes per head broadly similar to Germany and Austria, while the UK regions with the lowest average household income per head have similar values to the country averages for Spain and Denmark and the Republic of Ireland. UK regions are ranked higher on this incomes comparison than was the case for productivity. Figure 6 shows that productivity in the lowest-ranked UK regions is equivalent to productivity in Slovenia, Slovakia and the Czech Republic. However, Figure 9 shows that the lowest-ranked UK regions have household incomes per head around 11% higher than these three countries.
Figure 9: Net disposable household income per head index by UK NUTS1 regions and selected EU countries in 2014
Index UK=100
Source: Office for National Statistics, Eurostat
Download this image Figure 9: Net disposable household income per head index by UK NUTS1 regions and selected EU countries in 2014
.png (29.3 kB) .xls (30.2 kB)
Notes for: Results – employment rates and household incomes
The source for the employment rate data is the EU Labour Force Survey (EU-LFS). This is a quarterly household sample survey conducted in all Member States of the EU. The EU-LFS survey follows the definitions and recommendations of the International Labour Organisation (ILO).
Data for the Netherlands have not been included due to concerns about the comparability of the data. Additionally, net disposable income data are not available for the following NUTS1 German regions: Hesse, North Rhine-Westphalia, Schleswig-Holstein.
According to Eurostat, the disposable income of private households is the balance of primary income (operating surplus divided by mixed income plus compensation of employees plus property income received minus property income paid, social benefits in cash received, current taxes on income and wealth paid, as well as other current transfers). Disposable income does not include social transfers in kind coming from public administrations or non-profit institutions serving households.
5. Conclusion
This article has compared indicators of economic performance in regions and subregions of the UK with those in France, Germany, Italy, the Netherlands and Spain. Both the choice of metric and geography are important when making such comparisons, and an aim of the article has been to ensure a good degree of comparability between the geographical areas included as well as providing guidance on the most appropriate metrics for such an analysis.
The labour productivity comparisons show that London is close to the top of the rankings alongside Paris. However, the majority of UK regions and subregions have relatively low productivity with levels similar to those in eastern Germany and southern Italy.
Productivity performance is an important metric in assessing the economic performance of a region and, over time, growth in productivity is an important element towards increasing incomes and wealth in an economy. However, it is not the only metric to consider when assessing regional economic performance. The article, therefore, also provides data on employment rates and household incomes. UK regions are ranked higher on these two metrics.
Nôl i'r tabl cynnwys