Cynnwys
- Main points
- Things you need to know about this release
- Summary of net lending or borrowing positions by sector
- Real household disposable income
- Households saving ratio
- Summary of revisions to net lending or borrowing positions
- Links to related statistics
- Links to related analysis
- Upcoming changes to this bulletin
- Quality and methodology
- Appendix A: key economic indicators
- Appendix B: additional information on the alternative measures of households’ income and savings
- Acknowledgements
1. Main points
- In the latest quarter, UK net borrowing from the rest of the world increased slightly to 4.6% of gross domestic product (GDP), the highest position since Quarter 3 (July to Sept) 2016.
- In the latest quarter, corporations and government experienced increases in their net borrowing positions, offset by a reduction in households' net borrowing.
- It was an unprecedented ninth consecutive quarter of households being net borrowers, although their net borrowing decreased to 0.8% of GDP from 1.4% in the previous quarter.
- Despite the household saving ratio increasing to 4.5% in the latest quarter, the highest since Quarter 4 (Oct to Dec) 2016, it remains historically low and is the joint-ninth lowest quarterly saving ratio since records began in 1963.
- In Quarter 4 (Oct to Dec) 2018, UK investment in non-financial assets (gross fixed capital formation) growth slowed to 0.6%, compared with the same quarter a year ago, due to a slowdown across most UK sectors; this was the slowest growth since Quarter 1 (Jan to Mar) 2013.
- Financial corporations experienced an unprecedented sustained fall in net acquisitions of shares issued by the rest of the world in all four quarters of 2018, resulting in the largest annual fall since records began in 1987.
- In the latest quarter, financial corporations issued the largest amount of short-term loans (£138.5 billion) since Quarter 1 (Jan to Mar) 2008 (£151.3 billion), of which £84.9 billion was in foreign currency loans to the rest of the world.
2. Things you need to know about this release
This bulletin includes new data for the latest available quarter, Quarter 4 (Oct to Dec) 2018 and revisions to data from Quarter 1 (Jan to Mar) 2018 to Quarter 3 (July to Sept) 2018.
This bulletin follows the National Accounts Revisions Policy.
The alternative measures of households’ income and saving
Following changes introduced in our previous bulletin, this release now incorporates the alternative measures of real households’ disposable income and saving.
This decision was made as a result of growing user interest in the Alternative measures of households’ income and saving experimental statistics since their launch in August 2015.
In effect, the underlying data has been moved into the Households chapter (Chapter 6) of the UK Economic Accounts and the accompanying analysis onto this bulletin. They are both released on the same day. Previously, the alternative measures of real household disposable income and households’ saving ratio were released roughly a week later.
We hope users find this more timely analysis of households’ financial situation useful and helpful, and we continue to welcome feedback.
Understanding the sector and financial accounts
This bulletin presents analysis on UK aggregate data for the main economic indicators and summary estimates from the institutional sectors of the UK economy that are presented in the UK Economic Accounts (UKEA) dataset:
- public corporations
- private non-financial corporations
- financial corporations
- households
- non-profit institutions serving households (NPISH)
- central government
- local government
- rest of the world
This bulletin uses data from the UKEA and it provides detailed estimates of national product, income and expenditure, UK sector, non-financial and financial accounts, and UK Balance of Payments. These accounts are the underlying data that produce a single estimate of gross domestic product (GDP) using income, production and expenditure data.
Further information on the calculation of some of our main economic indicators can be found in the Quality and Methodology section of this bulletin.
Estimates within this release
All data within this bulletin are estimated in current prices (also called nominal prices), except for real household disposable income, which is estimated in chained volume terms.
Current price series are expressed in terms of the prices during the time period being estimated. These describe the prices recorded at the time of production or consumption and include the effect of price inflation over time. Chained volume series (also known as real terms) have had the effects of inflation removed.
All figures given in this bulletin are adjusted for seasonality, unless otherwise stated. Seasonal adjustment removes seasonal or calendar effects from data to enable more meaningful comparisons over time.
The Population estimates for the UK, England and Wales, Scotland and Northern Ireland used in this release are those published on 28 June 2018.
Nôl i'r tabl cynnwys3. Summary of net lending or borrowing positions by sector
Figure 1: UK net borrowing from the rest of the world increased slightly to 4.6% of GDP in the latest quarter; the highest position since Quarter 3 2016
Net lending (+) or borrowing (-) position as a percentage of GDP, non-financial account, seasonally adjusted, Quarter 1 (Jan to Mar) 1987 to Quarter 4 (Oct to Dec) 2018
Source: Office for National Statistics
Notes:
- Sum of net lending or borrowing positions may not sum to zero in later years due to unbalanced Supply and Use tables in the compilation of GDP. To find out more see: Balancing the Three Approaches to Measuring Gross Domestic Product, 2012
Download this chart Figure 1: UK net borrowing from the rest of the world increased slightly to 4.6% of GDP in the latest quarter; the highest position since Quarter 3 2016
Image .csv .xlsThe UK were net borrowers from the rest of the world in Quarter 4 (Oct to Dec) 2018, with net borrowing at 4.6% of gross domestic product (GDP); slightly up from 4.5% in the previous quarter and the highest since Quarter 3 (July to Sept) 2016 when they were net borrowers of 6.5% of GDP. This means that the UK spent and invested more than it received in incomes, suggesting a need to draw down assets or build up liabilities. It is the 81st consecutive quarter since Quarter 3 1998 in which the UK has been a net borrower.
Despite reductions in the net borrowing position of general government in the last decade, other UK sectors have recently experienced a movement in the opposite direction. Private non-financial corporations returned to being net borrowers in 2012, after only being net borrowers in two of the ten years prior to that (2006 and 2007). Furthermore, households became net borrowers in 2017 for the first time since 1988 and have continued to be net borrowers in 2018.
As a result, UK net borrowing from the rest of the world has been 4% of GDP (or higher) in five of the last six years since 2013. Before 2013, the UK had only experienced a net borrowing position greater than 4% of GDP on two occasions (1989 and 2008) since records began in 1987.
Figure 2: UK net borrowing was driven by greater net borrowing by corporations and government, offset by a fall in households' net borrowing
Net lending (+) or borrowing (-) position by sector as a percentage of GDP, seasonally adjusted, Quarter 1 (Jan to Mar) 2012 to Quarter 4 (Oct to Dec) 2018
Source: Office for National Statistics
Notes:
NPISH = Non-profit institutions serving households.
Sum of net lending or borrowing positions may not sum to zero in later years due to unbalanced Supply and Use tables in the compilation of GDP. To find out more see: Balancing the Three Approaches to Measuring Gross Domestic Product, 2012
Download this chart Figure 2: UK net borrowing was driven by greater net borrowing by corporations and government, offset by a fall in households' net borrowing
Image .csv .xlsPrivate non-financial corporations
In the latest quarter, private non-financial corporations (PNFCs) were the main contributor to UK’s net borrowing position. Their net borrowing position increased to 2.0% of GDP, from 1.8% in the previous quarter. These levels of net borrowing as a proportion of GDP were last higher in Quarter 3 2016 when it stood at 2.7% of GDP. The recent return of PNFC net borrowing has been largely down to falling incomes and, in the last three quarters, augmented by the build-up of gross capital formation, as Figure 3 highlights. The return to higher net borrowing by PNFCs in 2018 was mainly financed by a draw down in deposits, as reliance on loans eased in the period.
Figure 3: Despite falling incomes, private non-financial corporations have continued to build up gross capital formation, causing a greater net borrowing position in the latest quarters
Changes in the components of private non-financial corporations’ net lending (+) or borrowing (-) position, compared with the corresponding quarter a year ago, £billion, Quarter 1 2017 to Quarter 4 2018
Source: Office for National Statistics
Notes:
- Other changes include net capital transfers and acquisitions less disposals of non-produced non-financial assets.
Download this chart Figure 3: Despite falling incomes, private non-financial corporations have continued to build up gross capital formation, causing a greater net borrowing position in the latest quarters
Image .csv .xlsIn the latest quarter, PNFCs saw growth in gross operating surplus slow to £0.6 billion, compared with the previous quarter increase of £1.7 billion, while income received as dividends fell by £4.0 billion. Despite incomes falling, PNFCs spent to build up their inventories by £4.6 billion. This is now the second consecutive quarter of significant build up in PNFCs’ inventories, averaging at 0.7% of GDP per quarter. This is the fastest build-up of inventories since Quarter 3 2014. Although the underlying data on inventories suggests an increase in inventories in the latest quarter, the increase has been subject to alignment and balancing adjustments in the latest estimates of GDP. This balancing process takes place every quarter and aims to reconcile the three measures of GDP (income, expenditure and output) which are theoretically identical. For further information on adjustments in Quarter 4 (Oct to Dec) 2018, please see the latest GDP quarterly national accounts, UK Statistical bulletin.
Despite businesses increasing their inventories, a form of capital formation, gross fixed capital formation (GFCF) fell for the third consecutive quarter. This is mainly due to business investment (a component of GFCF) experiencing the longest consecutive quarterly decline resulting in the first calendar year with no increase in capital investment since the UK was in the midst of the effects of the recession (see GDP first quarterly estimate, UK: October to December 2018) – although, the recent decline has not been as large as that in 2009 (see Figure 4). The latest Bank of England Inflation Report highlights that this weakness, since the EU referendum, appears to “primarily reflect Brexit and associated uncertainty” and how UK investment growth has recently lagged behind other advanced economies.
Figure 4: Gross fixed capital formation for private non-financial corporations fell for a third consecutive quarter
Private non-financial corporations’ gross fixed capital formation, quarter on previous quarter change, seasonally adjusted, £billion, Quarter 3 (July to Sept) 2008 to Quarter 4 (Oct to Dec) 2018
Source: Office for National Statistics
Download this chart Figure 4: Gross fixed capital formation for private non-financial corporations fell for a third consecutive quarter
Image .csv .xlsPrivate non-financial corporations are not the only sector to be experiencing a slowdown in investment. Figure 5 shows how gross fixed capital formation (that is, investment in non-financial assets) have changed compared with the corresponding quarter a year ago. It shows the underlying slowdown in gross fixed capital formation growth throughout 2018 by corporations, households, and non-profit institutions serving households.
As a whole, UK investment in non-financial assets (gross fixed capital formation) remained weak. It grew 0.6% in Quarter 4 2018, compared with the same quarter a year ago. This is a sharp slow-down given that growth averaged 6.0% per quarter in 2017. Gross fixed capital formation last saw weaker growth in Quarter 1 (Jan to Mar) 2013 (negative 1.3%), as Figure 5 shows.
Figure 5: UK investment in non-financial assets (gross fixed capital formation) grew at its slowest rate in over five years
Gross fixed capital formation by sector, quarter on same quarter a year ago growth rate, percentage, seasonally adjusted, Quarter 1 (Jan to Mar) 2013 to Quarter 4 (Oct to Dec) 2018
Source: Office for National Statistics
Notes:
- NPISH = Non-profit institutions serving households.
Download this chart Figure 5: UK investment in non-financial assets (gross fixed capital formation) grew at its slowest rate in over five years
Image .csv .xlsGeneral government
General government (which includes both central and local government) was the second largest contributor to UK’s net borrowing position.
In Quarter 4 2018, general government net borrowing marginally increased to 1.5% of GDP, from 1.4% in the previous quarter. This was partly due to local government switching from a net lending position of 0.1% of GDP in Quarter 3 2018 to a net borrowing position of 0.3% in the latest quarter.
Local government
Driving the switch to a net borrowing position was a £1.8 billion fall in transfers (that is, flow of money other than taxes, subsidies, investment grants and other capi¬tal transfers) from central government. This followed the largest receipt of transfers (£3.7 billion) since Quarter 2 (Apr to June) 2013 from central government, in the previous quarter. Furthermore, local government funding tends to peak in the first quarter of the financial year, before easing off in the later quarters.
In the financial account, in the latest quarter, local government took out the largest amount of long term loans (£3.3 billion) since Quarter 1 2012 (£7.4 billion). This increase was due to the ongoing borrowing from the Public Works Loans Board and a £1.4 billion central government loan to Transport for London (TfL) to cover increased Crossrail construction costs.
Further analysis on local government can be found in Public sector finances, UK: February 2019.
Central government
Quarter 4 2018 saw a reduction in central government’s net borrowing position to 1.2% of GDP, compared with 1.4% in the previous quarter.
Causing this movement was a fall in transfers (that is, flow of money other than taxes, subsidies, investment grants and other capi¬tal transfers) to local government of £1.8 billion compared with the previous quarter, partly offset by a £0.7 billion increase paid out in investment grants.
Further analysis on central government can be found in Public sector finances, UK: February 2019.
Financial corporations
In Quarter 4 2018, financial corporations were the third largest net borrowers in the UK as their net borrowing position increased to 1.0% of GDP, up from 0.8% of GDP in the previous quarter. This was the third consecutive quarter of net borrowing.
The cause of this quarterly increase in their net borrowing position was an increase of £0.9 billion in income payable on pension entitlements to the household sector and an increase of £0.8 billion in net distributed income of corporations paid out (most of which are dividends).
Overall, in 2018, financial corporations saw their net borrowing position increase to 0.7% of GDP, compared with 0.4% the year before. For the last decade, financial corporations have averaged a net borrowing position of 0.7% of GDP, with 2012 being the only year in which they were net lenders at 0.8% of GDP.
This increase in their net borrowing position in 2018 was mainly due to gross operating surplus falling by £5.1 billion year on year and an increase of £4.1 billion in other social insurance benefits paid out.
In their financial account, financial corporations see a rise in net acquisitions of assets in short-term loans increase compared with the year before – a trend that began in 2015. In 2018, UK monetary financial institutions (MFI) transacted a net of £173.7 billion in short-term loan assets (equivalent to 8.2% of GDP); the largest amount since 2007 when they transacted £517.1 billion (equivalent to a third of the UK economy). Around 80% of UK MFI loans transacted in 2018 took place in the latest quarter, Quarter 4 (Oct to Dec) 2018, mainly attributed to short-term foreign currency loans to non-UK residents.
Continuing with the financial account, financial corporations experienced the largest fall in net acquisitions of shares issued by the rest of the world since records began in 1987. Figure 6 shows that, in 2018, there was a fall in net acquisitions of £169.7 billion (equivalent to 8.0% of GDP) as a result of falls in all four quarters; the first time a sustained fall in net acquisition has occurred for this length of time. This coincides with reinvestment in short-term loans as stated above. On the year, the record fall in net acquisition in 2018 is almost double that of the previous record of 2008, where it was £89.6 billion (equivalent to 5.7% of GDP). Further information on the investment choices of financial institutions based on financial transactions can be found in the MQ5: Investment by insurance companies, pension funds and trusts: October to December 2018.
Figure 6: Financial corporations experienced an unprecedented sustained fall in net acquisitions of shares issued by the rest of the world in all four quarters of 2018
Net acquisition of shares issued by the rest of the world, £billion, non-seasonally adjusted, 1987 to 2018
Source: Office for National Statistics
Download this chart Figure 6: Financial corporations experienced an unprecedented sustained fall in net acquisitions of shares issued by the rest of the world in all four quarters of 2018
Image .csv .xlsSurveys conducted by Office for National Statistics (ONS) to produce estimates for the UK’s financial account position do not systematically collect information on the reasons for various investment decisions made by UK companies and funds. Nevertheless, during routine survey checks, a small number of respondents to our surveys have cited uncertainty connected with the UK’s decision to exit from the European Union as the reason for restructuring their holdings of overseas portfolio equity and debt securities and inward foreign direct investment (FDI) in Quarter 4 2018. There are, however, a range of other factors also affecting headline estimates in the latest quarter, including falling global equity markets, heightened trade tensions, and longer-term mergers and acquisitions decisions by large multinational enterprises. These factors have also occurred alongside a recent trend where UK investors appear to have been reducing their exposure to overseas equity securities. Some evidence suggests a turn toward overseas long-term debt security throughout 2018, which may reflect wider concerns around geo-political instability.
Households
Quarter 4 (Oct to Dec) 2018 was the ninth consecutive quarter in which households were net borrowers in the non-financial account; a trend that began in Quarter 4 2016.
Since Quarter 4 2016, households have experienced an average net borrowing position of 1.2% of GDP. In the latest quarter, households experienced a net borrowing position of 0.8% of GDP (£4.4 billion); a reduction from 1.4% of GDP (£7.2 billion) in the previous quarter. This was their lowest net borrowing position since Quarter 4 2016 when they were net borrowers of 0.7% of GDP.
The reason for this reduction in net borrowing was an increase in wages and salaries (£2.5 billion) as a result of strong growth in wages and salaries in the private sector. Labour market conditions remain strong, as the unemployment rate fell to 4.0% in Quarter 4 2018 (it had not been lower since Quarter 4 1974) and the employment rate increased to 75.8% (at the time, the highest rate since records began in 1971). To further explore the latest labour market statistics, see Labour market overview, UK: March 2019.
Furthermore, an increase in social benefits other than transfers in kind (£1.9 billion) also contributed positively to households’ financial positions. This was due to larger than usual pension pay-outs in the latest quarter.
These positive contributions were partly offset by an increase in expenditure of £3.0 billion, of which £1.1 billion is attributed to expenditure on housing costs (that is, rentals and utility bills) and £0.4 billion due to financial services. These were partly offset by a £0.3 billion fall in expenditure on life insurance.
Figure 7 captures the deterioration of households’ finances that began in 2016, a deterioration that has now stabilised. Households saw a squeeze in their incomes in 2016 as gross disposable income grew at its weakest rate (1.3%) since 2010, while household spending on goods and services grew at its fastest (4.8%) since 2005 – partly due to inflationary pressures pushing up the price of the same basket of goods and services.
Figure 7: Households' unprecedented net borrowing position has been partly financed by loans (other than loans secured on dwellings)
Households' net lending and borrowing position and loans other than secured on dwellings, annuals, £billions, 1997 to 2018
Source: Office for National Statistics
Download this chart Figure 7: Households' unprecedented net borrowing position has been partly financed by loans (other than loans secured on dwellings)
Image .csv .xlsAs a result of this, households’ surplus income after expenditure shifted the sector towards deficit. The latest quarter, Quarter 4 2018, was an unprecedented ninth consecutive quarter of net borrowing for households; meaning that they either had to draw down their assets or build up liabilities to fund their day to day economic activity.
In 2016, evidence suggests that households turned toward long-term loans (such as credit cards) and the disinvestment in mutual funds to fund growing expenditure during the squeeze on disposable incomes.
In 2017 and 2018, evidence shows a sharp drop in deposits made to UK banks by households, as they returned to pre-2016 levels. However, the net acquisition of long-term loans and the disinvestment in mutual funds continued throughout this period.
Non-profit institutions serving households (NPISH)
The NPISH sector (which includes, for example, charities, universities and religious organisations) is by far the smallest in the private sector, but it is nevertheless an important one due to the social benefits it offers UK society.
In Quarter 4 2018, NPISH saw a slight reduction in their net lending position to 0.2% of GDP (£1.0 billion), down from 0.3% (£1.4 billion) in the previous quarter. It was the sixteenth consecutive quarter since Quarter 4 2014 in which NPISH were net lenders.
The slight fall in NPISH’s net lending position was mainly due to a £0.5 billion fall in current transfers received from other sectors, compounded by a £0.3 billion fall in investment grants received.
Overall, NPISH were net lenders of 0.1% of GDP (£2.9 billion) in 2018. The last year NPISH were net borrowers was 1998.
UK activity with the rest of the world
The UK’s current and capital account deficit with the rest of the world (that is, its net borrowing position) widened in the latest quarter to 4.6% of GDP; up from 4.5% in Quarter 3 2018. It was last highest in Quarter 3 2016 when the UK were net borrowers from the rest of the world at 6.5% of GDP.
In the latest quarter, the small increase in UK’s net borrowing with the rest of the world is mainly due to an increase in the net outflow of dividends paid out to foreign investors. Furthermore, the UK’s trade deficit with the rest of the world widened by £0.6 billion as improvements in the trade in services balance were more than offset by a worsening in the trade in goods deficit.
For greater analysis on the UK’s economic activity with the rest of the world, please refer to the Balance of payments bulletin.
Nôl i'r tabl cynnwys4. Real household disposable income
Real household disposable income (RHDI) grew by 1.0% in the latest quarter, the fastest growth since Quarter 2 (Apr to June) 2017 meaning that, after considering price rises experienced by households, incomes after tax grew by 1.0%.
Growth in gross disposable household income (GDHI) contributed 1.7 percentage points to RHDI growth, partly offset by a 0.7 percentage point negative contribution from the impact of inflation, as Figure 8 shows.
Figure 8: Real household disposable income grew by 1.0% in the latest quarter, the fastest growth since Quarter 2 2017
Real household disposable income, quarter on previous quarter growth, percentage, seasonally adjusted, 1998 to 2018
Source: Office for National Statistics
Notes:
- Sum of contributions may not add to RHDI growth due to rounding.
Download this chart Figure 8: Real household disposable income grew by 1.0% in the latest quarter, the fastest growth since Quarter 2 2017
Image .csv .xlsThe growth in GDHI is mainly attributed to strong wages and salaries growth, increasing by £2.5 billion in the latest quarter. Labour market conditions remain strong, as the unemployment rate fell to 4.0% in Quarter 4 (Oct to Dec) 2018 (it had not been lower since Quarter 4 1974) and the employment rate increased to 75.8% (at the time, the highest rate since records began in 1971). To further explore the latest labour market statistics, see Labour market overview, UK: March 2019.
Further contributing to GDHI growth was an increase in social insurance benefits (£1.6 billion) received, due to larger than usual number of pension pay-outs to households in the quarter.
The impact of inflation on household incomes grew in the latest quarter, contributing to the largest annual impact since 2011, in 2018. More information on the drivers of this impact can be found in the Consumer trends bulletin.
Overall, 2018 households’ RHDI (2.2%) rose faster than the wider economy (1.4% – real GDP) for the first time since 2015.
Alternative measure of real household disposable income (experimental)
From the previous release, we have decided that analysis on the alternative measure of RHDI will be included in this release. This alternative (and experimental) measure removes imputed transactions from real household disposable income to better represent the economic experience of UK households. In other words, it captures the immediately accessible and directly observed “cash” available to households to spend or save at that given time point if they so wished to. Deeper detail on methodology can be found in the Alternative measures of UK households' income and saving: April to June 2018 article.
In this cash-based approach, real household disposable income (RHDI) is estimated to have increased 1.3% in Quarter 4 (Oct to Dec) 2018, compared with the previous quarter. This is slightly higher growth compared with the 1.0% RHDI growth on a national accounts basis, as Figure 9 shows.
It is also worth noting that the level of RHDI on a cash-basis is approximately 20% lower than the level of RHDI on a national accounts basis. That is a difference equivalent to 12% of gross domestic product (GDP), meaning that households have 12% of GDP less to spend or save when we remove incomes not immediately accessible or directly observed. Per head, cash-based RHDI stood at £4,000 in the latest quarter, up 1.1% from the previous quarter.
Figure 9: In the latest quarter, real households’ disposable income on a cash-basis grew at a faster rate than RHDI on a National Accounts basis
Real households’ disposable income on a cash-basis and on a National Accounts basis, £billions and growth rates, seasonally adjusted, Quarter 1 (Jan to Mar) 2015 to Quarter 4 (Oct to Dec) 2018

Source: Office for National Statistics
Notes:
-
- RHS = Right-hand side axis.
Download this image Figure 9: In the latest quarter, real households’ disposable income on a cash-basis grew at a faster rate than RHDI on a National Accounts basis
.png (20.1 kB) .xls (48.1 kB)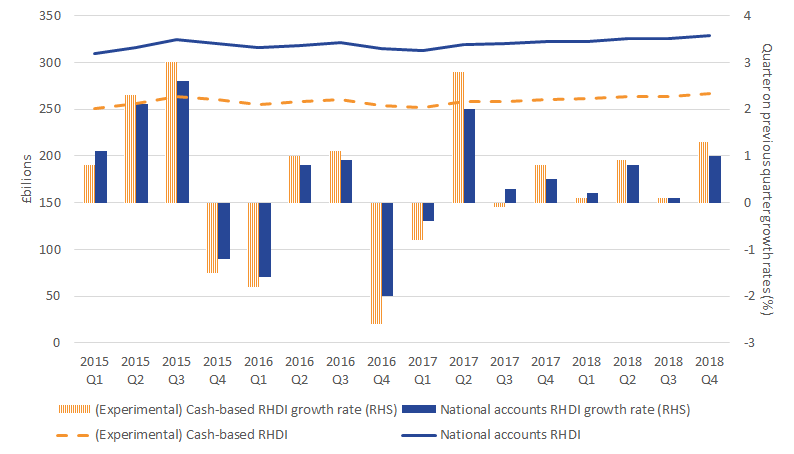
The difference between the two series is mainly explained by the removal of gross operating surplus (which is made up of imputed rentals – that is, what households would pay themselves if they were to rent their own property to themselves) from the national accounts measure of GDHI. This has been the main driver of the difference throughout 2018, as Figure 10 shows.
Figure 10: The main difference in growth rates between gross disposable household income on a cash basis and a national accounts basis is gross operating surplus
Contributions to the difference in growth rates between gross disposable household income on a cash basis and a national accounts basis, £ million, seasonally adjusted, Quarter 1 (Jan to Mar) 2017 to Quarter 4 (Oct to Dec) 2018
Source: Office for National Statistics
Download this chart Figure 10: The main difference in growth rates between gross disposable household income on a cash basis and a national accounts basis is gross operating surplus
Image .csv .xlsThere are six transactions which explain the differences between GHDI on a cash-basis and a national accounts basis. See Table 2 in the appendix for a list of transactions removed from the national accounts measure of RHDI to calculate the cash-based RHDI. A cash-based deflator is also applied to cash-based GHDI to remove the effect of price changes experienced by households to calculate real household disposable income on a cash-basis.
Nôl i'r tabl cynnwys5. Households saving ratio
The households saving ratio rose to 4.5% in the latest quarter, compared with 4.1% in the previous quarter. Despite being the highest since Quarter 4 2016 (4.6%), it remains historically low and is the joint ninth lowest quarterly saving ratio since records began in 1963, as Figure 11 shows.
Figure 11: Households saving ratio increased to 4.5%, compared with 4.1% in the previous quarter, but remains at historically low levels
UK households saving ratio, quarterly, percentage, seasonally adjusted, Quarter 1 (Jan to Mar) 1963 to Quarter 4 (Oct to Dec) 2018
Source: Office for National Statistics
Download this chart Figure 11: Households saving ratio increased to 4.5%, compared with 4.1% in the previous quarter, but remains at historically low levels
Image .csv .xlsThe saving ratio captures the income households have available to save as a proportion of their total available resources (that is current and deferred incomes). Figure 12 breaks down how much of that available income was set aside as pension savings, and how much more income is available to be used for other forms of savings (for example, investment in financial and non-financial assets).
Figure 12 shows that the slight increase in the saving ratio in Quarter 4 (Oct to Dec) 2018 was due to households’ experiencing an increase in non-pension income available for saving (income not already set aside as pension saving). This was possible because of gross disposable income rising more than final consumption expenditure.
Figure 12: Pension savings remains broadly flat in the latest quarter, while income available to save picks up
Contributions to households’ saving ratio, seasonally adjusted, percentage points, Quarter 1 (Jan to Mar) 1997 to Quarter 4 (Oct to Dec) 2018, UK
Source: Office for National Statistics
Notes:
Non-pension savings are calculated as (Gross disposable income minus households’ consumption expenditure) divided by gross disposable income.
Pension saving is calculated as the residual between the saving ratio and non-pension savings
Download this chart Figure 12: Pension savings remains broadly flat in the latest quarter, while income available to save picks up
Image .csv .xlsIn Quarter 4 2018, households’ expenditure increased by £3.0 billion (or 0.9%) compared with the previous quarter, of which £1.1 billion is attributed to expenditure on housing costs (that is, rentals and utility bills) and £0.4 billion due to all financial services. These increases were partly offset by a £0.3 billion fall in expenditure on life insurance. Further detail on households’ final consumption expenditure, including a breakdown of households’ spending by product, can be found in the Consumer trends bulletin.
Households’ pension savings (income set aside in pension plus any change in the value of pension entitlements) fell by £0.9 billion in the latest quarter, the largest fall since Quarter 1 (Jan to Mar) 2017. Since Quarter 1 (Jan to Mar) 2017, pensions savings have contributed around 3 percentage points to the saving ratio, on average. In the decade to 2017 (that is, 2007 to 2016), it contributed 5.3 percentage points on average. In the decade to 2007 (that is, 1997 to 2006), it contributed almost 6.5% on average, signalling a gradual fall in households’ pension savings over time.
Households’ non-pension savings (income available to save, other than pension) contributed an average of 1.2 percentage points to the quarterly saving ratio since Quarter 1 (Jan to Mar) 2017. In the decade to 2017 (that is, 2007 to 2016), it contributed 3.5 percentage points on average, higher than the decade to 2007 (that is, 1997 to 2006) where it contributed 1.2% on average.
Revisions to the saving ratio
This bulletin includes revisions to data from Quarter 1 (Jan to Mar) 2018 in line with the National Accounts Revisions Policy.
The saving ratio has been revised up in all three quarters open for revision by an average of 0.2 percentage points per quarter, with the largest revision occurring in Quarter 3 (July to Sept) 2018 of positive 0.3 percentage points.
The main cause of revision in Quarter 3 2018 is due to later data improving estimates, in particular, other social insurance received by households (revised up by £1.0 billion).
Alternative measure of households’ saving ratio (experimental)
This alternative (and experimental) measure removes imputed transactions from the households saving ratio to better represent the economic experience of UK households. In other words, it captures the immediately accessible and directly observed “cash” available to households to spend or save at that given time point if they so wished to. Deeper detail on methodology can be found in the Alternative measures of UK households' income and saving: April to June 2018 article.
As Figure 13 shows, the cash-basis saving ratio was 1.2% in Quarter 4 2018, up 1.0 percentage points from 0.2% in the previous quarter. The national accounts saving ratio, on the other hand, increased 0.4 percentage points to 4.5% compared with the previous quarter.
Figure 13: UK households’ cash-basis saving ratio increased more than the national accounts saving ratio in the latest quarter
UK households’ cash-basis saving ratio and national accounts saving ratio, quarterly, seasonally adjusted, percentage, Quarter 1 (Jan to Mar) 1997 to Quarter 4 (Oct to Dec) 2018
Download this chart Figure 13: UK households’ cash-basis saving ratio increased more than the national accounts saving ratio in the latest quarter
Image .csv .xlsIn the latest quarter, driving the difference in the change between the national accounts savings ratio and the cash-basis saving ratio is the adjustment for the change in pension entitlements, as shown in Figure 14. The national accounts makes this adjustment to give back to households’ pension income deferred for future use.
Figure 14: The main difference in growth between households' gross savings on a cash basis and a national accounts basis is the adjustment for the change in pension entitlements
Contributions to the difference in growth between households’ gross savings on a cash basis and a national accounts basis, £million, seasonally adjusted, Quarter 1 (Jan to Mar) 2017 to Quarter 4 (Oct to Dec) 2018
Source: Office for National Statistics
Download this chart Figure 14: The main difference in growth between households' gross savings on a cash basis and a national accounts basis is the adjustment for the change in pension entitlements
Image .csv .xls6. Summary of revisions to net lending or borrowing positions
A summary of revisions in the quarters open to revisions (Quarter 1 (Jan to Mar) 2018 to Quarter 3 (July to Sept) 2018) can be seen in Table 1.
Table 1: Summary of revisions to main economic indicators in the UK Quarterly Sector Accounts, Quarter 1 (Jan to Mar) 2018 to Quarter 3 (July to Sept) 2018
| Revisions to Net lending (+) borrowing (-) positions of UK sectors as % of GDP | |||||||
| Non-financial account (B.9n) | |||||||
| Non- financial corporations | Financial corporations | General government | Households | NPISH1 | Rest of the world | ||
| 2018 Q1 | -0.2 | 0.2 | -0.2 | 0.1 | 0.0 | 0.0 | |
| 2018 Q2 | 0.3 | 0.0 | 0.0 | 0.1 | 0.0 | -0.5 | |
| 2018 Q3 | 0.4 | 0.3 | -0.2 | 0.2 | 0.0 | -0.6 | |
| Revisions to Net lending (+) borrowing (-) positions of UK sectors, £ billions | |||||||
| Financial account (B.9f) | |||||||
| Non- financial corporations | Financial corporations | General government | Households | NPISH1 | Rest of the world | ||
| 2018 Q1 | 6.2 | -5.5 | -0.9 | -0.4 | 0.1 | 0.4 | |
| 2018 Q2 | 4.5 | -2.9 | 0.6 | 3.6 | 0.1 | -5.9 | |
| 2018 Q3 | -1.4 | 19.8 | 0.1 | -4.1 | 1.7 | -16.1 | |
| Revisions to other key economic indicators | |||||||
| Households sector | |||||||
| RHDI2 growth rate (quarter on previous quarter, %) | Saving ratio (%) | HHFCE3 Deflator (index points) | |||||
| 2018 Q1 | 0.3 | 0.1 | -0.1 | ||||
| 2018 Q2 | -0.1 | 0.2 | 0.0 | ||||
| 2018 Q3 | 0.1 | 0.3 | 0.0 | ||||
| Source: Office for National Statistics | |||||||
| Notes | |||||||
| 1. Non-profit institutions serving households | |||||||
| 2. Real households' disposable income | |||||||
| 3. Households' final consumption expenditure deflator | |||||||
Download this table Table 1: Summary of revisions to main economic indicators in the UK Quarterly Sector Accounts, Quarter 1 (Jan to Mar) 2018 to Quarter 3 (July to Sept) 2018
.xls (38.4 kB)9. Upcoming changes to this bulletin
Accounting for student loans in the accounts
The implementation date for including this change in the national accounts has yet to be decided and further methodological work is required to establish the exact size of the impact on the government and household accounts. However, when it is implemented we will observe a significant increase in the amount of capital transfers payable from central government to households and a reduction in the amount of interest receivable by central government from households. There will also be a reduction in the stock of loan assets held by central government and an equivalent reduction in loan liabilities of households. For more information, see the announcement on: How we are improving the recording of student loans in government accounts.
If you have any suggestions please contact us by email at sector.accounts@ons.gov.uk.
Withdrawal of series
Within the UK Economic Accounts (UKEA) we publish four series presenting gross value added (GVA) at factor cost (identifiers KGN7, KGN6, KGN5 and YBHH). We are considering withdrawing these series from publication because GVA at factor cost is not recognised with the UN System of National Accounts 2008 (SNA08) framework, therefore we have concerns over the methodology used to calculate these estimates. We propose removing these series from the UKEA publication from the September 2019, and ahead of this we welcome user feedback around the use of these series.
It has been identified that ONS was publishing one economic indicator in two different publications using two different time-series identifiers. From this publication on, the series KH7H which represents Non-profit institutions serving households’ final consumption expenditure quarter on previous quarter growth rate, will be KHZ9 within the UKEA to match the one used within the Quarterly National Accounts statistical bulletin.
Nôl i'r tabl cynnwys10. Quality and methodology
National Statistics status
On 20 March 2018, the UK Statistics Authority published a letter confirming the designation of quarterly sector accounts statistics as National Statistics. National Statistics means that official statistics meet the highest standards of trustworthiness, quality and value. The letter praised the richer analysis on the households sector and the improvements in communicating technical concepts to a less technical audience.
We are keen to continue this type of analysis and we welcome feedback and suggestions for additional content for the bulletin or supplementary pieces.
Reliability
Estimates for the most recent quarters are provisional and are subject to revision in the light of updated source information. Our revisions to economic statistics page contains articles on revisions and revisions policies.
Revisions to data provide one indication of the reliability of main indicators. Revisions triangles were published for the households and non-profit institutions serving households saving ratio. However, following the separation of the households and non-profit institutions serving households (NPISH) sectors in September 2017, we have ceased production of the revision triangles for the households and NPISH saving ratio.
In due course, we will reintroduce the revision triangle for the households-only saving ratio as and when meaningful analysis on revisions can be done.
Comparability
Data in this bulletin are internationally comparable. The UK National Accounts are compiled in accordance with the European System of Accounts 2010: ESA 2010, under EU law and in common with all other members of the European Statistical System. ESA 2010 is itself consistent with the standards set out in the United Nations System of National Accounts 2008: SNA 2008.
An explanation of the sectors and transactions described in this bulletin can be found in Chapter 2 of the ESA 2010 manual.
Methodology
This section summarises the methodology behind some of our main economic indicators: real household disposable income, households saving ratio and net lending or borrowing positions
Real household disposable income (RHDI) explained
Household income is measured in two ways: in current prices (also called nominal prices) and in real terms, where the effect of price inflation is removed.
Gross disposable household income (GDHI) is the estimate of the total amount of income that households have available to either spend, save or invest. It includes income received from wages (and the self-employed), social benefits, pensions and net property income (that is, earnings from interest on savings and dividends from shares) less taxes on income and wealth. These are all given in current prices.
Therefore, GDHI tells us how much income households had to spend, save or invest in the time period being measured once taxes on income and wealth had been paid.
Adjusting GDHI to remove the effects of inflation gives another measure of disposable income called real household disposable income (RHDI). This is a measure of the real purchasing power of households’ income, in terms of the physical quantity of goods and services they would be able to purchase if prices remained constant over time. Further information on this calculation can be found in our Quality and Methodology Information.
The households’ saving ratio explained
The saving ratio estimates the amount of money households have available to save (gross saving) as a percentage of their gross disposable income plus pension accumulations (total available resources).
Gross saving is the difference between households’ total available resources (that is, GDHI plus pension accumulations) and household expenditure on goods and services for consumption.
The saving ratio can be volatile and is sensitive to even relatively small movements in its components, particularly on a quarterly basis. This is because gross saving is a relatively small difference between two large numbers. It is therefore often revised at successive publications when there are revisions to data.
The saving ratio may be considered an indicator of households’ economic confidence as well as an indicator of households’ financial conditions.
A higher saving ratio may be the result of an increase in income, a decrease in expenditure, or some combination of the two. A rise in the saving ratio may be an indication that households are acting more cautiously by spending less. Conversely, a fall in the saving ratio may be an indication that households are more confident and spending more. Other factors such as interest rates and inflation should also be considered when interpreting the households saving ratio.
Net lending (+) or borrowing (-) positions explained
The net lending or borrowing of a sector represents the net resources that the sector makes available to the rest of the economy. It does not necessarily refer to actual lending or borrowing in the normal sense, rather, it means that either a sector has money left over after its spending and investment in a given period (net lending), or it has spent and invested more than it received and has a need for financing (net borrowing), which may be covered by borrowing, issuing shares or bonds, or by drawing on reserves.
The net lending or borrowing position is determined by gross saving (that is, the balance between gross disposable income and final consumption expenditure) and is reduced or increased by the balance of capital transfers and the change in non-financial assets. This final position is called the net lending (if positive) or borrowing (if negative) position.
In summary, if actual investment is lower than the amount available for investment, the balance will be positive and represents net lending. Alternatively, if actual investment is higher than the amount available for investment, net borrowing is represented.
Note that, theoretically, the sum of net lending or borrowing positions of UK sectors must be offset by that of the rest of the world. However, this is only currently true up to 2016 data. From 2017 onwards, unbalanced supply use tables (SUT) in the compilation of gross domestic product (GDP) are unbalanced and it can take approximately 18 months after the end of the latest balanced year (currently 2016) for balanced SUTs to become available.
Quality and Methodology Information report
The Quarterly sector accounts Quality and Methodology Information report contains important information on:
- the strengths and limitations of the data and how it compares with related data
- uses and users of the data
- how the output was created
- the quality of the output including the accuracy of the data
The Quarterly sector accounts and the UK Economic Accounts are published at quarterly, pre-announced intervals alongside the Quarterly national accounts and Quarterly balance of payments statistical bulletins.
Nôl i'r tabl cynnwys11. Appendix A: key economic indicators
Figure 15: Households' debt to income ratio remains broadly has remained broadly flat at around 133% since the beginning of 2017
Components of households' debt to income ratio, percentage (RHS), £billions (LHS), non-seasonally adjusted, Quarter 1 (Jan to Mar) 1997 to Quarter 4 (Oct to Dec) 2018
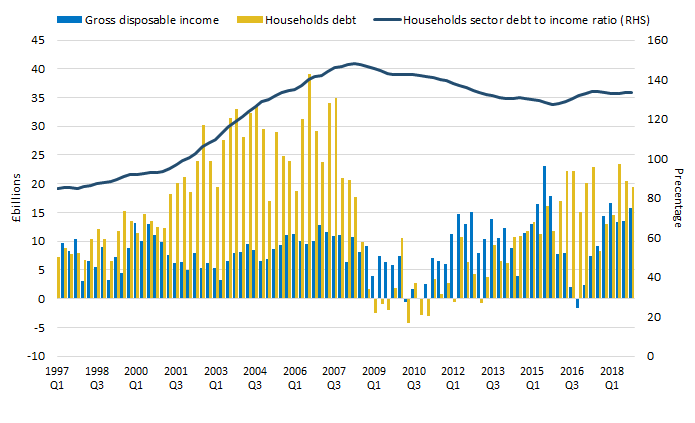
Source: Office for National Statistics
Download this image Figure 15: Households' debt to income ratio remains broadly has remained broadly flat at around 133% since the beginning of 2017
.png (15.2 kB) .xls (54.8 kB)
12. Appendix B: additional information on the alternative measures of households’ income and savings
Table 2: Quarterly change in the value of transactions removed from the national accounts methodology to calculate cash basis gross disposable household income and the saving ratio
| Quarter 4 (Oct-Dec) 2018 | ||
| Quarter 4 (Oct-Dec) 2018 | ||
| Transactions | CDID | Quarterly change, £ million |
| Transaction removed from the National Accounts measure of Gross disposable income | ||
| Gross operating surplus (B.2g) | CAEO | 454 |
| Employers' social contributions* (D.12r) | DTWP | -384 |
| Financial Intermediation Services Indirectly Measured (FISIM) (P.119r) | CRNC | 382 |
| Investment income payable on pension entitlements* (D.442r) | KZL5 | 832 |
| Retained earnings attributable to collective investment fund shareholders (D.4432r) | MN7M | 0 |
| Financial Intermediation Services Indirectly Measured (FISIM) (P.119u) | CRNB | -575 |
| Employers' imputed social contributions (D.612r) | L8RQ | 1 |
| Non-life insurance claims (D.72r) | RNLU | 36 |
| Employers' actual social contributions* (D.611u) | L8NM | -418 |
| Employers' imputed social contributions* (D.612u) | MA4B | 33 |
| Households' social contribution supplements* (D.614u) | L8QA | 832 |
| Further transaction removed from the National Accounts measure of Households saving ratio | ||
| Adjustment for the change in pension entitlements (D.8r) | RNMB | -896 |
| Imputed rental for housing (removed from cash basis final consumption expenditure) | GBFJ | 453 |
| Financial Intermediation Services Indirectly Measured (FISIM) (removed from cash basis final consumption expenditure) | C68W | 212 |
| Source: Office for National Statistics | ||
Download this table Table 2: Quarterly change in the value of transactions removed from the national accounts methodology to calculate cash basis gross disposable household income and the saving ratio
.xls (42.5 kB)13. Acknowledgements
The author, David Matthewson, would like to express his thanks to Freddy Farias Arias at Office for National Statistics for his contributions to this work.
Nôl i'r tabl cynnwysManylion cyswllt ar gyfer y Bwletin ystadegol
Related publications
- Balance of payments, UK: October to December 2018
- Business investment in the UK: analysis by asset
- Business investment in the UK: October to December 2018 revised results
- GDP quarterly national accounts, UK: October to December 2018
- Quarterly economic commentary: October to December 2018
- Business investment in the UK: October to December 2018 revised results
- Consumer trends, UK: October to December 2018