Cynnwys
- Main points
- Things you need to know about this release
- What is real households and non-profit institutions serving households (NPISH) disposable income?
- Real households and non-profit institutions serving households (NPISH) disposable income fell in Quarter 3 2016
- What is the saving ratio?
- Continuing its recent trend, the households and NPISH saving ratio fell in Quarter 3 2016
- Net lending (+) and net borrowing (-) by sector
- Low bond yields lead to higher pension financial liabilities
- Upcoming changes to this bulletin
- Quality and methodology
1. Main points
The level of real households and non-profit institutions serving households (NPISH) disposable income (RHDI) fell by 0.6% in Quarter 3 (July to Sept) 2016, following an increase of 0.8% in the previous quarter. RHDI is now 8.0% higher than its pre-downturn peak in Quarter 4 (Oct to Dec) 2007.
For the year 2015, RHDI increased by 3.6% following an increase of 1.5% in 2014.
In Quarter 3 2016, the households and NPISH saving ratio was 5.6%, compared with 6.1% in Quarter 2 (Apr to June) 2016.
Households and NPISH net borrowing increased in Quarter 3 2016 to £4.9 billion from net borrowing of £2.1 billion in the previous quarter. Households and NPISH have been net borrowers in 7 of the 11 quarters between Quarter 1 (Jan to Mar) 2014 and Quarter 3 2016.
In Quarter 3 2016, the central government, local government, financial corporations and households and non-profit institutions serving households (NPISH) sectors were net borrowers. The private non-financial corporations, public corporations and rest of the world sectors were net lenders. Compared with the previous quarter, public corporations switched from net borrowers to net lenders. All other sectors remain unchanged.
Nôl i'r tabl cynnwys2. Things you need to know about this release
From January 2017 we are improving the way we publish economic statistics, with related data grouped together under new "theme" days. This will increase the coherence of our data releases and involve minor changes to the timing of certain publications. For more information see ‘Changes to publication schedule for economic statistics’.
This bulletin presents the main economic indicators and summary estimates from the institutional sectors of the UK economy: private non-financial corporations, public corporations, financial corporations, central and local government and households and non-profit institutions serving households (NPISH) that are presented in the UK Economic Accounts (UKEA) dataset.
The UKEA provides detailed estimates of national product, income and expenditure, UK sector non-financial and financial accounts and UK balance of payments. The UKEA related to this release can be found at the end of the PDF version of this article.
The data used in this bulletin have a broad range of users. They are widely used by government departments to inform and monitor the effect of policy decisions. The data also aid assessments of the economy: informing the Bank of England’s Monetary Policy Committee (MPC) when setting monetary policy and the Office for Budget Responsibility’s (OBR) forecasts and evaluations of economic growth and public sector finances. The data are also used by businesses and knowledge and research institutions such as think-tanks, lobby groups and universities, and by researchers, analysts, academics, students and trade organisations.
Revisions in this bulletin are made in line with the National Accounts Revisions Policy. The earliest period open for revision in this release is Quarter 1 (Jan to Mar) 2015. Many revisions have been made due to taking on local government final outturn data for England and Wales for the fiscal year ending 2016, annual international trade in services survey data for 2015, annual financial inquiries survey data for 2015, regulatory and administrative data for insurance corporations and pension funds for 2015 and the foreign direct investment survey for 2015. This release also incorporates the correction for the processing error identified in the measurement of UK trade announced on 6 December.
The tables in the UK economic accounts do not contain the most recent data for inventory holding gains for financial corporations and private non-financial corporations for 2015 onwards due to late processing of these data. This will be amended at the next opportunity, 31 March for 2016 data and 29 Sept 2017 for 2015 data.
All figures given in this bulletin are adjusted for seasonality, unless otherwise noted.
Nôl i'r tabl cynnwys3. What is real households and non-profit institutions serving households (NPISH) disposable income?
There are 2 measures of households and NPISH income, in real terms or in current prices (also called nominal prices).
Gross households and NPISH disposable income (GDI) is the estimate of the total amount of money from income that households and NPISH have available from wages received, revenue of the self-employed, social benefits and net income (such as interest on savings and dividends from shares) less taxes on income and wealth. All the components that make up GDI are estimated in current prices.
However, by adjusting GDI to remove the effects of inflation, we are able to estimate another useful measure of disposable income called real disposable income. This is a measure of real purchasing power of households and NPISH incomes, in terms of the physical quantity of goods and services they would be able to purchase. We use the households and NPISH final consumption deflator to remove the effects of price inflation.
Nôl i'r tabl cynnwys4. Real households and non-profit institutions serving households (NPISH) disposable income fell in Quarter 3 2016
In 2015, real households and non-profit institutions serving households (NPISH) disposable income increased by 3.6%, following an increase of 1.5% in 2014. This is the highest annual growth since 2001, when it was 4.7%.
The rise in 2015 is due to a 4.0% increase in nominal gross disposable income partially offset by a 0.3% increase in the households and NPISH final consumption deflator. This increase in nominal gross disposable income was predominantly due to rises in wages and salaries of £29.3 billion, gross operating surplus and mixed income of £11.0 billion and net social benefits other than transfers in kind of £10.7 billion. This was partially offset by a rise in taxes on income and wealth of £9.5 billion.
Real households and NPISH disposable income growth for 2015 has been revised up to 3.6% from 3.3%. This is due to an upward revision of nominal gross disposable income growth to 4.0% from 3.6%. The households and NPISH final consumption deflator was unrevised.
The level of real households and NPISH disposable income fell by 0.6% in Quarter 3 (July to Sept) 2016, following an increase of 0.8% in the previous quarter.
Figure 1: UK real households and non-profit institutions serving households (NPISH) disposable income, quarter on quarter
Quarter 4 (Oct to Dec) 2012 to Quarter 3 (July to Sept) 2016
Source: Office for National Statistics
Notes:
- Q1 refers to Quarter 1 (Jan to Mar), Q2 refers to Quarter 2 (Apr to June), Q3 refers to Quarter 3 (July to Sept) and Q4 refers to Quarter 4 (Oct to Dec).
Download this chart Figure 1: UK real households and non-profit institutions serving households (NPISH) disposable income, quarter on quarter
Image .csv .xlsThe fall in real households disposable income of 0.6% is due to a fall in nominal gross disposable income of 0.1% together with a rise in the households and NPISH final consumption deflator of 0.5%. The fall in nominal gross disposable income was driven by a rise in taxes on income and wealth of £1.4 billion and a fall in net social benefits other than transfers in kind of £1.0 billion. This was partially offset by increases in wages and salaries of £1.6 billion and gross operating surplus and mixed income of £0.7 billion.
Figure 2 shows the main contributions by transaction to the change in households and NPISH gross disposable income in each quarter. The grey bars show the total contributions to real households disposable income (RDHI) of the main transactions while the blue bars highlight the contribution of individual transactions in each quarter.
Figure 2: Impact of main components on households and non-profit insitutions serving households (NPISH) gross disposable income
Quarter 4 (Oct to Dec) 2012 to Quarter 3 (July to Sept) 2016

Source: Office for National Statistics
Notes:
- Q1 refers to Quarter 1 (Jan to Mar), Q2 refers to Quarter 2 (Apr to June), Q3 refers to Quarter 3 (July to Sept) and Q4 refers to Quarter 4 (Oct to Dec).
Download this image Figure 2: Impact of main components on households and non-profit insitutions serving households (NPISH) gross disposable income
.png (32.9 kB) .xls (28.7 kB)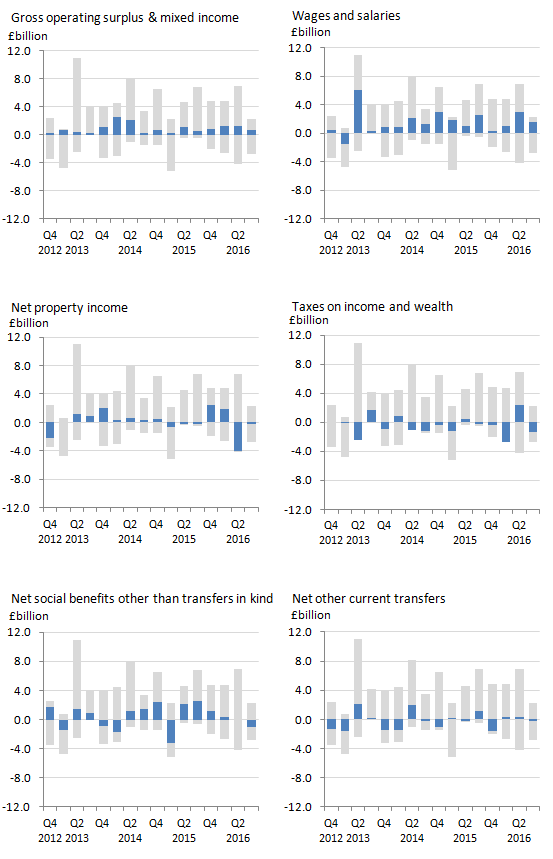
5. What is the saving ratio?
The saving ratio estimates the amount of money households and non-profit institutions serving households (NPISH) have available to save (known as gross saving) as a percentage of their total disposable income (known as total available resources).
Gross saving estimates the difference between households and NPISH total available resources (mainly wages received, revenue of the self-employed, social benefits and net income such as interest on savings and dividends from shares, but excluding taxes on income and wealth) and their current consumption (expenditure on goods and services).
All of the components that make up gross saving and total available resources, and in fact all sector accounts data apart from real households and NPISH disposable income (RHDI), are estimated in current prices (CP). These are sometimes known as nominal prices, meaning that they include the effects of price changes.
The saving ratio is published in the UK Economic Accounts (UKEA) as non-seasonally adjusted (NSA) and seasonally adjusted (SA) formats, with the latter removing seasonal effects to allow comparisons over time. The saving ratio can be volatile and is sensitive to even relatively small movements to its components, particularly on a quarterly basis. This is because gross saving is a small difference between 2 numbers. It is therefore often revised at successive publications when new or updated data are included.
The saving ratio is considered to be an indicator of households and NPISH confidence. A higher saving ratio may be the result of an increase in income, a decrease in expenditure, or some combination of them both. A rise in the saving ratio may be an indication that households are acting more cautiously by spending less.
Conversely, a fall in the saving ratio may be an indication that households are more confident and spending more. Other factors such as interest rates and inflation should also be considered when interpreting the households and NPISH saving ratio.
Nôl i'r tabl cynnwys6. Continuing its recent trend, the households and NPISH saving ratio fell in Quarter 3 2016
In 2015, the saving ratio was 6.5%, compared with 6.8% in 2014. The fall in the saving ratio in 2015 reflects rises in final consumption expenditure of £31.8 billion and taxes on income and wealth of £9.5 billion. This was partially offset by rises in wages and salaries of £29.3 billion, gross operating surplus and mixed income of £11.0 billion and net property income of £1.6 billion.
In Quarter 3 (July to Sept) 2016, the households and NPISH saving ratio fell to 5.6% from 6.1% in Quarter 2 (Apr to June) 2016.
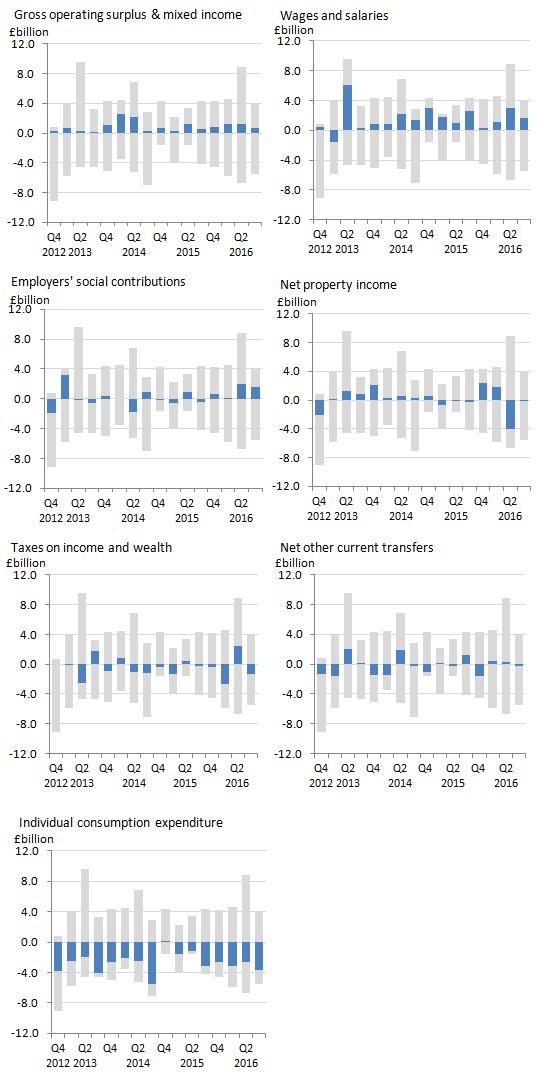
The fall for Quarter 3 2016 is due to rises for final consumption expenditure of £3.7 billion and taxes on income and wealth of £1.4 billion. This was partially offset by rises in wages and salaries of £1.6 billion and employers’ social contributions of £1.6 billion.
Figure 3 shows the main contributions by transaction to the change in households and NPISH gross saving in each quarter. The grey bars show the total contributions to the saving ratio of all transactions while the blue bars highlight the contribution of individual transactions in each quarter.
Figure 3: Impact of main components on the households and non-profit insitutions serving households (NPISH) saving ratio
Quarter 4 (Oct to Dec) 2012 to Quarter 3 (July to Sept) 2016
Source: Office for National Statistics
Notes:
- Q1 refers to Quarter 1 (Jan to Mar), Q2 refers to Quarter 2 (Apr to June), Q3 refers to Quarter 3 (July to Sept) and Q4 refers to Quarter 4 (Oct to Dec).
Download this image Figure 3: Impact of main components on the households and non-profit insitutions serving households (NPISH) saving ratio
.png (44.1 kB) .xls (28.7 kB)
The households and NPISH saving ratio has been revised upwards from 6.1% to 6.5% in 2015. This is mainly due to an upward revision in net property income of £5.2 billion and a downward revision in final consumption expenditure of £1.2 billion. These were partially offset by a downward revision in employers’ social contributions of £1.8 billion.
For Quarter 1 (Jan to Mar) 2016, the households and NPISH saving ratio has been revised upwards to 6.1% from 5.6%, due to upward revisions in net property income of £1.2 billion and gross operating surplus and mixed income of £0.6 billion, and partially offset by an upward revision in final consumption expenditure of £0.1 billion.
For Quarter 2 2016, the saving ratio was also revised upwards, to 6.1% from 5.1%. This revision was due mainly to an upward revision in net property income of £2.3 billion and to downward revisions in final consumption expenditure of £0.9 billion and taxes on income and wealth of £0.4 billion.
Figure 4: UK households and non-profit institutions serving households (NPISH) quarterly saving ratio, latest data and previously published data
Quarter 4 (Oct to Dec) 2012 to Quarter 3 (July to Sept) 2016
Source: Office for National Statistics
Notes:
- Q1 refers to Quarter 1 (Jan to Mar), Q2 refers to Quarter 2 (Apr to June), Q3 refers to Quarter 3 (July to Sept) and Q4 refers to Quarter 4 (Oct to Dec).
Download this chart Figure 4: UK households and non-profit institutions serving households (NPISH) quarterly saving ratio, latest data and previously published data
Image .csv .xlsThere was a broadly downward trend in the saving ratio from 1997 to 2008. Because the saving ratio is the fraction of a relatively small difference between 2 large numbers, from quarter to quarter the saving ratio fluctuates.
Figure 5: UK households and non-profit institutions serving households (NPISH) quarterly saving ratio
Quarter 1 (Jan to Mar) 1997 to Quarter 3 (July to Sept) 2016
Source: Office for National Statistics
Notes:
- Q1 refers to Quarter 1 (Jan to Mar), Q2 refers to Quarter 2 (Apr to June), Q3 refers to Quarter 3 (July to Sept) and Q4 refers to Quarter 4 (Oct to Dec).
Download this chart Figure 5: UK households and non-profit institutions serving households (NPISH) quarterly saving ratio
Image .csv .xlsAfter falls in expenditure, partially offset by weak income growth, in 2008 and 2009, the saving ratio rose to 11.5% in Quarter 1 2010. Since then, the saving ratio fell from its post-downturn peak to a more stable downward trend, averaging 6.5% between Quarter 4 (Oct to Dec) 2012 and Quarter 3 2016. The falling trend is due to increases in consumption expenditure marginally outpacing growth in households total resources.
Nôl i'r tabl cynnwys7. Net lending (+) and net borrowing (-) by sector
In 2015, the central government, local government, financial corporations and households and non-profit institutions serving households (NPISH) sectors were net borrowers. The non-financial corporations and rest of world sectors were net lenders.
Local government and households and NPISH sectors switched from being net lenders to being net borrowers from 2014 to 2015.
In Quarter 3 (July to Sept) 2016, the central government, local government, financial corporations and households and non-profit institutions serving households (NPISH) sectors were net borrowers. Private non-financial corporations, public corporations and rest of the world were net lenders.
Compared with the previous quarter, public corporations switched from being net borrowers to net lenders.
Table 1: Annual net lending (+) and net borrowing (-) by sector, £ billion
| 2014 to 2015 | ||
| 2014 | 2015 | |
| Central government | -101.9 | -76.7 |
| Local government | 0.1 | -3.5 |
| Public corporations | 0.9 | 0.8 |
| Financial corporations | -17.9 | -27.1 |
| Private non-financial corporations | 33.0 | 32.7 |
| Households and NPISH | 0.3 | -2.8 |
| Rest of the world | 85.4 | 81.3 |
| Source: Office for National Statistics | ||
Download this table Table 1: Annual net lending (+) and net borrowing (-) by sector, £ billion
.xls (26.6 kB)
Table 2: Quarterly net lending (+) and net borrowing (-) by sector, £ billion
| Quarter 1 (Jan to Mar) 2016 to Quarter 3 (July to Sept) 2016 | |||
| Q1 2016 | Q2 2016 | Q3 2016 | |
| Central government | -13.5 | -14.8 | -17.8 |
| Local government | -2.8 | -1.4 | -1.7 |
| Public corporations | 0.6 | -0.1 | 0.0 |
| Financial corporations | -9.3 | -10.2 | -7.0 |
| Private non-financial corporations | 9.0 | 11.4 | 11.0 |
| Households and NPISH | -2.6 | -2.1 | -4.9 |
| Rest of the world | 23.1 | 22.4 | 25.7 |
| Source: Office for National Statistics | |||
Download this table Table 2: Quarterly net lending (+) and net borrowing (-) by sector, £ billion
.xls (27.1 kB)Central government
In 2015, central government net borrowing was £76.7 billion, following net borrowing of £101.9 billion in 2014. This decrease in net borrowing was mainly due to increases in taxes on income and wealth of £11.4 billion, taxes on production of £7.9 billion, social contributions received of £7.0 billion and net property income of £5.9 billion. This was partially offset by rises in social benefits other than transfers in kind of £4.8 billion, final consumption expenditure of £4.5 billion, subsidies of £1.7 billion and a fall in net capital transfers of £1.7 billion.
In Quarter 3 2016, central government net borrowing was £17.8 billion compared with net borrowing of £14.8 billion in Quarter 2 (Apr to June) 2016. This was due to decreases in net property income of £3.3 billion and other current transfers of £2.9 billion. This was partially offset by increases in net capital transfers of £1.7 billion and increase in taxes on income and wealth of £1.3 billion.
Local government
In 2015, local government net borrowing was £3.5 billion, a switch from net lending of £0.1 billion in 2014. The switch to net borrowing was mainly caused by falls in net other current transfers of £3.3 billion and net capital transfers of £0.8 billion, and a rise in gross capital formation of £0.7 billion. This was partially offset by rises in other current taxes of £0.9 billion.
In Quarter 3 2016, local government net borrowing was £1.7 billion, an increase compared with net borrowing of £1.4 billion in Quarter 2 2016. The increase is due to falls in net capital transfers of £2.0 billion and net property income of £0.3 billion, and a rise in subsidies of £0.2 billion. This was partially offset by a rise in net other current transfers of £2.0 billion.
Public corporations
In 2015, public corporations net lending was £0.8 billion, following net lending of £0.9 billion in 2014. This was caused by a rise in gross capital formation of £0.6 billion and a fall in net property income of £0.2 billion, and partially offset by rises in net capital transfers of £0.5 billion and gross operating surplus of £0.1 billion.
In Quarter 3 2016, public corporations net lending was £28 million, a switch from net borrowing of £53 million in Quarter 2 2016. This is due to an increase in net property income of £243 million, a decrease in gross capital formation of £127 million and an increase in net capital transfers of £126 million. These were partially offset by an increase in acquisitions less disposals of non-produced non-financial assets of £251 million, and a decrease in gross operating surplus of £164 million.
Financial corporations
In 2015, financial corporations net borrowing was £27.1 billion, an increase from net borrowing of £17.9 billion in 2014. This was driven by a fall in net property income of £6.7 billion and rises in taxes on income and wealth of £1.9 billion and gross capital formation of £1.0 billion.
In Quarter 3 2016, financial corporations net borrowing decreased to £7.0 billion from £10.2 billion in the previous quarter. This was driven by an increase in net property income of £3.6 billion and an increase in gross operating surplus of £0.8 billion. It was partially offset by a rise in gross capital formation of £1.5 billion.
Private non-financial corporations (PNFCs)
In 2015, the private non-financial corporations sector net lending was £32.7 billion, down 0.3 billion from 2014. This was driven by a fall in net property income of £2.2 billion and rises in gross capital formation of £1.5 billion and taxes on income of £1.3 billion, which were mostly offset by a rise in gross operating surplus of £4.7 billion.
For Quarter 3 2016, private non-financial corporations decreased net lending to £11.0 billion from £11.4 billion in Quarter 2 2016. This was due to a rise in gross capital formation of £3.2 billion and a fall in gross operating surplus of £0.8 billion, which was partially offset by a rise in net property income of £3.6 billion.
Households and NPISH
In 2015, the households and NPISH sector was a net borrower, of £2.8 billion, from a position of net lending of £0.3 billion in 2014. This was mainly driven by an increase in final consumption expenditure of £31.8 billion and rises in taxes on income of wealth of £9.5 billion. This was partially offset by rises in compensation of employees of £29.2 billion, gross operating surplus and mixed income of £11.0 billion, net social benefits other than transfers in kind of £10.7 billion and net social contributions of £5.4 billion.
For Quarter 3 2016, households and NPISH net borrowing increased to £4.9 billion, from net borrowing of £2.1 billion in Quarter 2 2016. This was mainly driven by increases in final consumption expenditure of £3.7 billion, gross capital formation of £1.5 billion, a decrease in net social contributions of £1.5 billion and an increase in taxes on income and wealth of £1.4 billion. The increase in net borrowing was partially offset by increases in compensation of employees of £3.2 billion.
Rest of the world
In 2015, the rest of world net lending to the UK was £81.3 billion, down on net lending of £85.4 billion in 2014. The fall in net lending was mainly due to a fall in the external balance of goods and services of £6.4 billion, which was partially offset by increases in net property income of £1.9 billion and net capital transfers of £0.8 billion.
For Quarter 3 2016, rest of world net lending to the UK increased to £25.7 billion from £22.4 billion in Quarter 2 2016. This was mainly driven by an increase in the external balance of goods and services of £6.2 billion. This was partially offset by a decrease in net property income of £3.7 billion.
Further details of the UK balance of payments position can be found in the Balance of Payments bulletin.
Nôl i'r tabl cynnwys8. Low bond yields lead to higher pension financial liabilities
Debt securities (for example, bonds) are financial assets which usually pay out interest to the holder at regular intervals during the life of the bond. At the end of the life of the bond, it matures, and the holder of the bond receives a sum of money, called the face value or par value of the bond. Bonds can be traded and the market price of the bond is generally different to the par value.
The market yield of a debt security is the current rate of return on a bond; that is, the amount of money earned on the bond divided by its current market price. It is similar to an interest rate on savings. Debt securities are mainly issued by corporations and governments (UK government debt securities are also called gilts).
The market price and yield of bonds are linked: higher market prices mean lower yields. Historic lows in yields were reached in Quarter 3 (July to Sept) 2016, reflecting the fact that market prices reached historic highs. More information on the causes of low yields and low interest rates is available in the Bank of England Inflation Report.
Figure 6 shows ownership of the stock of debt securities that have been issued by the UK government, by sector (the total of all debt securities issued by central and local government, of all maturities). Outstanding UK government debt securities reached £2.1 trillion in value at the end of Quarter 3 2016, an increase of £311 billion from Quarter 4 (Oct to Dec) 2015. Between Quarter 4 2015 and Quarter 3 2016, net issuance of UK government debt securities was £36.6 billion. The remaining increase reflects changes in the value of the existing stock of government bonds due to increases in the market price.
71% of this total is owned domestically, primarily by the monetary financial institutions sector, which includes deposit-taking financial corporations and the Bank of England, and the insurance corporations and pension funds sector.
Figure 6: Financial assets, debt securities issued by UK government
Quarter 4 (Oct to Dec) 2015 to Quarter 3 (July to Sept) 2016
Source: Office for National Statistics
Notes:
- Q1 refers to Quarter 1 (Jan to Mar), Q2 refers to Quarter 2 (Apr to June), Q3 refers to Quarter 3 (July to Sept) and Q4 refers to Quarter 4 (Oct to Dec).
Download this chart Figure 6: Financial assets, debt securities issued by UK government
Image .csv .xlsFigure 7 shows the ownership distribution for UK corporate bonds. The increase in value of the stock between Quarter 4 2015 and Quarter 3 2016 was £298 billion, almost all of which accrued to rest of the world owners. This is in contrast with UK government bonds, where sector ownership shares were roughly constant between Quarter 4 2015 and Quarter 3 2016.
Figure 7: Financial assets, debt securities issued by UK corporations
Quarter 4 (Oct to Dec) 2015 to Quarter 3 (July to Sept) 2016
Source: Office for National Statistics
Notes:
- Q1 refers to Quarter 1 (Jan to Mar), Q2 refers to Quarter 2 (Apr to June), Q3 refers to Quarter 3 (July to Sept) and Q4 refers to Quarter 4 (Oct to Dec).
Download this chart Figure 7: Financial assets, debt securities issued by UK corporations
Image .csv .xlsFigure 8 shows remaining debt securities issued by the rest of the world and held by UK sectors. UK-owned foreign debt securities increased in value by £118 billion between Quarter 4 2015 and Quarter 3 2016, a smaller increase than for bonds issued by UK sectors.
Over this period, strong rest of the world demand for UK corporate bonds was 1 factor driving the increase in market prices.
Figure 8: Financial assets, debt securities issued by rest of world
Quarter 4 (Oct to Dec) 2015 to Quarter 3 (July to Sept) 2016
Source: Office for National Statistics
Notes:
- Q1 refers to Quarter 1 (Jan to Mar), Q2 refers to Quarter 2 (Apr to June), Q3 refers to Quarter 3 (July to Sept) and Q4 refers to Quarter 4 (Oct to Dec).
Download this chart Figure 8: Financial assets, debt securities issued by rest of world
Image .csv .xlsHigh UK bond prices and low UK bond yields impact the rest of the economy. Under low yields, the costs to corporations of issuing debt are lower, which can lower the cost of investment. However, corporations and households that are investing in debt securities benefit from lower debt security prices (higher yields).
One example is pensions. A pension fund pays out fixed sums of money over time. If debt security prices are high (yields lower), then pension funds must buy more debt securities to earn enough to pay out to the pension holder.
The financial liability of a pension is the cost of buying enough debt securities to cover the expected future payouts of the pension.
Figure 9: UK households and non-profit institutions serving households (NPISH) pension schemes
Quarter 1 (Oct to Dec) 2012 to Quarter 3 (July to Sept) 2016
Source: Office for National Statistics
Notes:
- Q1 refers to Quarter 1 (Jan to Mar), Q2 refers to Quarter 2 (Apr to June), Q3 refers to Quarter 3 (July to Sept) and Q4 refers to Quarter 4 (Oct to Dec).
Download this chart Figure 9: UK households and non-profit institutions serving households (NPISH) pension schemes
Image .csv .xlsFigure 9 shows the financial value of pension schemes owned by households and NPISH, which is exactly equal to the financial value of pensions obligations owed to households and NPISH by employers and pension schemes.
The total financial value of pension schemes owed to the households and NPISH sector increased from £3.0 trillion in Quarter 4 2015 to £3.5 trillion in Quarter 3 2016.
Nôl i'r tabl cynnwys9. Upcoming changes to this bulletin
This bulletin is part of a developmental programme to improve coverage of the sector and financial accounts and we would welcome your feedback. If you would like to get in touch please contact us via email: sector.accounts@ons.gsi.gov.uk
From March 2017 the sector accounts content contained within the Quarterly National Accounts Statistical Bulletin will move to its new home within the Quarterly Sector Accounts Statistical Bulletin.
Nôl i'r tabl cynnwys10. Quality and methodology
The UK Economic Accounts (UKEA) provides detailed estimates of national product, income and expenditure, UK sector non-financial and financial accounts and UK balance of payments. The Quarterly Sector Accounts and the UKEA are published at quarterly, pre-announced intervals alongside the Quarterly National Accounts and Quarterly Balance of Payments statistical bulletins. These accounts are the underlying data that produce a single estimate of gross domestic product (GDP) using income, production and expenditure data.
The accounts are fully integrated, but with a statistical discrepancy, known as the statistical adjustment, shown for each sector account. This reflects the difference between the sector net borrowing or net lending from the non-financial account and the identified net borrowing or net lending in the financial accounts, which should theoretically be equal but differ due to different data sources and measurement practices.
An explanation of the sectors and transactions described in this article can be found in chapter 2 of the European System of Accounts 2010 (ESA10) manual.
National Statistics are produced to high professional standards set out in the UK Statistics Authority's Code of Practice for Official Statistics. They undergo regular quality assurance reviews to ensure that they meet customer needs. They are produced free from any political interference.
Nôl i'r tabl cynnwys