Cynnwys
- Main points
- Understanding Profitability
- Your views matter
- Net rate of return of private non-financial corporations
- Economic context
- Manufacturing and service companies, quarter 2 2015
- United Kingdom non-continental shelf (UK non-CS) companies, quarter 2 2015
- United Kingdom continental shelf (UKCS) companies, quarter 2 2015
- International comparisons
- Background notes
- Methodoleg
1. Main points
In this release, rates of return have been revised back to Quarter 1 1997, due to revisions to both Gross Operating Surplus and Capital Employed data. These revisions incorporate Blue Book 2015 changes
The profitability of private non-financial corporations (PNFCs), as measured by their net rate of return, was estimated at 12.8 % in Quarter 2 2015, 0.2 percentage points higher than the revised estimate of 12.6% in Quarter 1 2015
Manufacturing companies’ net rate of return was estimated at 6.7% in Quarter 2 2015, 0.9 percentage points lower than the revised estimate of 7.6% in Quarter 1 2015. This remains the lowest estimated rate of return since Quarter 1 2013 when it was 6.3% (revised)
Service companies’ net rate of return was estimated at 21.3% in Quarter 2 2015. This is the highest recorded quarterly estimate since the series began in 1997 and is 0.5 percentage points higher than the previous quarter
UK Continental Shelf (UKCS) companies’ net rate of return was 14.7% in Quarter 2 2015. The increase on the revised estimate of 5.0% in Quarter 1 2015 is consistent with movements in Brent crude oil prices
To see the above data in more context, data for earlier periods are shown in Tables 1 and 2, and are also presented in Figures 1 to 6
2. Understanding Profitability
Profitability, using the net rate of return calculation method, is a common way of measuring the economic success of a company or sector. The rate of return is calculated by expressing the economic gain, or profit, as a percentage of the capital used to produce it. See section 2 of the background notes for a more comprehensive definition.
Revisions to the net rates of return for PNFCs have been made back to Quarter 1 1997, and are consistent with ONS’ annual national accounts publication – Blue Book 2015, published on 30 October 2015 and the Capital Stocks, Consumption of Fixed Capital 2015 release published on 1 December 2015.
Nôl i'r tabl cynnwys3. Your views matter
We are constantly aiming to improve this release and its associated commentary. We would welcome any feedback you might have, and would be particularly interested in knowing how you make use of these data to inform your work. Please contact us via email: profitability@ons.gov.uk or telephone Eric Crane on +44 (0)1633 455092.
Nôl i'r tabl cynnwys4. Net rate of return of private non-financial corporations
The net rate of return of all private non-financial corporations in Quarter 2 2015 was estimated at 12.8%. This compares with the revised estimate of 12.6% for Quarter 1 2015.
Figure 1: Net rate of return of private non-financial corporations, Quarter 2 2007 to Quarter 2 2015
UK
Source: Office for National Statistics
Download this chart Figure 1: Net rate of return of private non-financial corporations, Quarter 2 2007 to Quarter 2 2015
Image .csv .xls
Table 1: Annual net rate of return
| UK, 1997 to 2014 | ||||
| % | ||||
| Total | Manufacturing | Services | UK Continental Shelf (UKCS) | |
| 1997 | 14.3 | 13.5 | 18.8 | 9.8 |
| 1998 | 13.2 | 11.1 | 18.4 | 7.1 |
| 1999 | 12.0 | 9.9 | 15.9 | 11.7 |
| 2000 | 11.8 | 9.3 | 14.4 | 26.5 |
| 2001 | 10.2 | 6.7 | 12.4 | 27.2 |
| 2002 | 11.1 | 7.8 | 13.3 | 27.0 |
| 2003 | 11.3 | 7.0 | 14.6 | 27.0 |
| 2004 | 11.7 | 8.6 | 14.2 | 28.5 |
| 2005 | 11.9 | 8.2 | 14.4 | 38.7 |
| 2006 | 11.9 | 7.6 | 13.8 | 46.4 |
| 2007 | 11.6 | 7.0 | 13.6 | 43.2 |
| 2008 | 11.3 | 7.0 | 13.5 | 45.4 |
| 2009 | 9.5 | 4.1 | 12.8 | 32.7 |
| 2010 | 10.5 | 4.7 | 13.7 | 44.1 |
| 2011 | 11.3 | 7.6 | 14.0 | 50.6 |
| 2012 | 11.1 | 6.5 | 15.0 | 36.7 |
| 2013 | 11.8 | 8.5 | 16.2 | 28.9 |
| 2014 | 12.8 | 11.6 | 18.5 | 15.6 |
| Source: Office for National Statistics | ||||
Download this table Table 1: Annual net rate of return
.xls (55.8 kB)Table 2: Quarterly net rate of return
| UK, Quarter 1 Jan to Mar 1997 to Quarter 2 Apr to June 2015 | ||||
| % | ||||
| Net rates of return of UK Private Non-financial Companies | ||||
| Total | Manufacturing | Services | UK Continental Shelf (UKCS) | |
| 1997 Q1 | 13.7 | 13.0 | 17.2 | 12.5 |
| 1997 Q2 | 14.3 | 13.4 | 19.3 | 8.3 |
| 1997 Q3 | 14.8 | 13.9 | 19.8 | 9.5 |
| 1997 Q4 | 14.4 | 13.6 | 19.1 | 9.3 |
| 1998 Q1 | 13.8 | 11.8 | 17.8 | 8.4 |
| 1998 Q2 | 13.6 | 13.2 | 18.5 | 7.8 |
| 1998 Q3 | 12.3 | 9.3 | 18.5 | 6.4 |
| 1998 Q4 | 13.1 | 10.2 | 18.8 | 5.8 |
| 1999 Q1 | 12.4 | 10.9 | 15.7 | 5.9 |
| 1999 Q2 | 11.6 | 11.3 | 15.3 | 8.8 |
| 1999 Q3 | 12.0 | 8.8 | 16.8 | 15.5 |
| 1999 Q4 | 11.9 | 8.8 | 15.8 | 16.9 |
| 2000 Q1 | 12.4 | 11.3 | 14.1 | 21.4 |
| 2000 Q2 | 12.0 | 10.8 | 14.6 | 25.3 |
| 2000 Q3 | 11.7 | 8.7 | 15.8 | 28.2 |
| 2000 Q4 | 11.0 | 6.4 | 13.0 | 31.5 |
| 2001 Q1 | 9.4 | 7.1 | 9.8 | 30.1 |
| 2001 Q2 | 10.6 | 7.7 | 12.8 | 30.3 |
| 2001 Q3 | 10.2 | 6.4 | 13.4 | 25.8 |
| 2001 Q4 | 10.4 | 5.7 | 13.5 | 22.4 |
| 2002 Q1 | 11.2 | 10.6 | 11.4 | 23.3 |
| 2002 Q2 | 11.1 | 8.2 | 12.4 | 26.7 |
| 2002 Q3 | 11.0 | 7.0 | 14.8 | 25.1 |
| 2002 Q4 | 10.9 | 5.4 | 14.8 | 33.1 |
| 2003 Q1 | 10.8 | 5.8 | 13.1 | 31.6 |
| 2003 Q2 | 10.9 | 7.0 | 14.2 | 21.0 |
| 2003 Q3 | 11.9 | 7.0 | 16.7 | 26.9 |
| 2003 Q4 | 11.8 | 8.1 | 14.4 | 28.6 |
| 2004 Q1 | 11.5 | 8.9 | 13.6 | 26.6 |
| 2004 Q2 | 12.1 | 9.3 | 14.9 | 26.2 |
| 2004 Q3 | 11.9 | 8.4 | 14.9 | 30.9 |
| 2004 Q4 | 11.2 | 7.7 | 13.5 | 30.3 |
| 2005 Q1 | 11.2 | 8.0 | 12.6 | 34.5 |
| 2005 Q2 | 11.9 | 9.0 | 13.3 | 37.2 |
| 2005 Q3 | 12.3 | 8.3 | 15.6 | 39.5 |
| 2005 Q4 | 12.3 | 7.3 | 15.9 | 43.3 |
| 2006 Q1 | 12.6 | 9.4 | 14.3 | 53.1 |
| 2006 Q2 | 11.9 | 7.8 | 13.5 | 50.3 |
| 2006 Q3 | 11.9 | 7.4 | 14.1 | 43.2 |
| 2006 Q4 | 11.3 | 6.0 | 13.3 | 38.8 |
| 2007 Q1 | 11.5 | 8.9 | 13.1 | 31.1 |
| 2007 Q2 | 11.5 | 6.5 | 13.6 | 34.3 |
| 2007 Q3 | 11.6 | 6.8 | 14.3 | 41.8 |
| 2007 Q4 | 11.7 | 5.8 | 13.5 | 65.5 |
| 2008 Q1 | 12.2 | 8.4 | 14.4 | 51.7 |
| 2008 Q2 | 11.7 | 9.0 | 11.7 | 63.2 |
| 2008 Q3 | 11.5 | 5.3 | 13.9 | 48.9 |
| 2008 Q4 | 10.0 | 5.2 | 14.0 | 17.6 |
| 2009 Q1 | 10.2 | 4.7 | 13.9 | 29.5 |
| 2009 Q2 | 8.5 | 3.4 | 12.0 | 21.6 |
| 2009 Q3 | 9.5 | 4.1 | 12.9 | 31.4 |
| 2009 Q4 | 9.7 | 4.2 | 12.4 | 48.7 |
| 2010 Q1 | 10.2 | 4.7 | 13.2 | 37.8 |
| 2010 Q2 | 9.9 | 4.7 | 12.8 | 39.4 |
| 2010 Q3 | 10.9 | 4.7 | 14.8 | 46.8 |
| 2010 Q4 | 11.2 | 4.6 | 13.9 | 52.2 |
| 2011 Q1 | 11.3 | 8.0 | 13.3 | 53.3 |
| 2011 Q2 | 11.0 | 8.3 | 13.0 | 53.1 |
| 2011 Q3 | 11.6 | 7.3 | 15.2 | 47.7 |
| 2011 Q4 | 11.4 | 6.9 | 14.3 | 48.5 |
| 2012 Q1 | 11.3 | 6.5 | 14.4 | 44.3 |
| 2012 Q2 | 10.4 | 5.4 | 14.5 | 36.9 |
| 2012 Q3 | 11.0 | 5.8 | 16.3 | 33.9 |
| 2012 Q4 | 11.6 | 8.2 | 14.9 | 32.2 |
| 2013 Q1 | 11.8 | 6.3 | 16.4 | 32.1 |
| 2013 Q2 | 11.5 | 7.7 | 16.1 | 29.3 |
| 2013 Q3 | 12.0 | 9.6 | 17.2 | 28.4 |
| 2013 Q4 | 11.9 | 10.5 | 15.3 | 26.0 |
| 2014 Q1 | 12.5 | 8.6 | 18.0 | 21.6 |
| 2014 Q2 | 12.8 | 14.3 | 17.1 | 19.0 |
| 2014 Q3 | 13.1 | 11.3 | 20.3 | 12.0 |
| 2014 Q4 | 12.8 | 12.3 | 18.5 | 10.3 |
| 2015 Q1 | 12.6 | 7.6 | 20.8 | 5.0 |
| 2015 Q2 | 12.8 | 6.7 | 21.3 | 14.7 |
| Source: Office for National Statistics | ||||
| Notes: | ||||
| 1. Q1 refers to Quarter 1 (Jan to Mar). | ||||
| 2. Q2 refers to Quarter 2 (Apr to June). | ||||
| 3. Q3 refers to Quarter 3 (July to Sept). | ||||
| 4. Q4 refers to Quarter 4 (Oct to Dec). | ||||
Download this table Table 2: Quarterly net rate of return
.xls (58.4 kB)5. Economic context
Between Quarter 1 and Quarter 2 2015 the net rate of return of UK companies grew slightly, from 12.6% to 12.8%. This coincided with an improvement in economic conditions; GDP grew by 0.7% in Quarter 2 2015, compared with 0.4% in Quarter 1 2015. Business investment grew by 1.6% in Quarter 2 2015, faster than the average growth in business investment since the downturn. Ernst and Young have reported that just 57 profit warnings were issued by UK quoted companies in Quarter 2 2015, a near 2-year low. Companies producing oil and gas issued no warnings in Quarter 2 2015, helped by a slight rise in oil prices and an internal cost decrease. The highest number of warnings (10) were issued by software and computer services companies.
While the aggregate net rate of return grew slightly on a quarterly basis, this masked some disparities between industries. The net rate of return for manufacturing industries declined from 7.6% in Quarter 1 2015 to 6.7% in Quarter 2 2015, its lowest level for two years. This was mainly driven by a decline in operating surplus. Output growth in the manufacturing industry also declined to -0.5% in Quarter 2 2015, from -0.1% in Quarter 1 2015.
In contrast, the net rate of return in the service industries increased from 20.8% in Quarter 1 2015 to 21.3% in Quarter 2 2015, which is the highest rate since comparable records began in 1997. The Confederation of British Industry (CBI) Service Sector Survey reported strong growth in the profitability of consumer services in the three months leading to May, with profitability for business services growing as well. The service industries are by far the largest part of the UK economy and in Quarter 2 2015 they supported overall GDP growth, growing by 0.6%.
The net rate of return for United Kingdom Continental Shelf (UKCS) companies grew strongly to 14.7% in Quarter 2 2015 from 5.0% in Quarter 1 2015. This coincided with a sharp increase in growth of the output of mining and quarrying industries (7.5% in Quarter 2 2015 compared with 0.5% in Quarter 1 2015) and extraction of crude petroleum and natural gas in particular (12.7% in Quarter 2 2015 when compared with 0.5% in Quarter 1 2015). The tax changes announced in the March 2015 Budget may have been contributing factors to the growth in oil and gas extraction. These included a new Investment Allowance, a reduction in the supplementary tax charge from 30% to 20% with effect from January 1 2015, and a reduction in the rate of Petroleum Revenue Tax paid on older oil and gas fields from 50% to 35%.
As discussed in the background notes, there have been revisions to the profitability data going back to Quarter 1 1997 in order to make the data consistent with Blue Book 2015. The release of Blue Book 2015 constitutes the ONS annual update of the National Accounts. These (methodological and data) changes are designed to ensure that official statistics reflect the changing nature of the UK and global economies, to enable fair and meaningful international comparisons and to permit analysis of current economic trends on the best available data. For this reason a historical analysis of profitability has been undertaken in the next section.
Figure 2: Net rate of return, percent Q1 1997 to Q2 2015
UK

Source: Office for National Statistics
Download this image Figure 2: Net rate of return, percent Q1 1997 to Q2 2015
.png (30.7 kB) .xls (57.3 kB)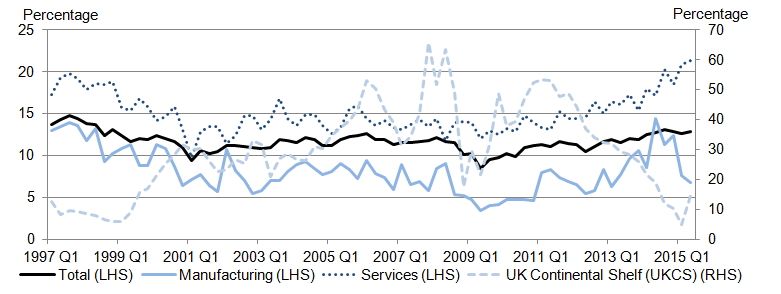
Between Quarter 1 1997 and Quarter 2 2015 the UK economy grew at an average rate of 0.5% per quarter. However, total business profitability (expressed as the net rate of return of total private non-financial corporations) followed an overall slight downward trend, comprised of 4 distinct periods:
between Quarter 1 1997 and Quarter 1 2001 companies’ profitability followed a generally downward trend, declining from 13.7% at the beginning of the period to 9.4% at the end of the period. This was driven by a decrease in the net operating surplus and an increase in the level of capital employed
between Quarter 1 2001 and the economy’s peak in Quarter 1 2008, business profitability followed a generally upward trend, increasing by 2.7 percentage points overall, mainly driven by a strong increase in net operating surplus
during the economy’s downturn (Quarter 1 2008 to Quarter 2 2009) the net rate of return of total private non-financial corporations followed a broadly downward trend, decreasing from 12.2% in Quarter 1 2008 to its lowest value of 8.5% in Quarter 2 2009
following the economic downturn business profitability followed a broadly upward trend, rising from 8.5% in Quarter 2 2009 to 12.8% in Quarter 2 2015. This was mainly due to a 74.4% increase in net operating surplus over this period
Figure 2 shows that over the whole period (1997 - 2015) manufacturing has been on average 6.9 percentage points less profitable than services and broadly followed the trends observed in total profitability. During the economic downturn (Quarter 1 2008 and Quarter 2 2009) the profitability of manufacturing industries contracted more sharply (5.0 percentage points) than both services (2.4 percentage points) and total profitability (3.7 percentage points). Moreover, between Quarter 2 2009 and Quarter 2 2014 manufacturing profitability recovered more strongly (growing on average by 0.5 percentage points per quarter) than total and services profitability (both growing on average by 0.2 percentage points per quarter). However, in the latest 4 quarters the profitability of manufacturing has followed a broadly downward trend while services has followed a broadly upward trend with total profitability being relatively flat over the period.
Figure 3: Comparison between Brent oil price in £, extraction of crude petroleum and profitability of UKCS
Index Q2 2004 = 100, UK
Source: Office for National Statistics
Download this chart Figure 3: Comparison between Brent oil price in £, extraction of crude petroleum and profitability of UKCS
Image .csv .xlsFigure 3 shows that the profitability of UK continental shelf (UKCS) companies is related to both the crude oil price and oil and gas output. The price of Brent oil in sterling experienced some volatility between Quarter 2 2004 and Quarter 2 2015 but it followed a generally upward trend while output consistently decreased over the same period due to North Sea oil becoming increasingly challenging to extract. As a result of the decreasing output the profitability of UKCS companies has followed a broadly downward trend between Quarter 2 2004 and Quarter 2 2015.
Nôl i'r tabl cynnwys6. Manufacturing and service companies, quarter 2 2015
Manufacturing Companies
The estimated net rate of return for manufacturing companies in Quarter 2 2015 was 6.7%. This was 0.9 percentage points lower than Quarter 1 2015.
As Figure 4 highlights, the estimates of net rate of return for the manufacturing sector can be volatile. Variation from one quarter to the next usually reflects the fortunes of a number of the larger companies and is not necessarily an indicator of improving or worsening economic performance across the sector as a whole.
Service companies
The estimated net rate of return for service companies in Quarter 2 2015 was 21.3%. This was the highest estimated rate since the series began, surpassing the prevous highest revised estimate of 20.8% for Quarter 1 2015.
Figure 4 shows the net rate of return for service companies since Quarter 2 2007. The underlying trend in recent years reflects the improving economic conditions.
Figure 4: Net rate of return of Manufacturing and Services Companies, Quarter 2 2007 to Quarter 2 2015
UK
Source: Office for National Statistics
Download this chart Figure 4: Net rate of return of Manufacturing and Services Companies, Quarter 2 2007 to Quarter 2 2015
Image .csv .xls7. United Kingdom non-continental shelf (UK non-CS) companies, quarter 2 2015
UK non-CS companies comprise manufacturing, service and other UK non-CS companies (such as construction and power supply).
The estimated net rate of return for UK non-CS companies in Quarter 2 2015 was 12.8%, which is 0.1 percentage points lower than the revised estimate of 12.9% for Quarter 1 2015.
As the net rate of return of UK non-CS companies makes up the majority of private non-financial corporations, Figure 5 shows a comparable picture to that of all private non-financial corporations (Figure 1).
Figure 5: Net rate of return of UK non-CS companies
UK
Source: Office for National Statistics
Download this chart Figure 5: Net rate of return of UK non-CS companies
Image .csv .xls8. United Kingdom continental shelf (UKCS) companies, quarter 2 2015
UKCS companies are defined as those involved in the exploration for, and extraction of, oil and natural gas in the UK. Due to the nature of the capital assets employed, net rates of return for continental shelf companies are not directly comparable with those for other industries.
The estimated net rate of return for UKCS companies in Quarter 2 2015 was 14.7%. This was up 9.7 percentage points from the revised estimate of 5.0% in Quarter 1 2015, the lowest quarterly figure since the series began in 1997. The increase is reflective of movements in Brent crude oil prices, which fell dramatically during Quarter 1 2015 to a low of £241 / tonne. Oil prices were higher during Quarter 2, briefly reaching £311 / tonne in May before falling again in June.
Figure 6: Net rate of return of UKCS companies, Quarter 2 2007 to Quarter 2 2015
UK
Source: Office for National Statistics
Download this chart Figure 6: Net rate of return of UKCS companies, Quarter 2 2007 to Quarter 2 2015
Image .csv .xls9. International comparisons
Profitability is a relative measure of profit and what created it. This bulletin shows the rate of return on capital employed. Unfortunately, other countries use a range of different measures, making international comparisons difficult.
Eurostat show comparisons, across the European Union, of the aggregated national profit share defined as Gross Operating Surplus (GOS) plus Mixed Income divided by Gross Value Added (GVA) on a European System of Accounts 2010 (ESA10) basis. GVA is the difference between the cost of inputs (whether capital or labour) and the cost of the output. The difference in the cost is due to the value added by the use of labour and capital. GOS is the income earned from capital. The Eurostat measure includes the activity of other profit-making sectors, such as financial corporations and public corporations, while the rest of this bulletin refers to the activities of private non-financial corporations only.
International data on an ESA10 basis are only available at the aggregate national level, shown for selected countries below (Figure 7).
Figure 7: International Comparisons, Quarter 2 Apr to June 2004 to Quarter 2 Apr to June 2014
UK
Source: Office for National Statistics, Eurostat
Download this chart Figure 7: International Comparisons, Quarter 2 Apr to June 2004 to Quarter 2 Apr to June 2014
Image .csv .xlsThe UK aggregated profit share in 2014 was 42.3%, up from 41.6% in 2013. In recent years, the profit share in the UK has moved above that in France (37.9%), but remains below the share in Germany (43.6%), Spain (47.5%) and Ireland (54.8%).
Nôl i'r tabl cynnwys