Cynnwys
- Main points
- Introduction
- Content
- Introduction to national accounts
- GDP revisions
- Current price GDP level revisions in Blue Book 2017
- Chained volume measure GDP level revisions at Blue Book 2017
- GDP growth rates
- Recent revisions
- Revisions between the first and second estimate
- Institutional sector accounts
- Saving ratio
- Current account
- Conclusions
- Annex A: BB2017 revisions, Current price, 1997 to 2015
- Annex B: Background to the national accounts gross domestic product (GDP) and the supply and use approach
- Annex C: Background to the compilation of gross domestic product (GDP)
- Annex D: Sources used in compiling estimates of Gross Domestic Product (GDP)
- Annex E: Gross Domestic Product (GDP) current price and chained volume measure annual growth by Blue Book
- Annex F: Major causes of revisions by Blue Book
1. Main points
The methodological changes introduced in Blue Book 2017 have had a modest impact on gross domestic product (GDP), with the shape and depth of the economic downturn of 2008 and 2009 largely unrevised.
Revisions to GDP between the preliminary estimate and the first quarterly national accounts publication continue to be small in size, while annual supply and use balancing and methodological improvements subsequently provide a larger source of revision.
Revisions performance during the 2008 to 2009 economic downturn and subsequent recovery has been broadly comparable with the more stable 1990s period.
Revisions to saving ratio and current account balance in Blue and Pink books 2017 have been larger than average revisions historically, reflecting methodological improvements to how dividend income and interest payments on corporate bonds are recorded.
2. Introduction
Revisions to gross domestic product (GDP) are inevitable in the lifetime of economic statistics. It is our role to produce the best possible estimate of GDP using all of the available information at that time. As more information becomes available over time, there is scope for the estimates of GDP to be revised. The only way to avoid subsequent revisions to GDP would be to either delay publication until all the relevant information has been received, which could be up to three years after the reference period, or to publish a first estimate and then ignore any subsequent new data and any methodological improvements. As such, GDP revisions are inevitable, but we are committed to explaining the reasons for these changes so that these are understood by users.
We achieve a balance between necessary revisions and revisions for minor changes through a published revisions policy, which reflects a National Statistics Quality Review: Review of National Accounts and Balance of Payments recommendation (page 11) by grouping annual benchmark revisions into a single GDP publication and limiting revisions in other quarters.
This is the latest in a series of revisions articles. The last revisions article was published in January 2017 and this article updates the analysis presented in that release, the impact of the revisions as a result of Blue Book 2017 consistent Quarterly National Accounts Quarter 3 (July to Sept) 2017 datasets.
Nôl i'r tabl cynnwys3. Content
This article will:
explain the reasons for revisions in the National Accounts
describe Blue Book 2017 gross domestic product (GDP) revisions in both chained volume measure (CVM) and current price (CP) terms
outline Blue Book 2017 and Pink Book 2017 revisions to the saving ratio and the current account
4. Introduction to national accounts
Previous revisions articles have described in detail the process used to compile the gross domestic product (GDP) estimates and these documents have been updated and included as annexes to this article. Annex B gives background information to the three approaches to measuring GDP and how they are reconciled in the supply and use framework. Annex C describes in detail the process of compiling GDP and how the methods evolve as more data become available. If you are not familiar with these methods you may find it useful to have the sequence of events in mind when reading this article as it helps to put the reasons for revisions into context.
Why is GDP revised?
The first estimate of quarterly GDP is published approximately 25 days after the end of the quarter, making it one of the fastest in the world. This is known as the preliminary estimate of GDP and is based entirely on the output approach to measuring GDP. This is then updated when the second estimate of GDP is published, containing more detail on the output approach and some aggregate income and expenditure data. This second estimate is published around 55 days after the reference quarter. Further detailed information on income and expenditure components is published as part of the quarterly national accounts (QNA), approximately 85 days after the end of the quarter.
As further data become available there are potential revisions to the quarterly GDP figures in subsequent QNA releases, as well as in the annual national accounts Blue Book publication. The Blue Book process enables annual data to be balanced at a much more detailed level and is also the opportunity for major methodological improvements to be introduced. Both of these annual revisions can potentially lead to changes in the quarterly profile of GDP. Data revisions usually occur only during the first and second Blue Books, which supply and use balance any given year, with subsequent Blue Book revisions being almost completely due to methodological improvements.
Nôl i'r tabl cynnwys5. GDP revisions
The published gross domestic product (GDP) revisions policy sets out the framework for revisions and this policy, combined with the timing of GDP releases, is designed to strike an appropriate balance between timeliness and accuracy. The Independent review of UK economic statistics made reference to this tension and suggested areas where alternative data sources in the future might increase the accuracy while not reducing the timeliness. We launched a consultation to address this issue. As a result we will be moving towards a new GDP model in July 2018. This model will give two estimates of quarterly GDP using data from all three of the output, income and expenditure approaches around 40 days after the reference quarter and 85 days after the end of the preceding quarter – that is, there will be no changes to the publication of the quarterly national accounts (QNA). This will be a change from three estimates of quarterly GDP, published 25, 55 and 85 days after the end of the preceding quarter.
In addition, the Index of Services publication will be moved two weeks earlier to become part of the short-term economic indicator theme day, enabling the publication of monthly GDP estimates that would include both a three-month rolling estimate and an estimate for the latest month.
GDP revisions can be categorised according to reason, although it is subsequently very difficult to quantify specifically the amount of revision due to any one reason in any given period as several reasons will almost certainly apply to each vintage of GDP.
Revisions to a source
This occurs when there are late returns to a statistical survey or we become aware of misreporting. These factors are particularly relevant to the preliminary estimate of GDP, which is largely based on our monthly surveys. Annex C provides a full list of all the sources used in the production of GDP, including the monthly surveys which ask for turnover data from over 42,000 businesses each month covering manufacturing, retailing, construction and a wide range of services sector businesses.
Replacing nowcasts with data
Annex B explains that the preliminary estimate of GDP is based on output, the source of which is largely our monthly surveys. However, for some industries it is more appropriate to use a nowcast (an estimate for the most recent period) at the preliminary estimate with the actual data source becoming available in time for either the second or third estimate of GDP. The short-term sources for expenditure and income components also become available in the same timescale.
Annual benchmarks
In the December Quarterly National Accounts round data from a number of annual surveys are incorporated for the previous complete year.
The supply and use table compilation process
Annually supply and use annual data are reviewed to make use of a further set of mainly annual data sources.
Revised seasonal adjustment factors
The impact of seasonal adjustment is reviewed during each production cycle, with additional information leading to a reassessment of the seasonal impact. This may change quarterly growths within a year.
Updating the output weights
At each Blue Book the gross value added (GVA) weights used to construct and aggregate the output approach are progressed by one year. In Blue Book 2017, the reference year and last base year have been moved two years from 2013 to 2015. This means that output GDP for 2015 and later is now based on the GVA pattern given by the supply and use balance of 2015 rather than 2013. The article Impact of methodological changes to chain-linking on gross domestic product informed of this change that pending the outcome of further analysis, we would investigate the feasibility of further moving the last base year on when the data for the most recent year are formed. Further methodological work will continue to develop an approach. The revisions due to this process tend to be small, but nevertheless this updating of GVA weights to better reflect the industrial mix in the economy is an important part of the Blue Book process.
New methods
The methods used to compile GDP are the subject of continuous improvement as new sources and/or methods become available or international best practice is developed.
New international standards
Economic statistics in the UK are compiled in line with international frameworks, standards and definitions, which themselves are updated to reflect changes to the economy that we are trying to measure. Up to and including Blue Book 2013, GDP was calculated in line with European System of Accounts (ESA) 95, which was introduced in Blue Book 1998. Following the publication of the updated System of National Accounts manual in 2008 (SNA 2008), the ESA was updated in 2010 as ESA 2010. This was implemented in the accounts in Blue Book 2014. Meeting new international standards, as was the case when ESA 2010 was introduced, will often lead to revisions. These tend to be upwards for reasons that will be explained later in this article.
Note
This categorisation excludes any corrections arising from errors in statistical processing. These are monitored separately as part of our correction process.
National Accounts revision policy
The timing of introducing new methodologies into estimates of GDP is inter-related with the National Accounts revisions policy. If a new concept or method is introduced this will typically lead to the data for a number of years being revised and may require the re-balancing of the supply and use tables (SUTs). This process happens during the annual update of the UK National Accounts or Blue Book. In the 2017 Blue Book, SUTs were reworked back to 1997 to incorporate new data sources and methods as well as incorporating further ESA 2010 changes. Major causes of Blue Book revisions over time are listed in Annex D.
Nôl i'r tabl cynnwys6. Current price GDP level revisions in Blue Book 2017
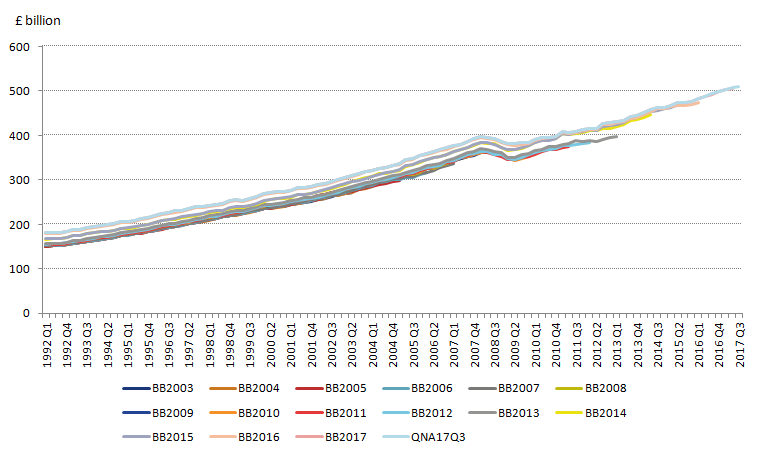
Revisions between Blue Book 2016 and Blue Book 2017 have had a modest impact on current price gross domestic product (GDP), increasing the annual level of GDP by less than 1% on average (Figure 1). The main changes on the level of current price GDP in Blue Book 2017 were as follows.
Actual rental and imputed rental
The new approach for private actual rentals brought consistency with the methods for imputed rentals introduced in Blue Book 2016. It also removed the discontinuity in the current price data at 2010, which was due to an interim solution in place since Blue Book 2014. As part of the process of bringing the sources and methods for private actual rentals into line with imputed rentals, we identified and implemented some further improvements to imputed rentals.
Improvements to the recording of GFCF
Following a quality review of software in gross fixed capital formation (GFCF), analysis showed that elements in the estimates of purchased software – a component of intellectual property products (IPP) – had been double-counted from 2001; this change removed the double-counted element. The IPP asset was also impacted as a result of updated data for entertainment, literary or artistic originals. The recording of transfer costs was also improved through the use of updated House Price Index (HPI) data and the inclusion of transfer costs (fees and taxes) associated with the buying and selling of players in the sports industries.
Blue Book 2017 improvements and revisions
Annex A provides a comprehensive overview of all the GDP-impacting improvements incorporated into Blue Book 2017:
impacts from separating estimates for the households and non-profit institutions serving households sector
unfunded public sector pensions methodology review
improvement to illegal activities
revised estimates of exhaustiveness and concealed income adjustment
revised estimates of Value Added Tax fraud
BBC data update
public sector finances alignment
Figure 1 shows that the Blue Book 2017 revisions are modest compared to some of those incorporated in previous years. For example, the most notable set of revisions in recent years was in Blue Book 2014, which was due to the completion of a number of ESA 95 reservations and the implementation of ESA 2010. Details of these revisions were published in the article Revisions to GDP and components in Blue Books 2014 and 2015, which included the capitalisation of expenditure on research and development.
Figure 1: Current price quarterly GDP, Quarter 1 (Jan to Mar) 1991 to Quarter 3 (July to Sept) 2017 (BB2003 to QNA 2017 Q3)
Source: Office for National Statistics
Download this image Figure 1: Current price quarterly GDP, Quarter 1 (Jan to Mar) 1991 to Quarter 3 (July to Sept) 2017 (BB2003 to QNA 2017 Q3)
.png (23.3 kB) .xls (56.3 kB)
7. Chained volume measure GDP level revisions at Blue Book 2017
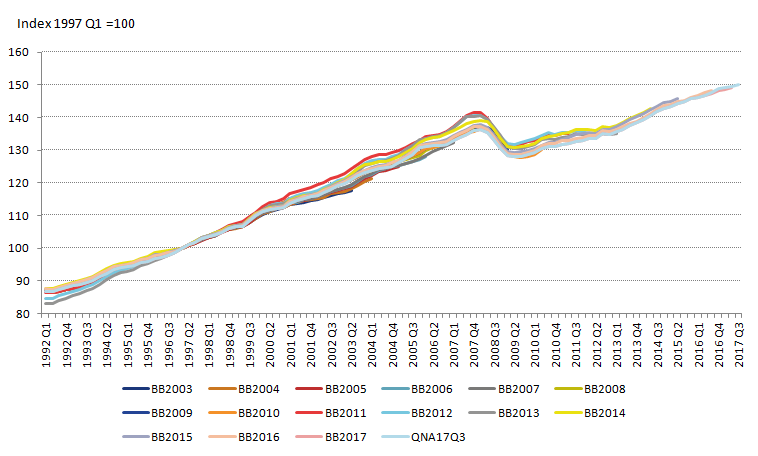
Current price revisions will, in most cases, feed through to affect real chained volume measure (CVM) gross domestic product (GDP), although there are a few exceptions. Figure 2 shows the impact of previous Blue Books on the volume profile of GDP and it can be seen that there have been instances where the annual revisions have led to a notable shift in the profile. However, like revisions to current price GDP, revisions to CVM GDP have been modest between Blue Book 2016 and Blue Book 2017.
Figure 2: Chained Volume Measure GDP, Quarter 1 (Jan to Mar) 1992 to Quarter 3 (July to Sept) 2017 (BB 2003 to QNA 2017 Q3)
Source: Office for National Statistics
Notes:
- The data in this figure is indexed to Quarter 1 (Jan to Mar) 1997 equal to 100 to avoid the level shifts which artificially occur when moving the reference year on as part of each Blue Book process.
Download this image Figure 2: Chained Volume Measure GDP, Quarter 1 (Jan to Mar) 1992 to Quarter 3 (July to Sept) 2017 (BB 2003 to QNA 2017 Q3)
.png (27.2 kB) .xls (57.3 kB)
Figure 3 looks more specifically at the impact of the Blue Book 2017 revisions and it can be seen that this has left the shape and depth of the economic downturn of 2008 to 2009 almost completely unrevised (now negative 6.1% peak to trough, rather than negative 6.3% at Blue Book 2016). Since 2013, GDP has grown steadily, with the economy exceeding pre-downturn peak levels in Quarter 2 (Apr to June) 2013 instead of Quarter 3 (July to Sept) 2013, a quarter earlier than in Blue Book 2016.
Figure 3: Chained Volume Measure GDP, Quarter 1 (Jan to Mar) 2008 to Quarter 3 (July to Sept) 2017 (BB 2016 vs QNA 2017 Q3)
UK
Source: Office for National Statistics
Download this chart Figure 3: Chained Volume Measure GDP, Quarter 1 (Jan to Mar) 2008 to Quarter 3 (July to Sept) 2017 (BB 2016 vs QNA 2017 Q3)
Image .csv .xls8. GDP growth rates
Revisions to the first quarterly estimates of gross domestic product (GDP) growth are usually due to more information becoming available, whereas the subsequent annual revisions are due to new data sources and improvements in methodology. It is possible to unpick these types of revisions by looking at how specific vintages compare with another. The data are included in the Real Time GDP database, which publishes successive estimates of chained volume measure (CVM) GDP in £ millions for each quarter since Quarter 1 (Jan to Mar) 1955. This database is just one part of an expanding set of regular analyses of growth rate revisions for the period since 1992, which are published after each GDP release. These databases allow transparency and give users the tools to analyse revisions. In 2013, we launched a current price GDP real time database with estimates in £ millions back to 1989 and in 2014, we released the first real time databases for the income and expenditure components of GDP. Output revision triangles are also now published for the Index of Construction, in addition to both the Index of Production and the Index of Services.
Figure 4 shows selected vintages of quarter-on-a-quarter-a-year-ago GDP growth, from initial publication (T) to the “final” position five years later (T + 60 months). These are broadly in line with the typical timing of data revisions as explained in Section 5. T + 60 was chosen as the “final” vintage as it equates to between three and four annual Blue Book revisions and will be sufficient for all data revisions to have been included, leaving only further definitional and methodological revisions to follow.
Figure 4: Chained Volume Measure GDP, percentage growth quarter on the same quarter a year ago
UK
Source: Office for National Statistics
Download this chart Figure 4: Chained Volume Measure GDP, percentage growth quarter on the same quarter a year ago
Image .csv .xlsFigure 4 gives a general impression of the scale of revisions. However, it is quite cluttered in assessing the size and variance of revisions and a clearer representation of how data and methodological improvements revise GDP in the period between the first estimate and five years later, is illustrated in Figure 5.
Figure 5: Chained Volume Measure GDP, percentage growth, quarter on same quarter a year ago, T and T + 60 months
UK
Source: Office for National Statistics
Download this chart Figure 5: Chained Volume Measure GDP, percentage growth, quarter on same quarter a year ago, T and T + 60 months
Image .csv .xlsFigure 5 confirms that for the most part revisions to GDP tend not to alter the overall economic history portrayed in the initial growth rate estimates. However, there is some suggestion that revisions are larger around turning points, for example, the mid-1970s, 1979 to 1980, 1988 to 1989 and 1998.
The same analysis can be produced from the real time GDP database for quarter-on-quarter growth rates in CVM GDP. Once again, if we limit the figure to only have the first estimate and the estimate after five years, the pattern of revisions to quarter-on-quarter growth can be seen more clearly (Figure 6). It appears that there is less volatility in the T + 60 month estimates than in the initial estimate made in period T and this will be in part due to the process of supply and use balancing annual data, where are a richer amount of information is available to inform the economic picture, and then producing successive quarterly paths through the time periods within these annual constraints.
Figure 6: Chained Volume Measure GDP, percentage growth, quarter on quarter at T and T + 60 months
UK
Source: Office for National Statistics
Download this chart Figure 6: Chained Volume Measure GDP, percentage growth, quarter on quarter at T and T + 60 months
Image .csv .xlsMany different approaches can be used to summarise revisions:
the mean revision for the estimate of GDP for a specific quarter, between any two vintages; this shows whether there a systematic tendency for final estimates to be revised upwards or downwards from the preliminary estimates and gives an indication of how reliable the preliminary estimate is
the mean absolute revision measures its absolute size so upward revisions are not offset by downward revisions of the same magnitude
the mean square revision incorporates the degree and the variance of the revision, as large revisions are not treated the same as small revisions
Figure 7 presents the mean revisions between the first published estimate and those published 24 months later over five sub-samples and the total from the real time GDP dataset. These are calculated as quarter-on-quarter growth rates for chained volume measure (CVM) GDP. The mean revisions have fluctuated over time, and in the period Quarter 1 1995 to Quarter 4 (Oct to Dec) 2004 they were lower than in earlier periods at 0.04 percentage points, which is statistically insignificant. This is likely to be reflecting a range of improvements to the measurement of GDP introduced following the Pickford Review of 1989; see A decade of improvements to economic statistics”, Jenkinson and Brand, 2000 for more details. This period also coincided with a more stable macroeconomic environment where it tends to be easier to record economic activity with more precision. Revisions due to data content, rather than methodology improvements are more likely to be smaller when the economy is behaving in a predictable manner. Overall revisions tend to be modest – approximately 0.05 percentage points from Quarter 1 1961 to Quarter 3 (July to Sept) 2015.
Figure 7: Mean revisions to CVM GDP, quarter on quarter growth between T and T + 24 months
UK
Source: Office for National Statistics
Download this chart Figure 7: Mean revisions to CVM GDP, quarter on quarter growth between T and T + 24 months
Image .csv .xlsFigure 8 shows the latest period has a slightly larger mean absolute revision than during the stable economic period of Quarter 1 1995 to Quarter 4 2004. This shows that there have been slightly more revisions in absolute terms in the latest period, reflecting the more challenging nature of estimating economic growth during the recent period than during the previous 10 years of steady growth. It also highlights how looking at only the mean revision can mask instances where revisions are offsetting each other and that a lower mean revision is not necessarily an indication of more reliable preliminary estimate of GDP. Nevertheless, the scale of revision still compares very favourably with the revisions performance during the earlier groups of years. Total absolute revisions are approximately 0.52 percentage points from Quarter 1 1961 to Quarter 3 2015.
Figure 8: Mean absolute revisions to CVM GDP, quarter on quarter growth between T and T + 24 months
UK
Source: Office for National Statistics
Download this chart Figure 8: Mean absolute revisions to CVM GDP, quarter on quarter growth between T and T + 24 months
Image .csv .xlsThe variance in the GDP estimates can be shown alongside the mean squared revisions to indicate how the revision compares with the volatility of GDP movement in that period. Figure 9 shows that while the variance of the T + 60 month data is larger in the period since Quarter 1 2005 than over the two previous periods, the mean squared revision has remained low. It also helps explain why data revisions have been larger in earlier periods.
Figure 9: Comparison of the T to T + 60 mean square revision (MSR) with the variance of the T + 60 maturity, quarter on quarter growth of CVM GDP
UK
Source: Office for National Statistics
Download this chart Figure 9: Comparison of the T to T + 60 mean square revision (MSR) with the variance of the T + 60 maturity, quarter on quarter growth of CVM GDP
Image .csv .xls9. Recent revisions
Figure 10 shows, for the period since Quarter 1 (Jan to Mar) 2007, the revision between the preliminary estimate for a quarter and the third estimate published around 85 days after the end of the quarter. Details of the revision are presented in Table 1.
Figure 10: Revisions to CVM GDP growth between the first and third estimate
UK, Quarter 1 (Jan to Mar) 2007 to Quarter 3 (July to Sept) 2017
Source: Office for National Statistics
Download this chart Figure 10: Revisions to CVM GDP growth between the first and third estimate
Image .csv .xlsIt can be seen that revisions over this time period are small. The average revision over the period is 0.00 percentage points to two decimal places. If there has been a revision, this has most commonly been 0.1 percentage points in either direction. There have only been 5 out of the 43 quarters in which quarterly GDP growth has been revised by more than plus or minus 0.1 percentage points.
Table 1: Revisions to GDP growth between the first (M1 = preliminary) and third estimate (M3 = Quarterly National Accounts)
| UK, Quarter 1 (Jan to Mar) 2007 to Quarter 3 (July to Sept) 2017 | ||||||||||||
|---|---|---|---|---|---|---|---|---|---|---|---|---|
| Per cent | ||||||||||||
| M1 | M3 | Revision | Absolute revision | Revision | Count | |||||||
| 2007 Q1 | 0.7 | 0.7 | 0.0 | 0.0 | -0.5 | 1 | ||||||
| 2007 Q2 | 0.8 | 0.8 | 0.0 | 0.0 | -0.4 | 0 | ||||||
| 2007 Q3 | 0.8 | 0.7 | -0.1 | 0.1 | -0.3 | 0 | ||||||
| 2007 Q4 | 0.6 | 0.6 | 0.0 | 0.0 | -0.2 | 1 | ||||||
| 2008 Q1 | 0.4 | 0.3 | -0.1 | 0.1 | -0.1 | 11 | ||||||
| 2008 Q2 | 0.2 | 0.0 | -0.2 | 0.2 | 0.0 | 15 | ||||||
| 2008 Q3 | -0.5 | -0.6 | -0.1 | 0.1 | 0.1 | 12 | ||||||
| 2008 Q4 | -1.5 | -1.6 | -0.1 | 0.1 | 0.2 | 1 | ||||||
| 2009 Q1 | -1.9 | -2.4 | -0.5 | 0.5 | 0.3 | 2 | ||||||
| 2009 Q2 | -0.8 | -0.7 | 0.1 | 0.1 | 0.4 | 0 | ||||||
| 2009 Q3 | -0.4 | -0.2 | 0.2 | 0.2 | 0.5 | 0 | ||||||
| 2009 Q4 | 0.1 | 0.4 | 0.3 | 0.3 | ||||||||
| 2010 Q1 | 0.2 | 0.3 | 0.1 | 0.1 | Total | 43 | ||||||
| 2010 Q2 | 1.1 | 1.2 | 0.1 | 0.1 | ||||||||
| 2010 Q3 | 0.8 | 0.7 | -0.1 | 0.1 | ||||||||
| 2010 Q4 | -0.5 | -0.5 | 0.0 | 0.0 | ||||||||
| 2011 Q1 | 0.5 | 0.5 | 0.0 | 0.0 | ||||||||
| 2011 Q2 | 0.2 | 0.1 | -0.1 | 0.1 | ||||||||
| 2011 Q3 | 0.5 | 0.6 | 0.1 | 0.1 | ||||||||
| 2011 Q4 | -0.2 | -0.3 | -0.1 | 0.1 | ||||||||
| 2012 Q1 | -0.2 | -0.3 | -0.1 | 0.1 | ||||||||
| 2012 Q2 | -0.7 | -0.4 | 0.3 | 0.3 | ||||||||
| 2012 Q3 | 1.0 | 0.9 | -0.1 | 0.1 | ||||||||
| 2012 Q4 | -0.3 | -0.3 | 0.0 | 0.0 | ||||||||
| 2013 Q1 | 0.3 | 0.3 | 0.0 | 0.0 | ||||||||
| 2013 Q2 | 0.6 | 0.7 | 0.1 | 0.1 | ||||||||
| 2013 Q3 | 0.8 | 0.8 | 0.0 | 0.0 | ||||||||
| 2013 Q4 | 0.7 | 0.7 | 0.0 | 0.0 | ||||||||
| 2014 Q1 | 0.8 | 0.8 | 0.0 | 0.0 | ||||||||
| 2014 Q2 | 0.8 | 0.9 | 0.1 | 0.1 | ||||||||
| 2014 Q3 | 0.7 | 0.7 | 0.0 | 0.0 | ||||||||
| 2014 Q4 | 0.5 | 0.6 | 0.1 | 0.1 | ||||||||
| 2015 Q1 | 0.3 | 0.4 | 0.1 | 0.1 | ||||||||
| 2015 Q2 | 0.7 | 0.7 | 0.0 | 0.0 | ||||||||
| 2015 Q3 | 0.5 | 0.4 | -0.1 | 0.1 | ||||||||
| 2015 Q4 | 0.5 | 0.6 | 0.1 | 0.1 | ||||||||
| 2016 Q1 | 0.4 | 0.4 | 0.0 | 0.0 | ||||||||
| 2016 Q2 | 0.6 | 0.7 | 0.1 | 0.1 | ||||||||
| 2016 Q3 | 0.5 | 0.6 | 0.1 | 0.1 | ||||||||
| 2016 Q4 | 0.6 | 0.7 | 0.1 | 0.1 | ||||||||
| 2017 Q1 | 0.3 | 0.2 | -0.1 | 0.1 | ||||||||
| 2017 Q2 | 0.3 | 0.3 | 0.0 | 0.0 | ||||||||
| 2017 Q3 | 0.4 | 0.4 | 0.0 | 0.0 | ||||||||
| Average revision | 0.00 | 0.09 | ||||||||||
| Source: Office for National Statistics | ||||||||||||
Download this table Table 1: Revisions to GDP growth between the first (M1 = preliminary) and third estimate (M3 = Quarterly National Accounts)
.xls (44.5 kB)The reference period used to monitor revisions performance will have an impact on the analysis produced. For instance, if we look only at the period from Quarter 1 (Jan to Mar) 2008 to Quarter 4 (Oct to Dec) 2010 (the latest downturn and recovery), the average absolute revision between M1 and M3 is 0.16 percentage points, rather than the 0.09 percentage points over the longer time span in Table 1. This is, at least in part, because it is generally recognised that it is harder to accurately estimate quarterly movements during the turning points in an economic cycle. For more information please see Improvements to early estimates of GDP through the 2008 to 2009 downturn section of the April 2017, Economic Review.
Nôl i'r tabl cynnwys10. Revisions between the first and second estimate
The latest Second estimate of GDP recorded a downward revision of gross domestic product (GDP) in Quarter 4 (Oct to Dec) 2017 from 0.5% to 0.4%. Typically, no other quarters are open to revision in the Second estimate of GDP, so this revision would normally only affect the latest quarter. However, the one exception is in February where all quarters in that calendar year are open to revision. In this round, there is a review of seasonal adjustment factors, a re-estimation of benchmarking, and the implementation of annual neutrality in the alignment adjustment.
Since February 2002, there have been four instances where there has been a revision to the preliminary estimate of Quarter 4, which then has the scope to impact upon the quarterly path within that calendar year. Figure 11 shows the impact on quarterly GDP growth in the affected calendar years. This shows there was a downward revision to 0.2% in Quarter 1 in 2017, while there was an upward revision to 0.5% in Quarter 3. Annual GDP growth in 2009 was unrevised from these changes, but it was revised down from minus 4.8% to minus 5.0% in 2010, from 2.0% to 1.8% in 2016 and from 1.8% to 1.7% in 2017.
Figure 11: Revisions to the quarterly path in the calendar year
UK
Source: Office for National Statistics
Download this chart Figure 11: Revisions to the quarterly path in the calendar year
Image .csv .xls11. Institutional sector accounts
Although the changes introduced in Blue Book 2017 had modest impact on current price and chained volume gross domestic product revisions, improvements led to larger revisions to the sector and financial accounts. There were two main changes of note.
There were upward revisions to how we record household dividend income, with an offsetting downward revision to retained corporate profits. This reflected an improvement in recording the income of the self-employed who have incorporated and receive income as dividends, and is more in line with the rise in the number of people working as owner-managers of incorporated firms. This led to an increase in household income, with no impact on household consumption, and an upward revision in the saving ratio.
There were upward revisions to how we calculate interest paid to the holders of UK corporate bonds. The increase in interest income earned by foreign owners of UK corporate bonds led to a revision in the current account deficit.
Nôl i'r tabl cynnwys12. Saving ratio
The household saving ratio estimates the amount of money households have available to save (known as gross saving) as a percentage of their disposable income. Gross saving is the difference between households’ total available resources (mainly wages received, revenue of the self-employed, social benefits and net income such as interest on savings and dividends from shares, but deducting taxes on income and wealth) and household consumption (expenditure on goods and services for consumption).
The saving ratio can be volatile and is sensitive to even relatively small movements in its components, particularly on a quarterly basis. This is because gross saving is a relatively small difference between two large numbers. It is therefore often revised at successive publications when there are revisions to data. The households saving ratio is seen as an indicator of household financial conditions. A low saving ratio may imply that households are taking on more debt and acquiring fewer financial assets, such as pensions. Instead household income is spent on consumption. A higher saving ratio may imply that households are acquiring more assets and taking on less debt.
Figure 12: Households' and Non-Profit Institutions Serving Households' (NPISH) saving ratio

Source: Office for National Statistics
Download this image Figure 12: Households' and Non-Profit Institutions Serving Households' (NPISH) saving ratio
.png (55.8 kB) .xls (42.5 kB)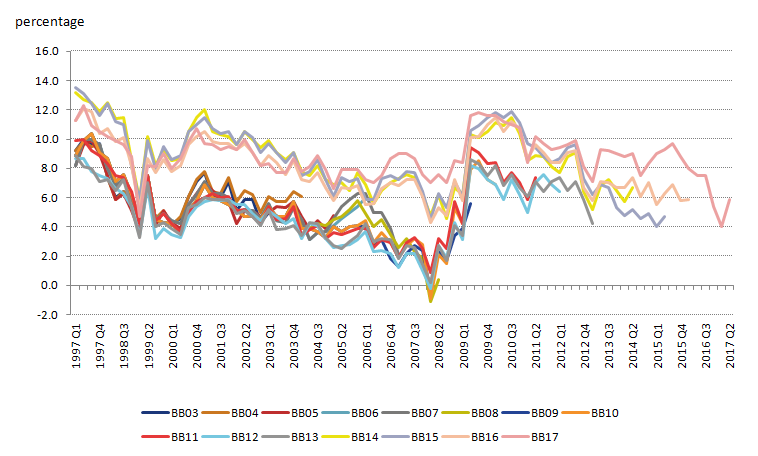
Figure 12 shows real-time vintages of the saving ratio. There was a large upward revision to the saving ratio in Blue Book 2017, with the saving ratio revised up from 6.1% in 2015 to 9.2%. This reflected the upward revisions to household dividend income, as new method improvements were introduced to better capture the income of the self-employed who have incorporated and receive income as dividends. The revisions to the saving ratio has been more noticeable in the latest years, coinciding with the recent increase in the number of self-employed people who have incorporated and receive dividend income. However, Figure 12 shows that the underlying trend is similar with the saving ratio trending downwards in recent years, having peaked following the recession.
Figure 13 presents the mean revisions to the savings ratio between the first published estimate and those published three years later over four sub-samples. The figure shows that the mean revisions have fluctuated over time, with revisions in all but one period being positive. Revisions in the latest period, from Quarter 1 2011 to Quarter 3 (July to Sept) 2017 were larger than in any other period reinforcing the idea that the increase in the number of people working as owner-managers of incorporated firms is a relatively new phenomenon.
Figure 13: Mean revisions to saving ratio between T and T + three years
UK, Quarter 2 (Arp to Jun) 1998 to Quarter 3 (July to Sept) 2014
Source: Office for National Statistics
Download this chart Figure 13: Mean revisions to saving ratio between T and T + three years
Image .csv .xlsFigure 14 shows the mean absolute revisions to the saving ratio. Looking at the absolute revisions, the average revisions during the more uncertain period of Quarter 1 2008 to Quarter 4 2010 were larger than the revisions in the latest period.
Figure 14: Mean absolute revisions to saving ratio between T and T + three years
UK, Quarter 2 (Arp to Jun) 1998 to Quarter 3 (July to Sept) 2014
Source: Office for National Statistics
Download this chart Figure 14: Mean absolute revisions to saving ratio between T and T + three years
Image .csv .xlsNote:
The Blue Book 2017 consistent National Accounts data published the households’ sector separately from the non-profit institutions serving households (NPISH) sector. Previously the two sectors were published combined. Because of a lack of revision triangles for households only sector, this analysis focuses on the previously combined household and NPISH estimates.
Nôl i'r tabl cynnwys13. Current account
The current account records the extent to which a country is net lender to or a net borrower from the rest of the world. It comprises of trade in goods and services, primary income and secondary income. The UK has historically run a current account deficit, relying on external financing to fund its expenditure.
The Pink Book 2017 introduced methodological improvements in how we calculate interest paid to the holders of UK corporate bonds. The improved methods increase the amount of interest paid on UK-issued corporate bonds. We also determined that bond redemptions particularly those issued by private non-financial corporations and other financial institutions, were being unrecorded. As some of these corporate bonds are held by foreign investors, this change increases the amount of investment income that is paid to the rest of the world, thereby increasing the current account deficit.
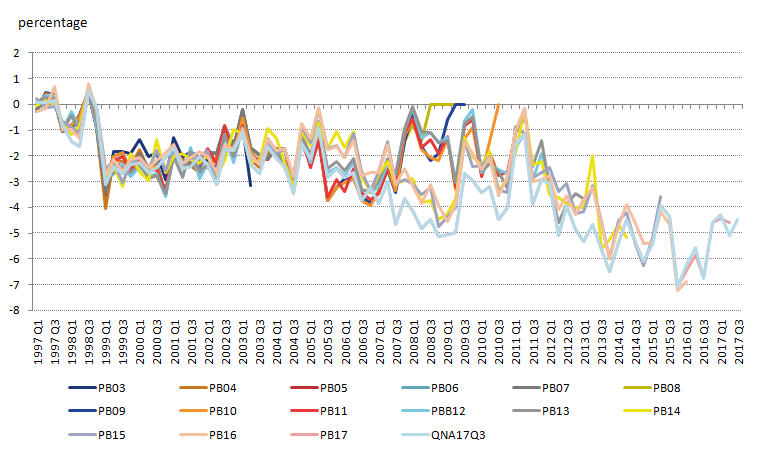
Figure 15 shows current account balance as a percentage of gross domestic product (GDP), and it can be seen that these improvements increased the size of the current account deficit, driven by a wider deficit on the UK’s net investment income.
Figure 15: Current account balance as a percentage of current price gross domestic product
Source: Office for National Statistics
Download this image Figure 15: Current account balance as a percentage of current price gross domestic product
.png (58.1 kB) .xls (47.6 kB)
Figure 16 presents mean revisions to the current account balance as a percentage of GDP between the first published estimate and those published three years later over four sub-samples. This shows that mean revisions have fluctuated over time, with revisions in the latest period being negative – that is, revisions from 2011 onwards tended to lead to a wider deficit or a narrower surplus.
Figure 16: Mean revisions to current account balance as a percentage of current price gross domestic product between first published estimate and three years later
UK, Quarter 1 (Jan to Mar) 1996 to Quarter 3 (July to Sept) 2014
Source: Office for National Statistics
Download this chart Figure 16: Mean revisions to current account balance as a percentage of current price gross domestic product between first published estimate and three years later
Image .csv .xlsFigure 17 shows that the average absolute revisions have been increasing over time. The large revisions in the latest period from Quarter 1 (Jan to Mar) 2011 to Quarter 3 (July to Sept) 2017 may reflect the large revisions introduced during Pink Book 2017 which are atypical. It is also worth noting that the current account deficit has widened to historical highs in recent years, driven by deterioration in net investment income.
Figure 17: Mean absolute revisions to current account balance as a percentage of current price gross domestic product between first published estimate and three years later
UK, Quarter 1 (Jan to Mar) 1996 to Quarter 3 (July to Sept) 2014
Source: Office for National Statistics
Download this chart Figure 17: Mean absolute revisions to current account balance as a percentage of current price gross domestic product between first published estimate and three years later
Image .csv .xls14. Conclusions
Revisions are a necessary part of the national accounts process to meet user requirements for timely estimates which reflect internationally agreed standards and definitions. Good revisions management requires regular updates on the reasons for revisions, including articles such as these and access to the underlying revisions databases to enable users of data to produce their own such analyses.
Revisions to gross domestic product (GDP) quarter-on-quarter growth between the preliminary estimate and the first quarterly national accounts publications continue to be small in size. Annual supply and use balancing and revisions due to methodological improvements provide a larger source of revision, and it would be helpful to users if we could separate out data revisions from methodological revisions. In the impact articles for Blue Book 2017, we provided users with detailed analyses of the types of revisions. The changes introduced in Blue Book 2017 led to minimal changes to the profile of GDP and more modest than some of those in previous years.
This article also looked at the revisions to the saving ratio and balance of payments. These revisions were more pronounced in the Blue and Pink Books 2017, reflecting methodological improvements to how we record dividend income and interest payments on corporate bonds. This led to an upward revision to the saving ratio, and a wider current account deficit.
Future analysis will continue to provide an in-depth analysis of how revisions in forthcoming Blue and Pink Books compare to historical revisions, providing an overview of the methodological changes and the impact of these changes on headline indicators in the national accounts. This will include looking at revisions to underlying components of these indicators to provide a richer understanding of these revisions, as well as an initial analysis of revisions following the introduction of the new publication model.
Nôl i'r tabl cynnwys15. Annex A: BB2017 revisions, Current price, 1997 to 2015
Analysis of revisions in Blue Books and Pink Books: annexes
Nôl i'r tabl cynnwys16. Annex B: Background to the national accounts gross domestic product (GDP) and the supply and use approach
Production approach
Production (or output) is estimated as the value of the output of goods and services produced across the whole economy. Output less intermediate consumption is known as gross value added (GVA).
Expenditure approach
The expenditure approach is estimated as the value of the final consumption expenditure by consumers, non-profit institutions and government; plus gross capital formation; plus exports of goods and services; minus imports of goods and services.
Income approach
The income approach is estimated as the income generated by individuals, non-profit institutions serving households (NPISH), government, and corporations in the production of goods and services, that is, compensation of employees plus gross mixed income plus gross operating surplus; plus taxes on production and imports; minus subsidies on production.
Supply and use
Whilst each of the three approaches is attempting to measure the same economic value, the different sources and the statistical and non-statistical errors associated with these sources means that the totals arrived at by the three approaches are not equal. The supply and use framework represents a structure that enables confrontation of these sources in a coherent way, with the aim of achieving a single estimate of gross domestic product (GDP).
More information
Further information is included in "A short guide to the UK National Accounts", published on 30 September 2015.
Nôl i'r tabl cynnwys17. Annex C: Background to the compilation of gross domestic product (GDP)
Introduction to compiling GDP
In common with other countries and following methods and principles agreed by international statistical bodies, the UK National Accounts are built up from a variety of surveys and administrative sources, which measure activity in the economy in different ways. In particular, gross domestic product (GDP) can be measured in terms of three distinct approaches: production, expenditure and income. The sources used in compiling the national accounts are shown in Annex D.
In understanding the nature of revisions to GDP and their source, it is helpful to have in mind the framework and timetable for publishing successively improved estimates. Broadly, the main steps are:
preliminary estimates are published shortly after the end of the quarter to which they relate, based on partial output information
second and third estimates are published one and two months later, respectively, based on fuller output information but presenting evidence from expenditure and income sources
estimates are further refined in the annual "Blue Book" after application of supply and use table balancing at detailed sector and product level.
These steps are described more fully in the following sections.
Preliminary estimate
In the UK, the first or preliminary estimate of GDP in a particular quarter is published just three and a half weeks after the end of the quarter and is one of the fastest in the world. This estimate is based exclusively on output data. No information on the income or expenditure measure is available in this timescale and indeed, there is no information on intermediate consumption. The assumption therefore is that, for any given industry, changes in output are a good proxy in the short-term for value added, that is, changes in intermediate consumption are the same as changes in output.
Further, the preliminary quarterly estimates of output are based on the monthly indicators that are published for each of the three main industrial sectors of the economy (production, services and construction). At the time of publication of the preliminary estimate, estimates of the first two months of the quarter are available for many industries but the estimate of the quarter includes a “nowcast” of the third month of the quarter, based on recent trends refined by around a 30% response from businesses for that third month from the Monthly Business Survey. For some industries however, the short-term estimate of GDP is based on a quarterly indicator, which typically has to be nowcast at the time of the preliminary estimate. Overall, the preliminary estimate contains around 44% of real data content by weight, a figure that rises to 83% by the time of the second estimate and 92% by the third publication.
Second estimate and quarterly national accounts (third estimate)
The aim of the quarterly balancing and adjustment process is to reduce inconsistencies in the accounts and to come to a firm view on movements in key aggregates. The published accounts show all three approaches with similar movements and levels with credible explanations for movements in components. Our current judgement is that generally in the short term the output approach gives the best estimate of growth in GDP. This judgement is in part based upon the availability of source data for the various components of the output, expenditure and income approaches. To achieve this balance, we:
scrutinises the initial estimates of each component from the source data
apply judgmental adjustments to the estimates based on an assessment of the quality of those sources
apply explicit alignment adjustments to components of expenditure (changes in inventories) and income (gross operating surplus of private non-financial corporations) as these components are judged to have the widest error margins (alignment adjustments sum to zero for a calendar year where all four quarters have been published)
The results of this quarterly balancing process coupled with an explicit “statistical discrepancy” to account for residual differences in years since the latest year in which there are “balanced supply and use tables” provides a solution to the discrepancies in the different measures of GDP by putting forward the most coherent estimates that arise from the integrated accounts.
New publication model
As explained earlier, we will be moving towards a new GDP model in July 2018. This model would give two estimates of quarterly GDP using data from all three of the Output, Income and Expenditure approaches around six weeks and 13 weeks after the end of the preceding quarter. This would be a change from three estimates of quarterly GDP, published four, eight and 13 weeks after the end of the preceding quarter. For more details please see Changes to ONS Gross Domestic Product (GDP) release schedule.
Balanced supply and use tables
Supply and use tables (SUTs) provide the framework that ensures, for any "balanced year" the estimates of industry outputs, inputs and value added are confronted and a single picture of the industry produced. SUTs are currently published for 105 industries and products based on the 2007 Standard Industrial Classification for years 1997 to 2015 and on a current price basis only. The year 2015 was balanced for the first time in Blue Book 2017.
Producing SUTs allows an examination of consistency and coherence of national accounts components within a single detailed framework and, by incorporating the components of the three approaches to measuring GDP, enables a single estimate of GDP to be determined. The current methodological approach to determining GDP is based on the assertion that, for years where SUTs have been produced, GDP should be set at the level derived from the balance. For subsequent periods, this level is carried forward using short term movements in components according to the quarterly balancing process described in this annex. More details of the data sources for the different components of GDP are provided in Annex D.
Balancing SUTs is currently an annual exercise that is based on annual sources of data. That is, there is no additional information about the quarterly movements in GDP that comes from producing the SUTs. However, constraining the quarterly path of a component that comes from the short-term sources to the annual level that comes from balancing the annual sources can often be challenging, particularly when successive "benchmarks" are taking the estimates in opposite directions. This was particularly true in 2008 and 2009, where the SUTs suggested that the 2008 level of GDP was lower than previously thought but that 2009 was higher. Constructing a quarterly path through those two years was a particular challenge.
Nôl i'r tabl cynnwys18. Annex D: Sources used in compiling estimates of Gross Domestic Product (GDP)
Analysis of revisions in Blue Books and Pink Books: annexes
Nôl i'r tabl cynnwys19. Annex E: Gross Domestic Product (GDP) current price and chained volume measure annual growth by Blue Book
Analysis of revisions in Blue Books and Pink Books: annexes
Nôl i'r tabl cynnwys20. Annex F: Major causes of revisions by Blue Book
Blue Book 2001
Featured major revisions, including new information on sales by manufacturers to final consumers back to 1986, revisions to Producer Prices Indices (PPIs) for computers, from 1996 onwards. Reallocations of income between sectors following methods changes, reviewed allocation of self-employment income, rental income also now in mixed income, and revisions to operating surplus of insurance corporations included within financial corporations' operating surplus.
Blue Book 2002
No revisions pre-1996 and very closed in terms of revisions.
Blue Book 2003
A full supply and use table rebalance back to 1996. Introduction of annual chain-linking and moved from 1995 to 2000 for referencing. Also revised up imports of goods back to 1999 to adjust for impact of VAT Missing Trader Intra-Community (MTIC) fraud.
Blue Book 2004
Rebalance of 2001 and balanced 2002 for the first time. Reclassified NHS trusts from public corporation sector to central government sector back to 1991. Referenced from 2000 to 2001 and introduced a new method for estimating the output of government health services back to 1996 in chained volume measures (CVMs). Blue Book 2005
Rebalance of 2002 and balanced 2003, with the reference year moved from 2001 to 2002. Current price revisions back to 1991 for improving the recording of private pension contributions and receipts, and for CVM gross domestic product (GDP) there was a new methodology for the estimation of government education and social protection from 1996 onwards. Also improved the allocation of central government consumption to reflect machinery of government changes from 1996 onwards in CVMs.
Blue Book 2006
Full rebalance for 2003 and balanced 2004, with specific current price revisions to earlier years, mainly to apportion adjustments across industries which wasn't completed in BB 2005. Reference year moved from 2002 to 2003.
Blue Book 2007
Closed to all revisions except for revisions to estimates for private investment in own-account computer software back to the 1970s which increased current price levels. No supply and use rebalance of 2004, and no balance of 2005. Reference year unchanged.
Blue Book 2008
FISIM (financial intermediation services indirectly measured). For supply and use tables there was a rebalance of 2004, with 2005 and 2006 balanced for first time. Reference year unchanged.
Blue Book 2009
Rebalance of 2004 to 2006 and balanced 2007 for first time and moved from 2003 to 2005 as reference year.
Blue Book 2010
Rebalance of 2006 to 2007 and balanced 2008 for first time and moved from 2005 to 2006 as reference year.
Blue Book 2011
Introduction of SIC 2007 and CPA08, CORD systems and replacing RPI with CPI to deflate key expenditure and output components (back to 1997 only). Reference year moved from 2006 to 2008.
Blue Book 2012
Insurance revisions to clear gross national income (GNI) reservation taken back to 1987, deflator changed from RPI to CPI pre-1997 to start of GDP series. Reference year moved from 2008 to 2009.
Blue Book 2013
European System of Accounts (ESA) 95 GNI reservations for own account software, improved estimation of artistic originals and imputed rentals of owner occupiers were all addressed back to 1990. The gross capital formation methodological development revised estimates of gross fixed capital formation (GFCF) and changes in inventories back to 1997 and improvements were made to the estimates of bonds data and overseas deposits of private non-financial corporations. Improvements were also made to the alignment of national accounts with the public sector finances. Reference year moved from 2009 to 2010.
Blue Book 2014
ESA 95 GNI reservations relating to the measurement of the non-profit institutes serving households sector (NPISH), household expenditure on new cars, the inclusion of illegal activities into the national accounts, and improvements made to the measurement of “Own account construction”’. ESA 2010 implementation including research and development, weapons, decommissioning costs, small tools and pensions. Other changes included the review of public sector finances and further alignment of national accounts with public sector finances, improved methods for inventories and gross fixed capital formation, Producer Price Index (PPI) and Services Producer Price Index (SPPI) re-basing from 2005 to 2010. Reference year moved from 2010 to 2011.
Blue Book 2015
ESA 95 GNI reservations for exhaustiveness adjustments for concealed income and under-coverage of unincorporated businesses, new estimates within the NPISH sector and a rebalance across all sectors, cross-border property income, improvements to the estimation of spending on repairs and maintenance of dwellings by householders, improvements to the estimation of the consumption of fixed capital on roads and a change to the recording of Vehicle Registration Tax as a fee paid on a vehicle when it is first registered. Other improvements related to gross fixed capital formation, reclassifications, local government pensions, alcohol and tobacco in household final consumption expenditure, narcotics, Consumer Price Index including housing (CPIH) alignment, insurance industry measurement. Reference year moved from 2011 to 2012.
Blue Book 2016
Methodological improvements include imputed rental, exhaustiveness adjustments for concealed income, estimates for Value Added Tax fraud, illegal activities, own account construction, Transport for London capital stock changes, natural gas imports from Norway. Corrections made to gross fixed capital formation for improvements to dwellings and to agricultural data. Reference year moved from 2012 to 2013.
Blue Book 2017
Methodological improvements include actual and imputed rental, improvements to recording gross fixed capital formation, separation of estimates for the households and non-profit institutions serving households sector. Improving the data sources for dividend income of the self-employed, introducing the new securities dealers survey data and methods, improving the treatment of corporate bonds, shares and dividends methods and data sources. Other methodological improvements include unfunded public sector pensions methodology review, improvement to illegal activities, revised estimates of exhaustiveness and concealed income adjustment, revised estimates of Value Added Tax fraud, BBC data update, and public sector finances alignment. Reference year moved from 2013 to 2015.
Nôl i'r tabl cynnwys