Cynnwys
- Main points
- Statistician’s comment
- Summary
- The UK economy grew by an unrevised 0.4% in Quarter 3 2017
- Services and production increase in Quarter 3, while construction falls for the second consecutive quarter
- Household consumption picks up in Quarter 3 while growth in business investment slows
- Growth in compensation of employees slows but remains the largest driver of nominal GDP in Quarter 3
- GDP deflator slows in Quarter 3 2017
- CPIH remains unchanged at 2.8% in October 2017
- UK unemployment rate still at joint lowest since 1975 but employment falls slightly
1. Main points
The second estimate of gross domestic product (GDP) shows that the UK economy grew by 0.4% in Quarter 3 (July to Sept) 2017, unrevised from the preliminary estimate of GDP.
Growth in private consumption increased by 0.6% in Quarter 3, picking up from the relatively subdued growth of 0.2% in the previous quarter.
Services output is estimated to have increased by 0.4% in Quarter 3.
Growth in consumer prices including owner occupiers’ housing costs (CPIH) remained at 2.8% for October 2017, with the main contributions being transport, and food and non-alcoholic beverages.
The UK unemployment rate remained at 4.3% in the three months to September 2017, its joint lowest since 1975; however, the employment rate decreased by 0.1 percentage points on the previous quarter, as the number of people in work decreased for the first time since August to October 2016.
2. Statistician’s comment
Commenting on today’s gross domestic product figures, ONS statistician Rob Kent-Smith said:
“GDP growth in the third quarter remains similar to that seen in the first half of 2017 with professional activities, which include employment agencies and accountancy, providing the biggest contribution to growth this quarter.
“Household spending strengthened after a weak second quarter. Spending on transport, which includes cars, is contributing to growth this quarter, having driven the weakness in Quarter 2 after changes to Vehicle Excise Duty led people to bring forward their car purchases to Quarter 1. Meanwhile, growth in business investment remained positive but subdued in the most recent quarter.”
Nôl i'r tabl cynnwys3. Summary
The UK economy grew by 0.4% in Quarter 3 (July to Sept) 2017, unrevised from the preliminary estimate. Services and production increased in Quarter 3, while construction fell for the second consecutive quarter. Growth in private consumption increased by 0.6% in Quarter 3, picking up from relatively subdued growth of 0.2% in the previous quarter.
The Consumer Prices Index including owner occupiers’ housing costs (CPIH) 12-month growth rate remained unchanged at 2.8% in October 2017 from September 2017 with the main contributions being transport, and food and non-alcoholic beverages. The UK unemployment rate is still at its joint lowest since 1975 (4.3%) but employment fell slightly (by 0.1 percentage points on the previous quarter).
More detailed theme day economic commentary is available for:
Nôl i'r tabl cynnwys4. The UK economy grew by an unrevised 0.4% in Quarter 3 2017
Today’s (23 November 2017) GDP release estimates that UK economic growth was unchanged from the preliminary estimate at 0.4% for Quarter 3 (July to Sept) 2017. This is a slight pickup from the 0.3% growth recorded in each of the quarters in the first half of the year, although this is weaker than the 0.6% growth recorded across the EU in Quarter 3. Compared with the same quarter a year ago, the UK economy has grown by 1.5% (Figure 1).
Figure 1: Gross domestic product growth, quarter-on-quarter and quarter on same quarter a year ago growth rate
UK, Quarter 1 (Jan to Mar) 2008 to Quarter 3 (July to Sept) 2017
Source: Office for National Statistics
Notes:
- Q1 refers to Quarter 1 (Jan to Mar), Q2 refers to Quarter 2 (April to June), Q3 refers to Quarter 3 (July to Sept), Q4 refers to Quarter 4 (Oct to Dec).
Download this chart Figure 1: Gross domestic product growth, quarter-on-quarter and quarter on same quarter a year ago growth rate
Image .csv .xlsFollowing the EU referendum, UK economic growth was more resilient than consensus forecasts had initially expected. However, growth in the first half of 2017 was weaker than expected by the International Monetary Fund (IMF) in its April 2017 World Economic Outlook (WEO). In its most recent October 2017 WEO, the IMF downgraded its forecast for UK growth in 2017 to 1.7%, from 2.0% in its previously published forecast. Without revisions, the economy would need to increase by 0.8% in Quarter 4 (Oct to Dec) 2017 to record growth of 1.7% this year.
Nôl i'r tabl cynnwys5. Services and production increase in Quarter 3, while construction falls for the second consecutive quarter
In addition to the second estimate of gross domestic product (GDP), new data on services output have been published today (23 November 2017), which show that services output increased by 0.1% in September 2017. In line with the preliminary estimate of GDP, services output is estimated to have increased by 0.4% in Quarter 3 (July to Sept). Following a slow start to the year, in which services output increased by 0.1% in Quarter 1, the past two quarters have both seen steady growth at 0.4%. However, this is still below the average quarterly growth rate seen in 2016. Services output was almost entirely driven by a 0.6% rise in business services and finance in Quarter 3.
Figure 2 shows that while transport, storage and communications, business services and finance, and government and other services contributed positively towards the monthly growth, hotels and restaurants subtracted from total services output.
Services and production contributed towards growth in Quarter 3. The production sector continues to strengthen following a weak start to the year, increasing by 1.1% in Quarter 3 2017, while construction output fell by 0.9% in the same quarter. This marked a fall in construction output for a second consecutive quarter, the first time since Quarter 3 in 2012.
Figure 2: Index of Services by main components
UK, January 2015 to September 2017
Source: Office for National Statistics
Download this chart Figure 2: Index of Services by main components
Image .csv .xls6. Household consumption picks up in Quarter 3 while growth in business investment slows
The second estimate of gross domestic product (GDP) includes the first detailed picture of expenditure in Quarter 3 (July to Sept) 2017. This shows that private consumption and gross capital formation contributed positively to GDP growth in Quarter 3, while net trade subtracted from growth (Figure 3).
Growth in household final consumption increased by 0.6% in Quarter 3, in line with the average quarterly growth rate in 2016, picking up from the relatively subdued growth of 0.2% in the previous quarter. The strength in consumption was driven by a pickup in household expenditure on transport (including motor vehicles), largely reversing the sharp decline seen in the previous quarter. The path of quarterly growth in household spending through the first three quarters of 2017 was in part driven by changes in timing of car purchases in response increases in Vehicle Excise Duty on high-polluting vehicles (which came into force in April 2017). These changes led to consumers bringing forward planned new car purchases, this then led to a decline in Quarter 2 (Apr to June), and since then we have seen a modest recovery to expenditure on transport (including motor cars) into Quarter 3.
Figure 3: Contributions to gross domestic product growth, expenditure component, quarter-on-quarter, chained volume measure
UK, Quarter 1 (Jan to Mar) 2015 to Quarter 3 (July to Sept) 2017
Source: Office for National Statistics
Notes:
Components may not sum to total gross domestic product due to rounding and loss of additivity in data prior to open period. The statistical discrepancy is also not displayed.
Q1 refers to Quarter 1 (Jan to Mar), Q2 refers to Quarter 2 (April to June), Q3 refers to Quarter 3 (July to Sept), Q4 refers to Quarter 4 (Oct to Dec).
Download this chart Figure 3: Contributions to gross domestic product growth, expenditure component, quarter-on-quarter, chained volume measure
Image .csv .xlsGross capital formation (GCF) – which includes changes in inventories and acquisitions less disposals of valuables as well as gross fixed capital formation (GFCF) – contributed 0.5 percentage points to GDP growth in Quarter 3. GFCF did not contribute to GDP growth to one decimal place in Quarter 3, just increasing by 0.2% in the quarter (Figure 4). This was the weakest quarterly growth rate since Quarter 4 in 2015 and followed 0.6% growth in Quarter 2 2017. There was a broad subdued picture in growth in business investment (0.2%), government investment (negative 0.1%) and investment in private sector dwellings (0.3%) in Quarter 3. Business investment growth slowed to 1.3% in the year to Quarter 3 2017, to contribute only 0.1 percentage points to quarter-on-year GDP growth, the smallest growth contribution since Quarter 2 2016.
Figure 4: Contributions to gross fixed capital formation growth, quarter-on-quarter, chained volume measure
UK, Quarter 1 (Jan to Mar) 2015 to Quarter 3 (July to Sept) 2017
Source: Office for National Statistics
Notes:
- Q1 refers to Quarter 1 (Jan to Mar), Q2 refers to Quarter 2 (April to June), Q3 refers to Quarter 3 (July to Sept), Q4 refers to Quarter 4 (Oct to Dec)
Download this chart Figure 4: Contributions to gross fixed capital formation growth, quarter-on-quarter, chained volume measure
Image .csv .xlsThe total trade deficit widened from 1.3% of GDP in Quarter 2 to 1.8% of GDP in Quarter 3. This was due largely to an increase in the imports of machinery, unspecified goods (including non-monetary gold) and fuels. Non-monetary gold (NMG) is a volatile component of UK trade, which has no impact on aggregate GDP as these movements in the international trade of NMG are exactly offset by movements in investment in valuables. The UK was a net importer of NMG in Quarter 3, having been a net exporter in the previous quarter, which helps explain why net trade subtracted from GDP growth in Quarter 3.
Nôl i'r tabl cynnwys7. Growth in compensation of employees slows but remains the largest driver of nominal GDP in Quarter 3
Nominal gross domestic product (GDP) increased by 0.7% in Quarter 3 (July to Sept) 2017, the same rate as in Quarter 2 (April to June). Compensation of employees (COE) remained the largest positive contributor to nominal GDP growth, although COE growth moderated to 0.7% on a quarter-on-quarter basis (Figure 5). Nominal GDP growth in Quarter 3 was also supported by a 0.6% rise in total gross operating surplus (GOS).
Figure 5: Contributions to nominal gross domestic product growth by income component, quarter-on-quarter
UK, Quarter 1 (Jan to Mar) 2015 to Quarter 3 (July to Sept) 2017
Source: Office for National Statistics
Notes:
Components may not sum to nominal gross domestic product due to rounding and loss of additivity in data prior to open period. The statistical discrepancy is also not displayed
Q1 refers to Quarter 1 (Jan to Mar), Q2 refers to Quarter 2 (April to June), Q3 refers to Quarter 3 (July to Sept), Q4 refers to Quarter 4 (Oct to Dec).
Download this chart Figure 5: Contributions to nominal gross domestic product growth by income component, quarter-on-quarter
Image .csv .xls8. GDP deflator slows in Quarter 3 2017
The gross domestic product (GDP) deflator rose by 0.3% in Quarter 3 (July to Sept) 2017 (Figure 6) and by 1.9% compared with the same quarter a year ago. This marked the lowest quarterly growth rate since Quarter 4 (Oct to Dec) 2015.
The GDP deflator represents the broadest measure of inflation in the domestic economy, as it reflects changes in the price of all goods and services that comprise GDP, including the price movements in private and government consumption, investment and the relative price of exports and imports.
The slowing in Quarter 3 largely reflects a 0.5% fall in the general government consumption deflator and a slowing in the growth rate of the gross fixed capital formation (GFCF) deflator to 0.1% (down from 0.6% in Quarter 2). In volume terms, government consumption increased by 0.3% in Quarter 3, while it fell by 0.3% in current prices. Growth in the GDP deflator has been weaker than price increases as measured by the Consumer Prices Index including owner occupiers’ housing costs (CPIH), which showed growth of 2.7% in the 12 months to Quarter 3. CPIH captures price changes facing households only, while the GDP deflator is a broader measure of inflation.
Figure 6: Gross domestic product deflator growth, quarter on quarter
UK, Quarter 1 (Jan to Mar) 2015 to Quarter 3 (July to Sept) 2017
Source: Office for National Statistics
Notes:
Contributions may not sum due to rounding.
Q1 refers to Quarter 1 (Jan to Mar), Q2 refers to Quarter 2 (April to June), Q3 refers to Quarter 3 (July to Sept), Q4 refers to Quarter 4 (Oct to Dec)
Download this chart Figure 6: Gross domestic product deflator growth, quarter on quarter
Image .csv .xls9. CPIH remains unchanged at 2.8% in October 2017
The Consumer Prices Index including owner occupiers’ housing costs (CPIH) 12-month growth rate was 2.8% in October 2017, unchanged from September 2017. The steady increase in the inflation rate since late 2015 has slowed over the last six months, with the rate having ranged between 2.6% and 2.8% since April 2017. All of the broad categories of goods and services had an upward effect on the CPIH 12-month rate in October 2017 with transport, and food and non-alcoholic beverage prices being particularly important factors in driving the changes in the rate.
The food category of the index grew by 4.2% since October 2016 – contributing 0.3 percentage points to the overall 12-month growth rate of all-items in the CPIH. Figure 7 shows the main contributors were staple products such as meat, vegetables, bread and cereals, and dairy products (milk, cheese and eggs).
Figure 7: Contributions to the 12-month growth rate in the food category of the Consumer Prices Index including owner occupiers’ housing costs
UK, January 2015 to October 2017
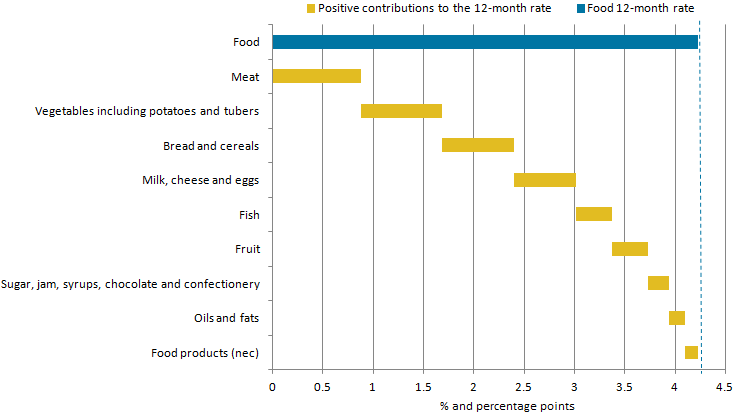
Source: Office for National Statistics
Download this image Figure 7: Contributions to the 12-month growth rate in the food category of the Consumer Prices Index including owner occupiers’ housing costs
.png (13.6 kB)
The Input Producer Prices Index (input PPI) grew by 4.6% in the 12 months to October 2017, down from 8.1% in the 12 months to September 2017. The output Producer Prices Index (output PPI) grew by 2.8% in the 12 months to October 2017, down from 3.3% in the 12 months to September 2017.
The following analysis builds on the Prices economic commentary and explores average prices and proportion of property transactions by property type in different regions. Figure 8 shows the proportion of housing transactions by property type for English regions and Wales in 2016. Flats tend to make up a relatively large proportion of transactions in southern regions of England compared with the other regions. This is especially evident in London, where flat transactions made up 58% of all transactions made in 2016, with the next highest proportion being 25% in the South East.
Unsurprisingly, as well as flats making up the highest proportion of transactions in 2016, London has the highest proportion of flats in its housing stock (PDF, 3.58MB) at just over 50% in 2011, compared with less than 20% in the rest of the country, and the highest population density of any region, at 4,980 people per square kilometre in 2010, more than 10 times the next highest population density of 490 people per square kilometre in the North West.
The proportion of terraced housing transactions is relatively consistent across all regions with London showing the smallest proportion of terraced housing transactions at 24.8% compared with the highest proportion of 32.3% in the North West. Detached and semi-detached property transactions combined accounted for around half or more of transactions in 2016 in all regions except London where they accounted for around 17%.
Figure 8: Proportion of English regions and Wales housing transactions by property type and region for 2016
Percentage of transactions made in 2016
Source: HM Land Registry price paid data, ONS calculations
Notes:
- Proportions may not sum to 100% due to rounding.
Download this chart Figure 8: Proportion of English regions and Wales housing transactions by property type and region for 2016
Image .csv .xlsFigure 9 shows that for all English regions, Wales and Scotland, detached housing is on average the most expensive property type. This is particularly evident in London where the average price of a detached property is more than £316,000 more than semi-detached, the next most expensive property type. This may be partly explained by the very low proportion of detached properties in London with less than 10% of the housing stock being detached.
Figure 9 also shows how, for each property type, the average price in southern English regions is higher than in northern English regions, Scotland and Wales. This is most evident when comparing the South East and the North East, where the average detached house price is £313,000 more in the South East compared with the North East. This North-South divide trend is consistent across all the property types but is most evident in detached housing.
Figure 9: Average house prices by property type for English regions, Wales and Scotland for 2016
Source: UK House Price Index
Notes:
- Abbreviatons are: L: London, SE: South East, EoE: East of England, SW: South West, WM: West Midlands Region, NW: North West, EM: East Midlands, S: Scotland, YH: Yorkshire and The Humber, NE: North East, W: Wales
Download this chart Figure 9: Average house prices by property type for English regions, Wales and Scotland for 2016
Image .csv .xls10. UK unemployment rate still at joint lowest since 1975 but employment falls slightly
Latest estimates from the Labour Force Survey show that the number of unemployed people in the UK fell by 59,000 to 1.42 million in the three months to September 2017 (Figure 10) compared with the three months to June 2017. The UK unemployment rate declined by 0.2 percentage points to 4.3% in the three months to September 2017, compared with the three months to June 2017. By age category, unemployment decreased across all age groups except for those aged 65 and over.
Figure 10: Unemployment rate and changes in employment level
UK, seasonally adjusted, July to September 2001 to July to September 2017
Source: Office for National Statistics, Labour Force Survey
Download this chart Figure 10: Unemployment rate and changes in employment level
Image .csv .xlsFigure 10 shows that the total employment level fell by 14,000 to 32.06 million in the three months to September 2017 compared with the previous quarter. This is the first decrease in the number of people in work since August to October 2016. For men, employment fell by 37,000 in the three months to September 2017 compared with the previous quarter, whereas for women it increased by 23,000 during the same period.
In the three months to September 2017, the number of employees decreased by 10,000 on the previous quarter whereas the number of self-employed increased by 4,000. For women aged 25 to 34 years, employment level was at a record high in the three months to September 2017. Although the employment rate decreased by 0.1 percentage points in the three months to September 2017, on the previous quarter, it is still up by 0.6 percentage points compared with a year ago.
In the three months to September 2017, a slight fall in employment was accompanied by an increase in the inactivity level of 117,000. During the same period, the inactivity rate increased by 0.3 percentage points to 12.6% compared with the previous quarter.
Nominal earnings increased by 2.2% (excluding and including bonuses) in the three months to September 2017 compared with a year earlier, however, they fell by 0.5% (excluding bonuses) and 0.4% (including bonuses) in real terms. This is because its rate of increase was less than that of the higher underlying inflation (Consumer Prices Index including owner occupiers’ housing costs (CPIH), which has risen to 2.8% in September 2017).
Wages and unemployment
Recent analysis examined the relationship between wages and unemployment and assessed whether there may be a compositional effect affecting this relationship. Figure 11 represents the wage Phillips curve, which illustrates the relationship between unemployment and wage growth.
Standard economic theory, as depicted by the Phillips curve, proposes that there is a trade-off between wage growth and unemployment. Wage growth increases when the unemployment rate falls and the other way around. Figure 11 illustrates this relationship broken into five time periods (2001 to 2006, 2007 to 2008, 2009 to 2011, 2012 to 2015 and 2016 to 2017). However, during the most recent period (2016 to 2017), as shown in Figure 11, the expected relationship between unemployment and nominal wage growth has been muted.
Figure 11 indicates that the Phillips curve appears to have shifted left in 2016 to 2017. It also seems to have changed its shape; far from being vertical in the long-run, in more recent times it appears to have resembled more of a horizontal line or a kinked line. However, between 2001 and 2007, a low unemployment rate (below 5.6%) corresponded with higher regular pay growth of 3%, whereas during 2007 to 2008 when unemployment rose to 6.4% in the three months to December 2008, wage growth fell to 3.3% during the same period.
Figure 11: Wage Phillips curve
UK, seasonally adjusted, January to March 2001 to July to September 2017
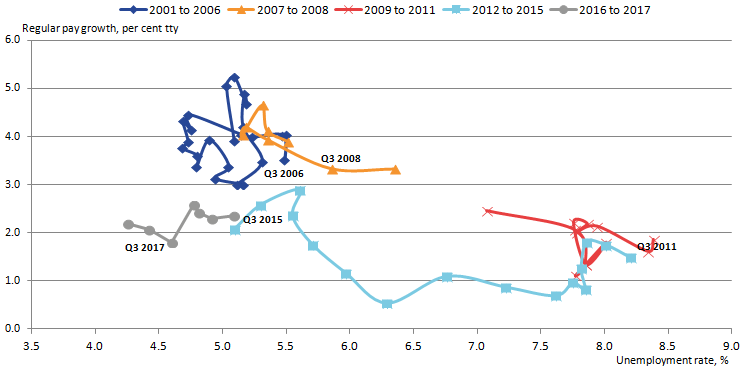
Source: Office for National Statistics, Labour Force Survey and Monthly Wages and Salaries Survey
Notes:
- Regular pay growth only includes employees1 in Great Britain.
Download this image Figure 11: Wage Phillips curve
.png (32.1 kB) .xls (32.8 kB)
In the last two years, unemployment has returned and outperformed its pre-downturn rates, however, nominal wage growth appeared far weaker compared with its pre-downturn growth trend recorded between 2001 and 2007. Based on the relationship between unemployment and pay growth between 2001 and 2007, nominal wage growth should currently lie somewhere between 3% and 5%. This is notably higher than current nominal wage growth, which stands at 2.2%.
Wages and industrial composition
An important question is whether there may be a compositional effect affecting the relationship between wages and unemployment? This compositional effect relates to the idea that wage growth can be affected by the characteristics of those in employment. Employee jobs data indicate jobs growth by sector in the private economy2 from the latest available period (June 2017) compared with a year earlier. Accommodation and food (I) and transport and storage (H) saw the largest gains in employee jobs (73,000 and 59,000 respectively), whereas real estate (L) and wholesale and retail trade (G) saw a decrease in employee jobs (26,000 and 1,000 respectively). Manufacturing (C) sector also marked a modest increase in employee jobs (22,000).
Median weekly pay grew by 2.3% in the year to April 2017 for all employees. Data from the Annual Survey of Hours and Earnings (ASHE) shows some marked sectoral differences in median and mean3 pay growth for employees. In the year to April 2017, the median wage in transport and storage (H) (the second largest contributor to employee jobs growth) decreased by 0.1%, whereas this sector’s mean wage increased by 1.2%. This suggests that the overall wage increase in this sector was driven by those employees earning higher than the average wage.
ASHE data shows that the highest growth in median wage was recorded in financial and insurance (K) and accommodation and food (I) (6.2% and 4.9% respectively). Despite the relatively large increase in median wage in accommodation and food (I), it should be noted that this is from a low base.
Figure 12: Box plot of distribution of pay by industry
UK, April 2017
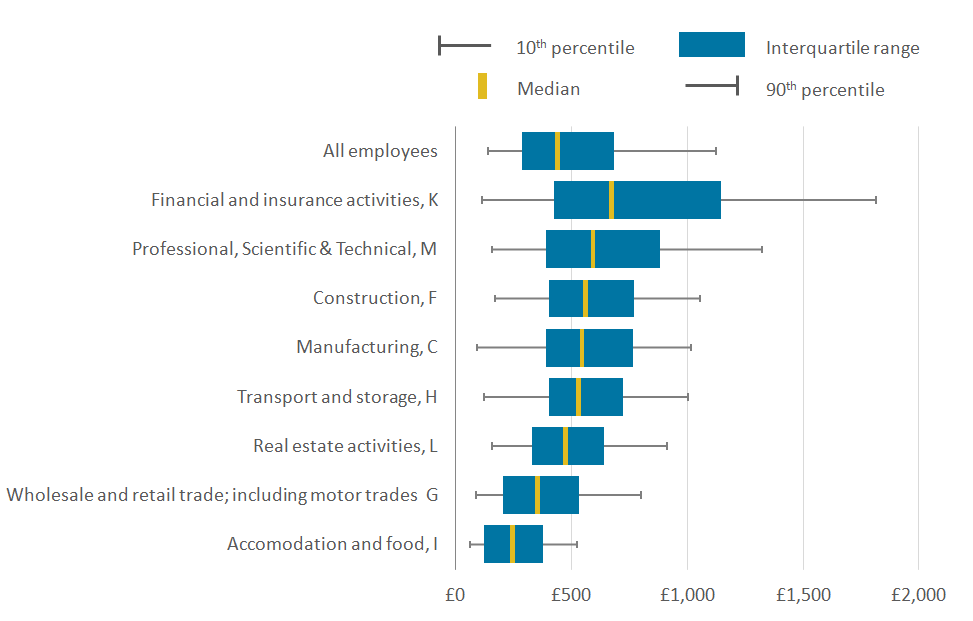
Source: Office for National Statistics, Annual Survey of Hours and Earnings
Notes:
Due to data limitations all the analysis in this commentary covers employees only and excludes self-employed.
In addition to public sector, analysis also excludes agriculture, forestry and fishing (A), mining and quarrying (B) and electricity, gas and water supply (E) due to the relatively low number of employees in these three sectors.
Changes in mean wage based on ASHE should be interpreted with caution given sampling variability between periods.
Download this image Figure 12: Box plot of distribution of pay by industry
.png (21.5 kB) .xls (30.2 kB)
The median wage for accommodation and food (I), the largest contributor to employee jobs, was £2444, which is about half of the total economy median weekly wage. In April 2017, transport and storage (H), which contributed the second largest number of employee jobs between 2016 and 2017, paid a median wage of £529 per week, which was higher than the total economy median weekly wage of £449 (Figure 12).
In addition, construction (F), manufacturing (C), financial and insurance (K) and professional, scientific and technical services (M) all paid higher than the total economy median wage (£560, £545, £672 and £592 respectively) and contributed to employee jobs creation between 2016 and 2017. The highest 10% of earners in financial and insurance (K) earned about twice as much as the highest 10% of earners among all employees, whereas the bottom 10% of all employees earned more than twice as much as the bottom 10% of employees in accommodation and food (I).
Figure 13: Relationship between employee jobs growth and median wage growth
UK, June 2016 to June 2017
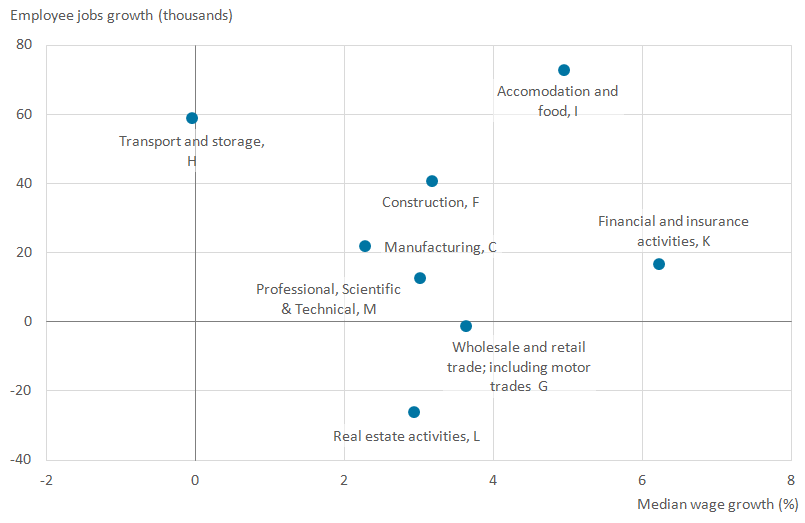
Source: Office for National Statistics
Notes:
- Figures for median and mean wage are rounded to the nearest pound (£).
Download this image Figure 13: Relationship between employee jobs growth and median wage growth
.png (17.7 kB) .xls (30.2 kB)
Figure 13 illustrates the relationship between median wage growth (X-axis) and employee jobs growth (Y-axis). As shown in Figure 13, the two sectors that contributed the largest number of employee jobs between April 2016 and April 2017 were accommodation and food (I) and transport and storage (H). Although the median wage in accommodation and food (I) increased by 4.9% from 2016 to 2017, this increase stems from a low base. The median wage in transport and storage (H) actually decreased between 2016 and 2017. These findings suggest that, over the past year, most jobs have been created in the two sectors with a relatively weakly performing median wage.
Notes for: UK unemployment rate still at joint lowest since 1975 but employment falls slightly
Due to data limitations all the analysis in this commentary covers employees only and excludes self-employed.
In addition to public sector, analysis also excludes agriculture, forestry and fishing (A), mining and quarrying (B) and electricity, gas and water supply (E) due to the relatively low number of employees in these three sectors.
Changes in mean wage based on ASHE should be interpreted with caution given sampling variability between periods.
Figures for median and mean wage are rounded to the nearest pound (£).