Cynnwys
- Main points
- Statistician’s comment
- Changes to publication schedule for economic statistics
- The preliminary estimate of GDP shows that the UK economy continued to grow by 0.6% in Quarter 4 2016, the same rate as the previous 2 quarters
- Retail and motor sales were among the firms to make the largest contribution to annual GDP growth
- Production output was flat in Quarter 4 2016
- The construction industry was relatively subdued
- Average prices for consumers and producers in 2016 have all risen from a historically low base
- Rising energy prices and the slowing of deflation in relatively import-intensive goods are pushing up inflation
- Employment growth flattened out in the 3 months to November 2016
- The labour market is closer to full capacity than a year ago
- The productivity puzzle shows little sign of ending
1. Main points
Services industries accounted for almost all of the 0.6% growth in gross domestic product (GDP) in Quarter 4 (Oct to Dec) 2016.
The construction industry was more subdued, with a 0.1% increase in Quarter 4 2016 following a 0.8% fall in the previous quarter and production output was flat in the quarter.
Increased producer prices have started to feed into higher consumer prices for food and energy.
Employment growth flattened out in the 3 months to November 2016.
The productivity puzzle shows little sign of ending; labour productivity measured by output per hour grew by 0.4% in Quarter 3 (July to Sept) 2016 – still lower than the pre-downturn (1994 to 2007) quarterly average growth rate of 0.5%.
2. Statistician’s comment
Commenting on today’s GDP figures, ONS Head of GDP Darren Morgan said:
"The initial ONS data show the economy ended 2016 with steady growth of 0.6% for the third consecutive quarter.
"Strong consumer spending supported the expansion of the dominant services sector and although manufacturing bounced back from a weaker third quarter, both it and construction remained broadly unchanged over the year as a whole."
Nôl i'r tabl cynnwys3. Changes to publication schedule for economic statistics
The Office for National Statistics (ONS) introduced its new economic "theme days" in January, which will ensure that related economic statistics are released together.
This article provides a summary of the data and economic commentary released on each theme day alongside a particular focus on the latest GDP estimate and trends beneath the headline statistics.
More detailed theme day economic commentary is available for:
Nôl i'r tabl cynnwys4. The preliminary estimate of GDP shows that the UK economy continued to grow by 0.6% in Quarter 4 2016, the same rate as the previous 2 quarters
Today’s GDP release contains new information regarding UK economic growth in Quarter 4 (Oct to Dec) 2016. In addition, more detailed data on services output in November have been published, as well as an early indication of output growth in production, construction and services in December.
Figure 1: GDP growth, quarter-on-quarter and 12-month growth rate
UK, Quarter 1 (Jan to Mar) 2008 to Quarter 4 (Oct to Dec) 2016
Source: Office for National Statistics
Download this chart Figure 1: GDP growth, quarter-on-quarter and 12-month growth rate
Image .csv .xlsThe preliminary estimate of GDP (Figure 1) suggests that the UK economy continued to grow by 0.6% in Quarter 4 2016, the same rate as the previous 2 quarters. The sustained nature of recent economic growth means that GDP has grown 16.1% since the trough of the economic downturn in 2009 and is currently 8.7% higher than the pre-downturn peak level of output in Quarter 1 (Jan to Mar) 2008.
Today’s data also complete the picture for 2016 as a whole – this shows GDP grew by 2.0% in 2016, close to the 2.2% growth seen in 2015, but some way below the average rate of calendar year GDP growth in the decade prior to the downturn (2.9%). Growth was also slightly lower than the average of independent forecasts made at the start of 2016, which was 2.2%. Over the calendar year, the services, production and construction industries grew by 2.8%, 1.1% and 1.4% respectively.
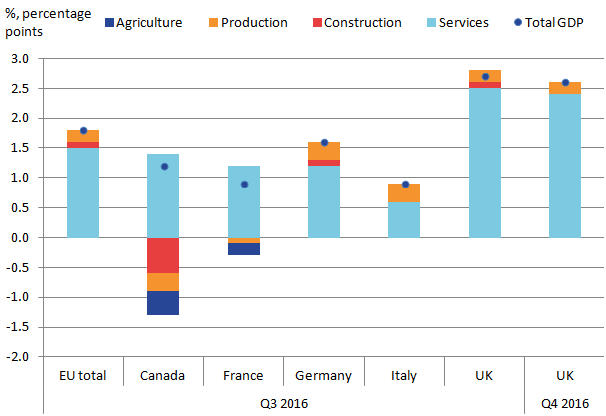
Figure 2 – which compares the level of UK GDP against a selection of G7 economies – also suggests that the UK economy continued to grow at rates comparable with other major economies. Comparing Quarter 3 (July to Sept) 2016 with Quarter 3 2015, GDP growth was similar to that seen in Germany and the USA, while it was higher than that in France, Japan and Italy. Looking over a longer time period shows that the USA and Canada have achieved slightly higher levels of GDP relative to their respective pre-downturn peak levels, however, this partly reflects the fact that output fell by slightly smaller amounts (negative 4.1% and negative 4.5%) during the economic downturn in 2008 to 2009 compared with the UK (negative 6.3%).
Comparing the relative performance of GDP between Q3 2014 and Q3 2016 across these countries suggests that the UK economy achieved the fastest rate of growth among the G7.
Figure 2: International comparison of GDP, quarterly levels, chained volume measure
Source: Office for National Statistics, the Organisation for Economic Co-operation and Development
Download this chart Figure 2: International comparison of GDP, quarterly levels, chained volume measure
Image .csv .xlsServices output grew by 0.8% in Quarter 4 2016, a slightly slower rate than the previous quarter. The latest data for services in December – which is based on early responses to the Monthly Business Survey – suggest output was flat in December following 0.3% growth in both October and November 2016.
The quarterly services growth almost entirely drove the overall movement in GDP growth, as production and construction both made negligible contributions. This was also seen across the remaining quarters in 2016. However, this trend is long-running and is not unique to the UK. Figure 3 – which plots headline industry contributions to growth for a selection of major economies1- suggests this is also the case for the UK’s major counterparts. Services accounted for the vast majority of growth across all economies shown. However, Germany and Italy saw slightly greater proportionate contributions from the production industries. Construction growth was similarly subdued across most of these economies.
Figure 3: International comparison of GDP contributions, by industry, chained volume measure, quarter on previous year
Quarter 3 (Jul to Sept) 2016 and Quarter 4 (Oct to Dec) 2016
Source: Office for National Statistics, the Organisation for Economic Co-operation and Development
Download this image Figure 3: International comparison of GDP contributions, by industry, chained volume measure, quarter on previous year
.png (12.7 kB) .xls (26.6 kB)
Notes for: The preliminary estimate of GDP shows that the UK economy continued to grow by 0.6% in Quarter 4 2016, the same rate as the previous 2 quarters
- Comparison excludes US and Japan – as data are not available at this level of detail (International Standard Industrial Classification of All Economic Activities, Rev.4 (ISIC Rev. 4)) on a quarterly basis.
5. Retail and motor sales were among the firms to make the largest contribution to annual GDP growth
The retail industry made the largest contribution to services and GDP growth, both in the quarter (0.08 percentage points of total GDP growth) and the calendar year (0.29 percentage points of total GDP growth). This follows recent strength in month-on-year sales data, which included strong growth in non-store retail (that is, retailers that sell predominantly online or through mail order), suggesting that consumers continued to increase spending in 2016.
In addition to retail, lower level detail reveals 4 further sub-industries that collectively accounted for over half of the annual rate of GDP growth (Figure 4). The sale of motor vehicles contributed 0.2 percentage points to GDP – a trend corroborated by a recent SMMT report that cites affordable finance deals as a potential factor. In addition, both IT, and management consulting and activities of head offices contributed a combined 0.5 percentage points to growth, while human health activities also made a substantial contribution (though this in part reflects its large weight to overall activity).
Looking over the remaining services industries suggests that a broad range of “consumer-focused” industries have supported services growth in recent periods (more information is available in December 2016’s Economic Review). For example, the accommodation, and food and beverage services industries also made healthy contributions to growth in Quarter 4 (Oct to Dec) 2016.
Figure 4: Top 5 services sub-industry contributions to GDP growth
Uk, 2016
Source: Office for National Statistics
Notes:
- Defined as 2 digit SIC sub-industries belonging to the services industries.
Download this chart Figure 4: Top 5 services sub-industry contributions to GDP growth
Image .csv .xls6. Production output was flat in Quarter 4 2016
Production activity was estimated to have risen by 0.6% in December 2016, resulting in flat growth in Quarter 4 (Oct to Dec) 2016 and 1.1% growth in the calendar year. The December figure followed 2 months of erratic figures with growth of negative 1.2% in October and 2.1% in November, a result of large movements in oil extraction output (which subtracted and added approximately a percentage point to production growth in October and November respectively). Both figures reflect the timing of maintenance for some North Sea oil fields – which temporarily reduces output for the duration of the work.
However, manufacturing has shown signs of a more sustained improvement, rising by 0.7% in Quarter 4 2016 and by 1.2% in December. Recent analysis has shown that this has coincided with a rising export share of total turnover across a range of manufacturing, especially in the (volatile) pharmaceutical industry. Increases in export orders in this industry were a significant driver of the rise in manufacturing in November.
Manufacturing rose by only 0.3% over 2016 as a whole. However, within this there was a wide variation of performances among the sub-industry detail. Figure 5 plots the sub-industries that made the largest positive and negative contributions to manufacturing growth over the calendar year.
Following from stronger sales, the production of new motor vehicles provided the strongest contribution to calendar year manufacturing. Strong growth was also achieved in aerospace production, other non-metallic mineral products (which includes typical products for construction such as cement, plaster and glass), as well as food production - with particular strength in tea, coffee and condiment production.
Those providing the largest negative contributions included chemicals, electrical products and basic metals including iron and steel production. Clothing production also showed a strong decline, continuing the long run trend seen in this industry.
Figure 5: Top 5 and bottom 5 contributions to manufacturing growth from low level sub-industries
UK, 2016
Source: Office for National Statistics
Notes:
- Two and three digit SIC sub-industries belonging to the manufacturing industry. Data for December 2016 is forecasted.
Download this chart Figure 5: Top 5 and bottom 5 contributions to manufacturing growth from low level sub-industries
Image .csv .xls7. The construction industry was relatively subdued
The preliminary estimate of construction continued to show subdued activity, with output rising by 0.1% in Quarter 4 (Oct to Dec) 2016. Previous analysis has showed that new construction orders – projects that have been agreed and are planned to be (or are already) underway – remains higher compared with a year ago. This indicator typically leads changes in construction output by 3 to 4 quarters, depending on the type of activity (although it is more difficult to pinpoint the lag length in longer-term work types such as infrastructure).
The small increase in construction in the quarter masks an uneven growth path over the 3 months: declines of 0.5% and 0.1% in October and November respectively were offset by growth of 1.0% in December.
However, over time there have been large differences in the performance of lower level types of work. For example, comparing November 2016 with November 2015, new housing work grew by 12.6% over this period. In contrast, all repair and maintenance (which accounts for just over a third of construction output) fell by 3.6%. This indicator typically leads changes in construction output by between three or four quarters, depending on the type of activity (although it is more difficult to pinpoint the lag length in longer-term work types such as infrastructure).
Nôl i'r tabl cynnwys8. Average prices for consumers and producers in 2016 have all risen from a historically low base
Figure 6 shows the average annual rate of consumer price inflation and producer input and output price inflation over the last 10 years. This shows the period of deflation in producer prices during 2014 and 2015, and zero average consumer price inflation in 2015. All the price indices then grew in 2016 compared with the previous year.
Figure 6: Annual average growth in PPI input (left-hand scale), PPI output prices (left-hand scale) and consumer prices (CPI) (right-hand scale)
UK, 2006 to 2016

Source: Office for National Statistics
Download this image Figure 6: Annual average growth in PPI input (left-hand scale), PPI output prices (left-hand scale) and consumer prices (CPI) (right-hand scale)
.png (25.5 kB) .xls (17.9 kB)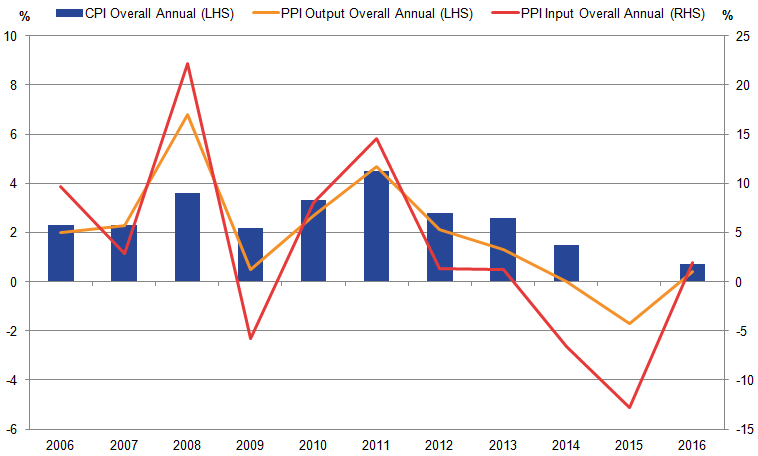
Analysis from the Prices Economic Commentary: January 2017 shows that the upward pressure on producer input prices during 2016 is particularly related to goods used to process oil and to produce food, metal and chemical products. These input costs can be seen to be relatively closely related to changes in the sterling effective exchange rate, which depreciated by around 12% during 2016.
Increased producer prices have started to feed into higher consumer prices for food and energy
Previous analysis of the Consumer Prices Index (CPI) and Producer Price Index (PPI) has shown that the recent increase in input prices for crude oil processors has begun to feed into increased output producer prices for refined petroleum products. These series are related to the sterling effective exchange rate and the price of crude oil. The increase in prices of refined petroleum products in recent months is also feeding through into higher consumer prices for fuels and lubricants.
Food is another product group where there is a relatively close relationship between PPI input and output price growth, and growth in the associated CPI component. Analysis from the Prices Economic Commentary: January 2017 shows that 12-month growth rates for food product input and output prices have been increasing, which tend to be reflected in consumer price growth for food products within the CPI.
Nôl i'r tabl cynnwys9. Rising energy prices and the slowing of deflation in relatively import-intensive goods are pushing up inflation
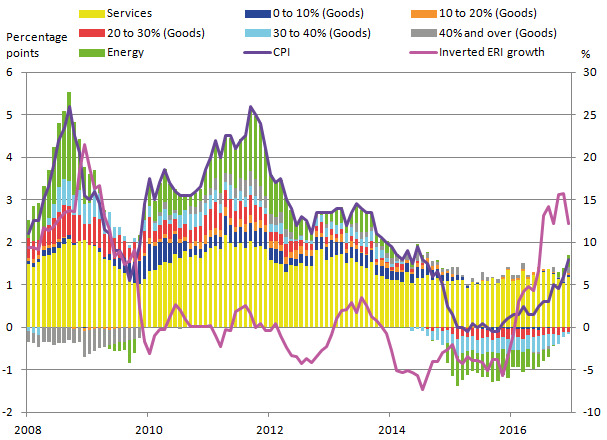
Figure 7 shows that while services price inflation has consistently contributed around 1 to 2 percentage points of the headline 12-month CPI growth rate in recent years, the contribution (positive or negative) from energy-related goods and relatively more import-intensive goods (20 to 30%, 30 to 40% and 40% and over groups) has been more varied.
Figure 7: Contributions to 12-month CPI growth, by import intensity of goods (left-hand scale) and inverted effective exchange rate (right-hand scale)
UK, January 2008 to December 2016
Source: Office for National Statistics, Bank of England
Notes:
- Energy includes electricity, gas and other household fuels as well as fuels and lubricants for motor vehicles.
Download this image Figure 7: Contributions to 12-month CPI growth, by import intensity of goods (left-hand scale) and inverted effective exchange rate (right-hand scale)
.png (36.5 kB) .xls (48.1 kB)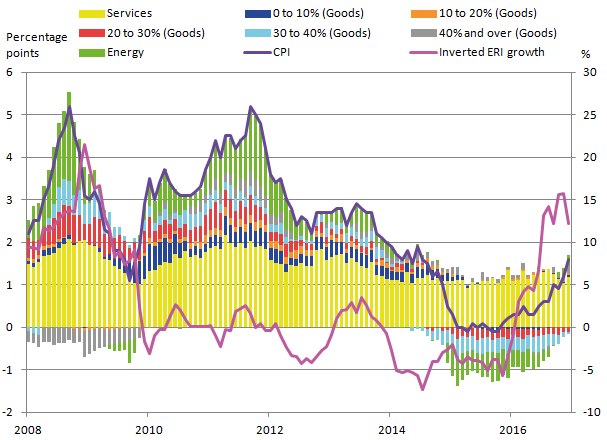
The negative contribution from the 20 to 30% and 30 to 40% groups to 12-month headline CPI growth has lessened in recent months of 2016, while energy and the 40% and over group of goods have contributed positively to headline growth in the last 3 to 4 months of 2016. These upward price pressures are likely to be influenced by the fall in the sterling effective exchange rate during 2016.
Nôl i'r tabl cynnwys10. Employment growth flattened out in the 3 months to November 2016
The number of people in work remained broadly unchanged in the most recent quarter (3 months to November 2016) at 31.80 million, following 5 consecutive quarters of growth (Figure 8). The employment rate was at a joint record high of 74.5%. Average weekly hours worked was relatively stable at 31.9 in the 3 months to November 2016. Similarly, the number of vacancies has remained steady since early 2015 after rising strongly from 2012 to 2014.
The activity rate (the proportion of people aged between 16 and 64 who were economically active) was 78.3% in the most recent quarter, while the participation rate (the proportion of people aged over 16 who were economically active) declined to 63.6% after reaching a record high of 63.8% in the previous quarter.
Figure 8: Quarterly change in employment
UK, September to November 2008 to September to November 2016
Source: Office for National Statistics, Labour Force Survey
Notes:
- Quarterly change in employment is calculated using non-overlapping three month periods. The latest quarter shown is the three months to November 2016.
Download this chart Figure 8: Quarterly change in employment
Image .csv .xls11. The labour market is closer to full capacity than a year ago
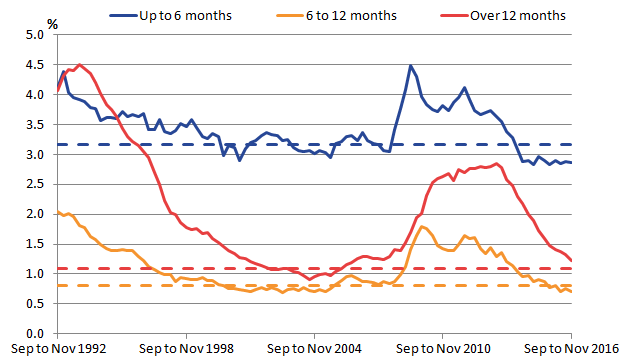
Consistent with past strength in labour demand, the unemployment rate declined to 4.8% in the quarter to November 2016, its lowest level since the quarter to September 2005. By duration, short-term unemployment as a share of the economically active is now below its pre-crisis average, while long-term unemployment as a share of the economically active is approaching its pre-crisis average (Figure 9).
Figure 9: Unemployment as a percentage of economically active, by duration
UK, September to November 1992 to September to November 2016
Source: Office for National Statistics, Labour Force Survey
Notes:
- Dashed lines indicate pre-crisis averages (calculated over 2002 to 2007)
- People who have been unemployed for up to 6 months are defined as short-term unemployed
- People who have been unemployed for 12 months or longer are defined as long-term unemployed
Download this image Figure 9: Unemployment as a percentage of economically active, by duration
.png (18.6 kB) .xls (43.0 kB)
Wage growth remains moderate compared with longer run trends
Average weekly earnings for employees increased by 2.8% between September and November 2016 including bonuses and by 2.7% excluding bonuses compared with a year earlier. The rate excluding bonuses is the highest it has been since June to August 2015 (2.8%) but well below the pre-crisis average of 3.8% experienced between 2002 and 2007.
Taking into account the recent pick-up in the pace of consumer price inflation, real average weekly earnings increased by 1.8% including bonuses and by 1.7% excluding bonuses over the year (comparing the latest 3 month average to November with a year earlier). This compares with average annual real wage growth of 2.4% between 2002 and 2007.
Nôl i'r tabl cynnwys12. The productivity puzzle shows little sign of ending
Labour productivity measured by output per hour grew by 0.4% in Quarter 3 (July to Sept) 2016. This is considerably lower than the pre-downturn (1994 to 2007) average of 0.5% per quarter.
Figure 10: Trends and actual output per hour and output per worker
UK, seasonally adjusted, Quarter 1 (Jan to Mar) 1994 to Quarter 3 (July to Sept) 2016
Source: Office for National Statistics
Notes:
- Economic downturn = Quarter 2 (Apr to June) 2008 to Quarter 2 2009.
Download this chart Figure 10: Trends and actual output per hour and output per worker
Image .csv .xlsEach measure reached its peak value in Quarter 4 (Oct to Dec) 2007. Productivity has not returned to its projected pre-downturn trend primarily due to a strong labour market performance alongside a relatively weak recovery in output growth. Output per hour in Quarter 3 2016 would have been 18.4% higher had it followed the pre-downturn trend.
Non-financial services contributed 2.9 percentage points to the 1.2% cumulative rise in whole economy output per hour since Quarter 1 (Jan to Mar) 2008, but this has been largely offset by negative contributions from non-manufacturing production1 and financial services.
Nominal output per hour varies across countries and regions of the UK
London has the highest nominal output per hour, at 32% above the UK average in 2015. This is an increase from 28% above the UK average in 2005. Scotland also improved its productivity performance relative to the UK average over this period, but Wales and the English regions in the north and Midlands experienced a weakening in their productivity performances. However, the ranking of countries and regions relative to the UK average remains similar over time, so there remain persistent differences in productivity between the regions.
In addition, experimental analysis shows there is also quite a wide variation in productivity levels within regions. Figure 11 plots the distribution of firm-level productivity for some of the NUTS1 regions of Great Britain2, illustrating how plant-level output per employee varied in 2014. For example, the distribution of firm-level productivity in London is skewed towards higher productivity levels compared with the distribution of firm productivity levels in other regions. The median firm-level gross value added (GVA) per worker in London is 36% above the average for Great Britain in 2014. This compares with Wales, which has the lowest firm-level median GVA per worker at 28% below the Great Britain average.
Figure 11: Distribution of firm level productivity (gross value added (GVA) per worker) in the non-financial business economy
NUTS1 regions, 2014
Source: Office for National Statistics
Notes:
- Negative values for gross value added per worker are caused by some firms reporting purchases which exceed their turnover. This reflects operating losses and results in negative value added per worker.
- The non-financial business sector does not include the finance or agriculture sectors and also excludes the public sector.
Download this chart Figure 11: Distribution of firm level productivity (gross value added (GVA) per worker) in the non-financial business economy
Image .csv .xlsNew data finds a strong association between the prevalence of structured management practices and higher levels of productivity
More firm level, experimental data from a new ONS survey on the use of structured management practices among British manufacturing businesses shows a strong association between higher prevalence of structured management practices and higher levels of productivity.
The analysis finds those most likely to benefit from this association – with relatively higher management practice scores, that is, large, multinational and non-family owned businesses, account for a small share of the British manufacturing population, with most businesses being small, domestic and family-owned-and-managed and associated with lower levels of structured practices and productivity.
Notes for: The productivity puzzle shows little sign of ending
Non-manufacturing production refers to: 1) Agriculture, Forestry and Fishing, 2) Mining and Quarrying, 3) Electricity, Gas, Steam and Air Conditioning Supply, and 4) Water Supply, Sewerage, Waste Management and Remediation Activities.
Our BRES dataset for this analysis did not include employment estimates for Northern Ireland. As such, there are no Northern Ireland results included with this analysis.