Cynnwys
- Main points
- Statistician’s comment
- Changes to publication schedule for economic statistics
- The second estimate of GDP shows that the UK economy grew by 0.7% in Quarter 4 2016, revised up by 0.1 percentage points from the preliminary estimate
- Services output remained the largest driver of growth, with transport, storage and communication important contributors to monthly growth in December 2016
- Production activity increased 1.2% during 2016 due to increased manufacturing output
- The effect of sterling depreciation on the balance of trade and trade remains unclear
- GDP growth continues to be driven by private consumption while the contribution from investment was weaker
- Quarterly profits grew at the fastest rate for 2 years
- Consumer prices rose in the UK and other developed countries with higher oil prices a contributing factor
- House prices in London have grown around twice as fast as in Great Britain as a whole since 2011
- UK economy continues to add jobs in the 3 months ending December 2016, but the increase is smaller than the recent past
- The labour market shows continued strength
- A pick-up in consumer price inflation erodes growth in wages
1. Main points
- Gross domestic product (GDP) grew by 0.7% in Quarter 4 (Oct to Dec) 2016, revised up by 0.1 percentage points from the preliminary estimate.
- Production activity increased 1.2% during 2016 due to increased manufacturing output.
- Quarterly profits grew at the fastest rate for 2 years.
- Consumer prices have risen in the UK and other developed countries in 2016 with higher oil prices a contributing factor.
- House prices in London have grown around twice as fast as in Great Britain as a whole since 2011.
- The labour market shows continued strength with unemployment at 4.8% in Quarter 4 2016; however, the proportion of part-time workers who want to work full-time remains above the pre-downturn average.
2. Statistician’s comment
Commenting on today’s GDP figures, Head of GDP Darren Morgan said:
“The economy grew slightly more in the last three months of 2016 than previously thought, mainly due to a stronger performance from manufacturing.
“Overall, the dominant services sector continued to grow steadily, due in part to continued growth in consumer spending, although retail showed some signs of weakness in the last couple of months of 2016, which has continued into January 2017.”
Nôl i'r tabl cynnwys3. Changes to publication schedule for economic statistics
The Office for National Statistics (ONS) introduced its new economic "theme days" in January, which will ensure that related economic statistics are released together.
This article provides a summary of the data and economic commentary released on each theme day alongside a particular focus on the latest GDP estimate and trends beneath the headline statistics.
More detailed theme day economic commentary is available for:
Nôl i'r tabl cynnwys4. The second estimate of GDP shows that the UK economy grew by 0.7% in Quarter 4 2016, revised up by 0.1 percentage points from the preliminary estimate
Today’s GDP release shows a slight upward revision to UK economic growth in the last quarter (Oct to Dec) of 2016. Growth is now estimated to have been 0.7%, following growth of 0.6% in the previous 2 quarters. In addition new data on services output in December have been published.
Figure 1: GDP growth, quarter-on-quarter and quarter on previous year’s quarter growth rate
Quarter 1 (Jan to Mar) 2008 to Quarter 4 (Oct to Dec) 2016, UK
Source: Office for National Statistics
Download this chart Figure 1: GDP growth, quarter-on-quarter and quarter on previous year’s quarter growth rate
Image .csv .xlsOn a calendar year basis, GDP grew by 1.8% in 2016 – this was some way below the average rate of calendar year GDP growth in the decade prior to the downturn (2.9%) and lower than the average of independent forecasts made at the start of 2016, which was 2.2%. It also represented a slight downward revision on the previous estimate, which was a result of slightly lower estimates of growth in the first quarter of 2016. Over the 2016 calendar year, the services, production and construction industries grew by 2.9%, 1.2% and 1.5% respectively.
The UK economy continued to grow at rates comparable with other major G7 economies. Between Quarter 4 2016 and Quarter 4 2015, growth was slightly higher than the US (1.9%), Germany (1.8%) and France (1.1%). The sustained nature of recent UK economic growth means that output has grown 15.9% since the trough of the economic downturn in 2009 and is currently 8.6% higher than the pre-downturn level of output in Quarter 1 (Jan to Mar) 2008.
Nôl i'r tabl cynnwys5. Services output remained the largest driver of growth, with transport, storage and communication important contributors to monthly growth in December 2016
Although production and construction both grew in the final quarter (Oct to Dec) of 2016 and across the calendar year as a whole, services continued to account for a disproportionately large share of growth on both measures. The latest data for December, published alongside the GDP data, also confirm that the industry continued to grow at the very end of 2016, with output rising by a further 0.2% in the month.
However, Figure 2 shows a range of movements within the headline services measure, with some sub-industries recording expansion while some contracted in December. The largest driver of growth in December came from transport, storage and communication, which grew by 1.8% and contributed 0.2 percentage points to total services growth. This was mainly accounted for by publishing, audiovisual and broadcasting activities, which contributed 0.1 percentage points to total growth in services output.
The other notable movement in services output was a fall in distribution, hotels and restaurants output by negative 0.3% in December, as a fall in retail trade (excluding motor vehicles and motorcycles) contributed negative 0.1 percentage points to overall services growth. This follows the most recent retail sales data, which suggests higher average store prices have fed through to a lower quantity bought for a given amount spent. This was most prominent in the food store category.
Figure 2: Index of services by selected components
December 2013 to December 2016, UK
Source: Office for National Statistics
Download this chart Figure 2: Index of services by selected components
Image .csv .xls6. Production activity increased 1.2% during 2016 due to increased manufacturing output
Although it accounted for a smaller proportion of the increase in GDP than services, production activity returned to growth in Quarter 4 (Oct to Dec) 2016 and rose by 1.1% in December 2016. Moreover, growth in the calendar year was 1.2%, a slight upward revision on the previous estimate. Manufacturing provided the only positive contribution to the monthly growth rate of production activity in December, rising by 2.1%; however, a significant proportion of this growth was accounted for by the often volatile pharmaceuticals industry.
UK manufacturing output continues to perform in line with a range of G7 economies. Germany is currently the only G7 economy to have exceeded pre-downturn levels of manufacturing output, but the UK follows closely behind, with output only 2.3% below where it was in 2007. This is a smaller gap than the other G7 economies including the US (5.5% below 2007 levels) and Italy (20.6% below 2007 levels).
Nôl i'r tabl cynnwys7. The effect of sterling depreciation on the balance of trade and trade remains unclear
The overall UK trade deficit narrowed by £0.3 billion in December 2016 to £3.3 billion, with monthly export growth (2.4%) slightly outpacing import growth (1.7%). However, the growth in exports partly reflected a rise in “erratic” items that include aircraft and non-monetary gold. Excluding these erratics, the trade balance widened in December and over Quarter 4 (Oct to Dec) 2016 as a whole.
The depreciation of sterling since the middle of 2016 has generated significant interest around the response of UK trade. While there is strong evidence that export and import prices have been affected by this, the effect on the trade balance and volumes more widely remains unclear.
Figure 3 shows that there is little direct correlation between the value of imports, the value of exports and the exchange rate index. On a trade weighted basis, sterling depreciated 17.0% between the final quarters of 2015 and 2016, but despite this the latest data show little response, with the trade balance actually widening over the same period. However, this was a result of fairly large increases in the value of exports and imports (9.8% and 11.3% respectively).
Figure 3: Quarter on year growth in the value of trade and the sterling Exchange Rate Index
Quarter 1 (Jan to Mar) 1990 to Quarter 4 (Oct to Dec) 2016, UK
Source: Office for National Statistics
Download this chart Figure 3: Quarter on year growth in the value of trade and the sterling Exchange Rate Index
Image .csv .xls8. GDP growth continues to be driven by private consumption while the contribution from investment was weaker
The second estimate of GDP provides us with the first complete picture of expenditure over 2016 as a whole. Taken together, this shows continued strength in household spending, corroborating recent analysis on the strength of “consumer focused industries”. Private consumption expenditure grew 0.7% in Quarter 4 (Oct to Dec) 2016; this was lower growth than Quarter 3 (July to Sept) 2016, but given its large weighting within GDP (65.8%) the measure contributed 1.9 percentage points to the 1.8% calendar year GDP growth rate, shown in Figure 4. On an annual basis, private consumption expenditure growth increased to 3.0% in 2016, the strongest growth since 2004.
The contribution from private consumption was significantly above the average for the period after the economic downturn of 2008 to 2009 (1.0 percentage point), but was similar to the average for the 7 years leading up to the downturn (2.1 percentage points).
Figure 4: Contributions to annual GDP growth rate by expenditure components
1998 to 2016, UK
Source: Office for National Statistics
Notes:
- Components may not sum to total GDP due to rounding and loss of additivity in data prior to open period.
Download this chart Figure 4: Contributions to annual GDP growth rate by expenditure components
Image .csv .xlsFigure 4 also shows that the contributions to GDP growth from gross fixed capital formation (GFCF) have declined over the last 3 years, from 1.1 percentage points in 2014 to 0.1 percentage points in 2016. In addition, net trade went from making no contribution (to 1 decimal place) in 2015, to a contribution of negative 0.4 percentage points in 2016.
Finally, an examination of provisional estimates for quarterly growth in business investment shows a broad-based reduction in growth. A decline in buildings investment contributed negative 0.7 percentage points to rolling 4-quarter on 4-quarter total GFCF growth in Quarter 4 2016, compared with 2.4 percentage points in Quarter 2 (Apr to June) 2014. Investment in information and communication technology (ICT) equipment and other machinery and equipment has also slowed in recent years, contributing negative 0.3 percentage points in Quarter 4 2016 compared with 1.3 percentage points to GFCF growth in Quarter 2 2014 (a particularly strong quarter for these 2 asset types).
Nôl i'r tabl cynnwys9. Quarterly profits grew at the fastest rate for 2 years
In contrast to the expenditure measure, which shows a slight slowing of firms’ investment, the income measure shows a return to stronger growth for firms’ income. In Quarter 4 (Oct to Dec) 2016, gross operating surplus (GOS) rose by 4.5% in the quarter and by 8.1% compared with Quarter 4 2015. This was the fastest growth rate on a quarter-on-same-quarter a year ago basis since Quarter 3 (July to Sept) 2014 and was 4.8 percentage points above the long run average (since 1997).
Growth in the quarter was entirely driven by increases in private non-financial corporations (PNFCs) profits, which make up around 86% of total GOS, while financial corporations and public corporations made very small offsetting negative contributions to overall growth.
Figure 5 shows that contributions of income components to nominal GDP quarter-on-year growth have been predominantly positive since the economic downturn, with only gross operating surplus making any negative contributions since Quarter 4 2009. In the most recent quarter, GOS increased its contribution to GDP growth while the contributions from compensation of employees (COE) fell slightly by 0.2 percentage points and the contribution from “other income” (that includes the remuneration from self-employment among other measures) remained broadly stable.
Figure 5: Contributions to nominal annual GDP growth rate by income component
Quarter 1 (Jan to Mar) 2007 to Quarter 4 (Oct to Dec) 2016, UK
Source: Office for National Statistics
Notes:
- Contributions may not sum due to rounding.
Download this chart Figure 5: Contributions to nominal annual GDP growth rate by income component
Image .csv .xls10. Consumer prices rose in the UK and other developed countries with higher oil prices a contributing factor
Figure 6 shows that the 12-month growth rate in consumer prices, measured on a consistent basis by the Harmonised Index of Consumer Prices (HICP) have increased in the EU 28, UK, Germany, France and the US between December 2016 and December 2015.
Figure 6: 12-month growth rate for Harmonised index of consumer prices, selected EU countries and the USA
December 2015 and December 2016
Source: Eurostat
Notes:
- Data for USA are for November 2015 and November 2016.
Download this chart Figure 6: 12-month growth rate for Harmonised index of consumer prices, selected EU countries and the USA
Image .csv .xlsWithin the HICP, recently published economic commentary noted that a major contributor to the higher levels of inflation in December 2016 in the UK, EU 28, Germany and France was the fuels and lubricants component of the price index. All these countries reported 12-month growth rates of the fuels and lubricants component above 5%. This growth is likely to be influenced by the rise in oil prices, which are traded internationally in US dollars.
Looking more closely at the latest figures for the UK, Figure 7 shows that the transport division of the Consumer Prices Index (CPI), which includes fuels and lubricants, has grown 5.7% in the 12 months to January 2017.
Figure 7: Contribution to transport division 12-month growth rate, by class
January 2017, UK

Source: Office for National Statistics
Notes:
- Components may not sum due to rounding.
Download this image Figure 7: Contribution to transport division 12-month growth rate, by class
.png (15.8 kB) .xls (20.0 kB)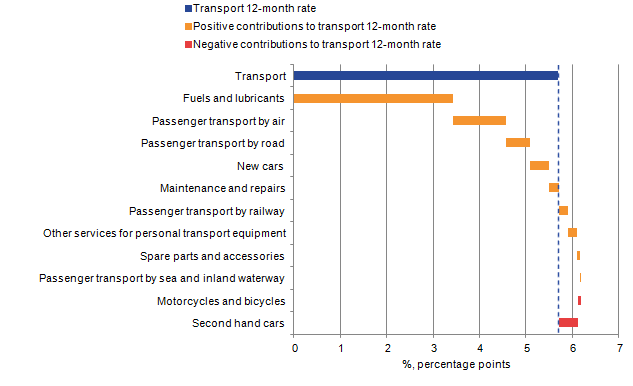
The growth in fuels and lubricants prices in the UK has largely been due to the combined effect of underlying increases in oil prices and the depreciation of sterling of around 17% against the dollar during 2016. While oil price rises affect all countries importing oil, currency effects are likely to be less significant for euro area countries such as Germany and France, as the euro has strengthened slightly against the dollar during 2016.
Figure 7 also shows that air, road and rail fares contributed positively to the January 2017 12-month growth rate for CPI transport prices alongside a positive contribution from new cars. The only negative contributions to the transport 12-month growth rate were second-hand cars and motorcycles and bicycles.
Nôl i'r tabl cynnwys11. House prices in London have grown around twice as fast as in Great Britain as a whole since 2011
Figure 8 shows that the average house price in London has grown around 68% in nominal terms since January 2011 and rental prices have grown around 23%. This compares with much lower growth in average house prices in Great Britain as a whole of around 32% between 2011 and 2016 and rental price growth of around 14%.
The 12-month house price growth rate has slowed in both London and Great Britain as a whole, particularly in the second half of 2016, with prices in December 2016 in London at around the same levels as in July 2016.
Figure 8: Average house prices and rental prices, London and Great Britain
January 2011 to December 2016
Source: Office for National Statistics, Land Registry
Notes:
- HPI is the House Price Index, published by ONS and Land Registry.
- IPHRP is the Index of Private Housing Rental Prices, published by ONS.
Download this chart Figure 8: Average house prices and rental prices, London and Great Britain
Image .csv .xlsIn contrast, average (median) earnings for full-time employees using data from the Annual Survey of Hours and Earnings (ASHE) have risen by around 10% in Great Britain between April 2011 and April 2016 and only 4% in London during this period (unadjusted for inflation). This measure of change in the median wage between periods will reflect changes to the composition of the workforce over this time, which may differ in different parts of the country. Similarly, the composition of the housing market is different in London to Great Britain as a whole, with London having considerably more high-value properties than other parts of the country.
These data show that the growth in median earnings per job in Great Britain has moved broadly in line with average rental price growth in the private sector since 2011, but has not kept pace with growth in average house prices. In London, the relatively low growth in median full-time wages has fallen well-short of both private rental and house price growth, leading to increased shares of income spent on rent and increased house price to earnings ratios during this period.
Nôl i'r tabl cynnwys12. UK economy continues to add jobs in the 3 months ending December 2016, but the increase is smaller than the recent past
The number of people in work increased by 37,000 in the 3 months to December 2016 to 31.84 million, with an increase in full-time employment (positive 45,000) partly offset by a fall in part-time employment (negative 7,000). Following 6 consecutive quarters of growth, the employment rate reached a new record high of 74.6%. However, the pace of employment growth in the second half of 2016 has moderated from the average rate experienced over 2012 to 2015 (Figure 9).
Figure 9: Quarterly change in employment
2008 to 2016, UK
Source: Office for National Statistics
Download this chart Figure 9: Quarterly change in employment
Image .csv .xlsOther measures of labour market activity remained relatively stable in the 3 months ending December 2016. Average weekly hours worked were 32.1, unchanged from the 3 months ending September 2016. Similarly, the number of vacancies has remained steady since early 2015 after rising strongly over 2012 to 2014. The gross flow from employment to unemployment is the lowest on record, while the ratio of redundancies to employment remains at a low level. Job-to-job flows – an indicator of labour market confidence – declined slightly in the 3 months to December 2016 but is now around its pre-crisis average.
Nôl i'r tabl cynnwys13. The labour market shows continued strength
Consistent with ongoing employment gains, the unemployment rate remained at 4.8% in the 3 months to December 2016, its equal lowest since the 3 months to September 2005. By duration, short-term unemployment as a share of the economically active remained at 2.8% in the quarter, its lowest since 1992, while long-term unemployment as a share of the economically active is approaching its pre-crisis average.
Despite a continued decline in the unemployment rate over the last 12 months, wage growth remains subdued by historical standards1, raising questions about the degree of spare capacity in the UK’s labour market.
Recent analysis examines a range of measures, which can be used to judge the degree of spare capacity and finds a broad-based tightening relative to a year ago. Figure 10 decomposes the supply of potential hours in the labour market to provide an alternative perspective on spare capacity.
Figure 10: Proportion of potential hours in the labour market
UK
Source: Office for National Statistics
Notes:
- The number of hours worked series is taken from the most recent labour market statistics release.
- The number of potential extra hours that part time workers could supply by moving to full time jobs is calculated by multiplying the number of people in this position by the difference between average full-time and average part-time hours.
- The number of potential extra hours that unemployed workers could supply is calculated by multiplying the number of unemployed people by average hours worked.
- The number of potential extra hours that inactive workers would like to supply is calculated by multiplying the number of inactive workers who report that they would like to have a job by average hours worked. There are a number of limitations to this approach as it is broad in scope and therefore may overestimate/underestimate the number of potential hours available in the economy. For example it includes: 1. People not seeking work, but who say they would like a job and are available 2. People not seeking work, but who say they would like a job but are not available.
- Note that these estimates are sensitive to the assumptions made in particular about the likely average hours of the unemployed and inactive. If these potential workers would prefer to work fewer hours than the current average, then the degree of labour market slack is over-stated by this measure. If, by contrast, they would prefer to work longer hours than average (for instance, because they are overwhelmingly seeking full-time work), the degree of slack on this measure would be understated. Finally, note that this analysis makes no allowance for an equilibrium rate or frictional level of unemployment.
- All data used are published in the Labour Market Statistics release: estimates of the potential hours supplied by part-time and unemployed workers are similar to, but differ slightly from, ONS estimates of underemployment and other work in the field.
Download this chart Figure 10: Proportion of potential hours in the labour market
Image .csv .xlsIn Figure 10, the gap between the total supply of potential hours and employment was relatively small before the financial crisis, suggesting that the labour market was relatively tight. In particular, the share of unemployment and the share of part-time workers that wanted to work full-time were small. However, after the economic downturn in 2008, the margin of spare capacity expanded, reflecting a significant increase in the proportion of unemployed and the proportion of part-time workers who want to work full-time.
Since 2011, the employment share has risen and the unemployment share has fallen gradually. However, recent developments have shown that although unemployment is falling as a proportion of desired hours, part-time workers wanting a full-time job increased significantly during the economic downturn, increasing further in the following years, and have been slow to contract since. The most recent data indicates that part-time workers who want to work full-time represent 2% of the potential supply of hours in the economy. This is much greater than the 1.2% average during the 2002 to 2007 period.
Notes for: The labour market shows continued strength
- On wages, see the section “ A pick-up in consumer price inflation erodes growth in wages” and for further discussion, see Saunders, M “The Labour Market”, Speech given to Resolution Foundation, 13 January 2017.
14. A pick-up in consumer price inflation erodes growth in wages
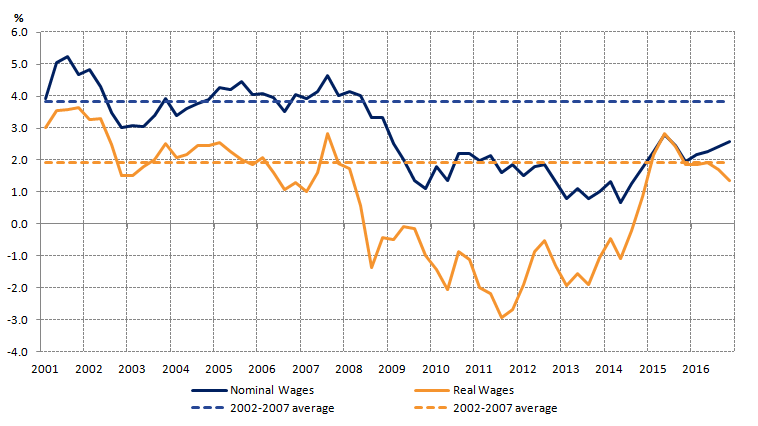
Average weekly earnings for employees increased by 2.6% in the year to October to December 2016, both including and excluding bonuses, compared with a year earlier. The rate excluding bonuses is the highest since the 3 months to June 2015 but well below the pre-crisis average of 3.8% experienced between 2002 and 2007 (see Figure 11).
However, taking into account the recent pick-up in the rate of consumer price inflation, real average weekly earnings increased by 1.4%, both including and excluding bonuses, over the year, the weakest pace of growth in almost 2 years.
Figure 11: Annual growth in regular average weekly earnings, real and nominal terms
UK
Source: Office for National Statistics
Notes:
- Dashed lines indicate pre-crisis averages (calculated over 2002 to 2007)].
- Real terms means adjusted for inflation using the Consumer Price Index (CPI).