Cynnwys
- Main points
- Statistician’s comment
- Summary
- The UK economy grew by 0.4 per cent in Quarter 3 (July to Sept) 2017, unrevised from the second estimate of GDP
- Services and production increase in Quarter 3 (July to Sept) 2017, while construction falls for the second consecutive quarter
- Household consumption picks up in Quarter 3 (July to Sept) 2017 to 0.5%
- Growth in compensation of employees slows but remains the largest driver of nominal GDP in Quarter 3 (July to Sept) 2017
- Households saving ratio falls to 5.2% in Quarter 3 (July to Sept) 2017
- The UK’s current account deficit narrows to 4.5% of GDP in Quarter 3 (July to Sept) 2017
- Growth in CPIH remains unchanged at 2.8% in November 2017
- The unemployment level falls at a slower rate as the UK employment rate declines
- Real wages fell for the eighth successive month
1. Main points
The UK economy grew by 0.4% in Quarter 3 (July to Sept) 2017, unrevised from the second estimate of gross domestic product (GDP).
For the first time, Value Added Tax (VAT) turnover data are used in the measurement of GDP, although the revisions from using this much larger and more comprehensive data source are small.
Growth in household consumption was revised down to 0.5% in Quarter 3 2017, following growth of 0.2% in Quarter 2 2017.
The households saving ratio fell from 5.6% to 5.2% in Quarter 3 2017, while the current account deficit narrowed from 5.1% to 4.5% of GDP.
Growth in consumer prices including owner occupiers’ housing costs (CPIH) remained unchanged at 2.8% in November 2017, while growth in the consumer price index (CPI) rose to 3.1%.
The UK unemployment rate was 4.3% in the three months to October 2017, the joint lowest unemployment rate since 1975.
2. Statistician’s comment
Commenting on today’s GDP figures, Head of National Accounts Darren Morgan said:
“Today’s unrevised third quarter figures show most of the growth came from the dominant service sector, with accounting, recruitment agencies and retailing all performing well.
"Manufacturing also boosted growth thanks to an increase in exports and the introduction of new car models. Meanwhile, household spending and business investment both grew steadily.
“This is the first time we have used VAT returns from hundreds of thousands of small and medium-sized businesses to help us calculate GDP. These returns improve the quality of our estimates and will allow us to paint a much more detailed picture of the UK economy.”
Nôl i'r tabl cynnwys3. Summary
The UK economy grew by 0.4% in Quarter 3 (July to Sept) 2017, unrevised from the second estimate of gross domestic product (GDP). Output in the services and production industries increased in Quarter 3 2017, while construction fell for the second consecutive quarter. Household consumption increased by 0.5% in Quarter 3 2017, revised down from 0.6%, but picking up from relatively subdued growth of 0.2% in the previous quarter. There has also been a large upward revision to export volumes growth in Quarter 3 2017, revised up to 0.8%. The households saving ratio fell from 5.6% to 5.2% while the current account deficit narrowed from 5.1% to 4.5% of GDP in Quarter 3 2017. Data from the start of 2016 are open to revision, which includes updates due to the annual benchmarking process as well as the incorporation of Value Added Tax (VAT) turnover data.
The Consumer Prices Index including owner occupiers’ housing costs (CPIH) 12-month growth rate remained unchanged at 2.8% in November 2017 with the main contributions from transport and food and non-alcoholic beverages. The 12-month growth rate of CPI was 3.1% – the highest since March 2012. In the three months to October 2017, the UK unemployment rate was at its joint lowest since 1975 (4.3%) but employment fell slightly on the previous quarter (by 0.1 percentage points).
More detailed theme day economic commentary is available for:
Nôl i'r tabl cynnwys4. The UK economy grew by 0.4 per cent in Quarter 3 (July to Sept) 2017, unrevised from the second estimate of GDP
Today’s Quarterly National Accounts show that the UK economy grew by 0.4% in Quarter 3 (July to Sept) 2017, unrevised from the second estimate of gross domestic product (GDP) published on 23 November 2017. Data from the start of 2016 are open to revision. The quarterly path in 2017 remains unchanged but the latest figures show a slightly stronger quarterly growth path in 2016, with growth in both Quarters 3 2016 and Quarter 4 (Oct to Dec) 2016 revised up by 0.1 percentage point (Figure 1).
Figure 1: Revisions to quarterly growth in real GDP
UK, Quarter 1 (Jan to Mar) 2015 to Quarter 3 (July to Sept) 2017

Source: Office for National Statistics
Download this image Figure 1: Revisions to quarterly growth in real GDP
.png (14.6 kB) .xlsx (10.2 kB)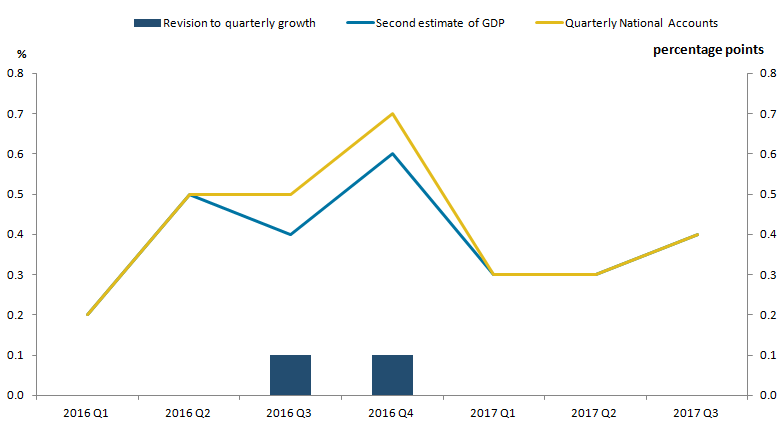
This has resulted in an upward revision to 2016 calendar-year growth from 1.8% to 1.9%, and has led to upward revisions to quarter-on-the-same-quarter-a-year-ago through 2017. Compared with the same quarter a year ago, the economy is now estimated to have grown by a revised 1.7% – the lowest rate since Quarter 1 (Jan to Mar) 2013 (Figure 2).
Figure 2: GDP growth, quarter-on-quarter and quarter on same quarter a year ago growth rate
UK, Quarter 1 (Jan to Mar) 2008 to Quarter 3 (July to Sept) 2017
Source: Office for National Statistics
Notes:
- Q1 refers to Quarter 1 (Jan to Mar), Q2 refers to Quarter 2 (April to June), Q3 refers to Quarter 3 (July to Sept), Q4 refers to Quarter 4 (Oct to Dec)
Download this chart Figure 2: GDP growth, quarter-on-quarter and quarter on same quarter a year ago growth rate
Image .csv .xls5. Services and production increase in Quarter 3 (July to Sept) 2017, while construction falls for the second consecutive quarter
As outlined in the latest VAT article, the December Quarterly National Accounts uses Value Added Tax (VAT) turnover data to supplement the Monthly Business Survey (MBS) in estimating parts of the output measure of output GVA for the first time. VAT turnover data have been incorporated into the output GVA estimates from January 2016 which, in addition to updated MBS estimates, has led to revisions from the figures published in the Index of Construction and Index of Production released earlier this month. The VAT data have been incorporated up to Quarter 2 (Apr to June) 2017. The impact of the introduction of VAT turnover data on headline growth rates of output GVA has been minimal, with an upwards revision of 0.1 percentage points for Quarter 3 (July to Sept) 2016 and Quarter 1 (Jan to Mar) 2017 only. While the output revisions had no impact on the overall balanced GDP estimate in Quarter 2 2017, it led to an upwards 0.1 percentage point revision in Quarter 3 2016. Figure 3 shows the contribution of VAT turnover data to revisions in quarterly growth in output GVA.
Figure 3: Decomposition of quarterly revisions to output GVA,
UK, Quarter 1 (Jan to Mar) 2016 to Quarter 2 (Apr to June) 2017
Source: Office for National Statistics
Notes:
- Components may not sum to revisions in GDP due to rounding
- GDP figures are to one decimal place while VAT and Other are to two decimal places
- Q1 refers to Quarter 1 (Jan to Mar), Q2 refers to Quarter 2 (April to June), Q3 refers to Quarter 3 (July to Sept), Q4 refers to Quarter 4 (Oct to Dec).
Download this chart Figure 3: Decomposition of quarterly revisions to output GVA,
Image .csv .xlsTotal production output is now estimated to have grown by 1.3% in Quarter 3 2017, revised up from 1.1%. Construction output has also been revised up and is now estimated to have fallen by 0.5% rather than by 0.9% – the second consecutive quarterly decline. Revisions to the recent quarterly profile of construction have resulted in noticeable changes in the quarter-on-quarter a year ago growth figures. Growth in construction output has seen an upward revision from 2.6% to 4.8% quarter-on-quarter a year ago growth in Quarter 3 2017. A similar effect is seen for production output, however to a lesser extent – quarter-on-quarter a year ago growth was revised up from 1.8% to 2.4% in Quarter 3 2017. Revisions to the quarterly path for services output have been less marked, with only small offsetting revisions in 2016 recorded. Growth in services output in Quarter 3 2017 was unrevised from 0.4%, with no revisions to its quarter-on-quarter a year ago growth.
Today’s new Index of Services figures show that total services output rose by 0.2% in October. This monthly rise was driven by business services and finance (0.2%), and government and other services (0.2%) – each contributing 0.1 percentage points towards growth in total services output. Meanwhile, the distribution, hotels and restaurants, and transport, storage and communication sectors did not contribute towards total services growth (to one decimal place). Services output increased by 0.3% in the three months to October compared with the three months to July.
Nôl i'r tabl cynnwys6. Household consumption picks up in Quarter 3 (July to Sept) 2017 to 0.5%
Today’s new estimates for the expenditure components of gross domestic product (GDP) show that private consumption and gross capital formation contributed positively to growth in Quarter 3 (July to Sept) 2017, while both government consumption and net trade made zero contribution (Figure 4). Table 1 shows the revisions to the composition to quarterly GDP growth, with the upward revisions to net trade the most significant.
Figure 4: Contributions to gross domestic product growth, expenditure component, quarter on quarter, chained volume measure
UK, Quarter 1 (Jan to Mar) 2015 to Quarter 3 (July to Sept) 2017
Source: Office for National Statistics
Notes:
- Components may not sum to total gross domestic product due to rounding and loss of additivity in data prior to open period. The statistical discrepancy is also not displayed.
- Q1 refers to Quarter 1 (Jan to Mar), Q2 refers to Quarter 2 (April to June), Q3 refers to Quarter 3 (July to Sept), Q4 refers to Quarter 4 (Oct to Dec).
Download this chart Figure 4: Contributions to gross domestic product growth, expenditure component, quarter on quarter, chained volume measure
Image .csv .xls
Table 1: Current vs previous contributions to quarterly GDP growth
| UK, Quarter 1 (Jan to Mar) 2016 to Quarter 3 (July to Sept) 2017 | |||||
|---|---|---|---|---|---|
| % and percentage points | |||||
| Private consumption | Government consumption | Gross Capital Formation | Net trade | GDP | |
| 2016 Q1 | 0.5 (0.5) | 0.2 (0.2) | -0.3 (-0.2) | -0.5 (-0.7) | 0.2 (0.2) |
| 2016 Q2 | 0.7 (0.6) | 0.0 (0.0) | -0.8 (-0.7) | 0.5 (0.4) | 0.5 (0.5) |
| 2016 Q3 | 0.5 (0.3) | 0.0 (0.0) | 1.4 (1.3) | -1.5 (-1.4) | 0.5 (0.4) |
| 2016 Q4 | 0.2 (0.3) | 0.0 (0.0) | -1.1 (-1.5) | 1.7 (1.7) | 0.7 (0.6) |
| 2017 Q1 | 0.1 (0.2) | 0.0 (0.0) | 0.5 (0.4) | -0.2 (-0.4) | 0.3 (0.3) |
| 2017 Q2 | 0.1 (0.2) | 0.1 (0.0) | -0.2 (-0.3) | 0.4 (0.4) | 0.3 (0.3) |
| 2017 Q3 | 0.3 (0.4) | 0.0 (0.0) | 0.1 (0.5) | 0.0 (-0.5) | 0.4 (0.4) |
| Source: Office for National Statistics | |||||
| Notes: | |||||
| 1. Components may not sum to total gross domestic product due to rounding. The statistical discrepancy is also not displayed. | |||||
| 2. Figures in parentheses refer to previously published contributions to GDP growth. | |||||
| 3. Q1 refers to Quarter 1 (Jan to Mar), Q2 refers to Quarter 2 (April to June), Q3 refers to Quarter 3 (July to Sept), Q4 refers to Quarter 4 (Oct to Dec). | |||||
Download this table Table 1: Current vs previous contributions to quarterly GDP growth
.xls (28.2 kB)Household consumption increased by 0.5% in Quarter 3 2017, revised down from the previously published estimate of 0.6%, but still up from the unrevised 0.2% growth seen in Quarter 2 (Apr to June) 2017. The downward revision is largely due to revisions to net tourism, and also restaurants and cafes. Over the rest of the revisions period, from quarter 1 2016, there are also revisions to life insurance expenditure due to the incorporation of additional data as part of the annual benchmarking process. However, the recent picture on household consumption remains largely unchanged, with the pickup in Quarter 3 2017 in part reflecting some unwinding of the sharp decline in motor vehicle expenditure in Quarter 2 2017 following changes to the Vehicle Excise Duty (VED) in April 2017. This is shown in Figure 5, which shows the contribution of transport expenditure to growth in total household consumption over recent periods. Looking over the longer term, household consumption remains relatively subdued with quarter-on-year growth slowing for the fifth consecutive quarter to be at its lowest rate since Quarter 1 (Jan to Mar) 2012 (0.9%).
Figure 5: Transport contribution to quarter-on-year growth in total household final consumption expenditure vs growth in total consumption, chained volume measure
UK, Quarter 1 (Jan to Mar) 2015 to Quarter 3 (July to Sept) 2017
Source: Office for National Statistics
Notes:
- Q1 refers to Quarter 1 (Jan to Mar), Q2 refers to Quarter 2 (April to June), Q3 refers to Quarter 3 (July to Sept), Q4 refers to Quarter 4 (Oct to Dec).
Download this chart Figure 5: Transport contribution to quarter-on-year growth in total household final consumption expenditure vs growth in total consumption, chained volume measure
Image .csv .xlsThe new estimates show a slightly sharper slowing in household consumption over the last four quarters. In the year to Quarter 3 2017, household consumption grew by 1.0%, revised down from 1.6% in the second estimate of GDP.
Today’s new data also show that foreign tourist expenditure in the UK (in volume terms) continued to strengthen, increasing by 16.0% in the year to Quarter 3 2017 – the highest quarter-on-year growth since Quarter 2 2010 (Figure 6). Meanwhile UK tourist expenditure abroad continued its downward trend, falling by 6.7% in the year to Quarter 3 2017. These movements in net tourism have coincided with the recent sterling depreciation, which has seen the sterling exchange rate index (ERI) fall by 17.5% since Quarter 3 2015.
Figure 6: Foreign tourist expenditure in the UK vs UK tourist expenditure abroad, chained volume measure, quarter-on-year growth
UK, Quarter 1 (Jan to Mar) 2012 to Quarter 3 (July to Sept) 2017
Source: Office for National Statistics
Notes:
- Q1 refers to Quarter 1 (Jan to Mar), Q2 refers to Quarter 2 (April to June), Q3 refers to Quarter 3 (July to Sept), Q4 refers to Quarter 4 (Oct to Dec).
Download this chart Figure 6: Foreign tourist expenditure in the UK vs UK tourist expenditure abroad, chained volume measure, quarter-on-year growth
Image .csv .xlsGross fixed capital formation (GFCF) increased by a revised 0.3 per cent in Quarter 3 2017 (previously 0.2%), making a zero contribution to GDP growth (to one decimal place). Growth in business investment and private dwelling investment was partially offset by falls in government and public dwellings investment. Compared with previous estimates, the latest figures show a stronger quarterly profile for GFCF in 2016, with growth revised up in each quarter by 0.1 to 0.3 percentage points. This has led to upward revisions in quarter-on-quarter-a-year-ago growth rates for GFCF in 2017, with growth in Quarter 3 2017 revised up from 1.7% to 2.4%. The largest revisions were seen in private dwellings investment, with upward revisions to quarter-on-year growth in each of the last six quarters (between 0.8 and 6.4 percentage points).
Business investment grew by 0.5% in Quarter 3 2017, an upward revision of 0.3 percentage points from the previously published estimate. This revision was primarily due to the incorporation of new data, particularly for other buildings and structures, ICT equipment and other machinery and equipment and intellectual property products. Growth in business investment slowed to 1.7% in the year to Quarter 3 2017, the lowest rate since Quarter 2 2016.
The total UK trade deficit (current prices) was 1.1% of GDP in Quarter 3 2017, revised down from the previous estimate of 1.8%. In volume terms, today’s figure for Quarter 3 2017 growth in exports shows a large upward revision of 1.5 percentage points to 0.8%. However, this was on the back of additional data on fuels, where larger revisions in the latest quarters are not unusual. The overall picture for exports remains positive, with volumes growing robustly in recent quarters to record quarter-on-year growth of 8.3% in Quarter 3 2017 –- the strongest rate since Quarter 1 2011. This is consistent with a range of external survey indicators which suggest that export growth has been supported by the past depreciation in sterling and stronger global demand. Export growth throughout 2016 and 2017 is also stronger than previously estimated, with quarter-on-year growth revised up in each of the last seven quarters by 0.7 to 2.2 percentage points. Meanwhile, growth in imports has also been revised up in most quarters throughout 2016 and 2017 – but to a lesser extent than exports.
Nôl i'r tabl cynnwys7. Growth in compensation of employees slows but remains the largest driver of nominal GDP in Quarter 3 (July to Sept) 2017
Nominal gross domestic product (GDP) grew by 0.7% in Quarter 3 (July to Sept) 2017, unrevised from the second estimate of GDP. Compensation of employees (CoE) remained the largest positive contributor to nominal GDP growth (0.4 percentage points), while total gross operating surplus (GOS) and other income made zero contribution (to one decimal place).
Growth in CoE slowed to 0.7% in Quarter 3 2017, unrevised from the previously published estimate. However, there were revisions to the quarterly path in 2016 due to annual revisions to life insurance data, as these are pensions managed by insurance companies and are recorded as employers’ social contributions within COE. The largest revision was seen in Quarter 3 2016, with growth in the quarter revised down by 0.2 percentage points.
Within GOS, there was a mixed picture with falls in profits for public corporations and private financial corporations offset by growth in profits for private non-financial corporations (PNFCs). There was a revision to total GOS growth in Quarter 3 2017, with quarterly growth revised down by 0.5 percentage points to 0.1%. This revision was again largely due to the incorporation of additional insurance data as part of the annual benchmarking process, which affected the profits of financial corporations.
Figure 7: Contributions to nominal gross domestic product growth by income component, quarter on quarter
UK, Quarter 1 (Jan to Mar) 2015 to Quarter 3 (July to Sept) 20
Source: Office for National Statistics
Notes:
Components may not sum to nominal gross domestic product due to rounding and loss of additivity in data prior to open period. The statistical discrepancy is also not displayed.
Q1 refers to Quarter 1 (Jan to Mar), Q2 refers to Quarter 2 (April to June), Q3 refers to Quarter 3 (July to Sept), Q4 refers to Quarter 4 (Oct to Dec).
Download this chart Figure 7: Contributions to nominal gross domestic product growth by income component, quarter on quarter
Image .csv .xls8. Households saving ratio falls to 5.2% in Quarter 3 (July to Sept) 2017
The Quarterly sector and financial accounts published today provide further information about the UK economy, including the households saving ratio.
Today’s new data show that the households saving ratio fell from a revised 5.6% in Quarter 2 (Apr to June) 2017 (previously 5.4%) to 5.2% in Quarter 3 (July to Sept) 2017. This is low by historical standards and has only been lower twice in the last 20 years. This partly reversed the sharp rise seen in Quarter 2 2017, when the ratio rose from 3.7% to 5.6% to record its largest quarterly increase since Quarter 2 2013. Part of the increase in taxes on income and wealth in Quarter 1 (Jan to Mar) 2017 was due to timing of the payment of taxes on self-reported income and capital gains. This effect unwound in Quarter 2 2017 with a reduction in taxes and a rise in the saving ratio. The decrease in the saving ratio in Quarter 3 2017 reflected modest growth in real household disposable income (RHDI), coupled with a pick- up in household consumption. RHDI increased by 0.2% in Quarter 3 2017 following revised growth of 2.3% in Quarter 2 2017 – stronger than previously estimated at 1.6%. Revisions to the households saving ratio have been incorporated from Quarter 1 2016 but the profile is largely unchanged.
Nôl i'r tabl cynnwys9. The UK’s current account deficit narrows to 4.5% of GDP in Quarter 3 (July to Sept) 2017
The UK’s current account deficit narrowed to 4.5% of gross domestic product (GDP) in Quarter 3 (July to Sept) 2017 from a revised 5.1% of GDP in Quarter 2 (Apr to June) 2017 (previously 4.6%). The narrowing was driven by a £1.8 billion improvement in the UK’s net investment income, specifically on foreign direct investment (FDI). There was also a narrowing of the trade deficit (£0.3 billion) and the secondary income deficit (£1.0 billion) in Quarter 3 2017. This has been financed by a net inflow of portfolio investment in Quarter 3 2017 – there was a gross inflow of £37.2 billion by foreign investors into the UK, while UK investors reduced its holdings of portfolio investment by £9.0 billion. Despite the UK being a net borrower in Quarter 3, there was an improvement in the net international investment position (NIIP). The UK’s stock of net external liabilities in Quarter 3 2017 fell from a revised £225.1 billion (11.2% of nominal GDP) at the end of Quarter 2 2017 to £207.6 billion (10.3% of nominal GDP) at the end of Quarter 3 20171.
There have been some revisions, which primarily reflect the incorporation of additional data as part of the annual benchmarking process, including the annual FDI, International Trade in Services and Financial Inquiries surveys. However, the quarterly profile is largely unchanged. The current account deficit in Quarter 2 2017 was revised from 4.6% to 5.1% of GDP, largely due to revisions in the primary income account, particularly the direct investment balance which has been revised from £3.0 billion to £0.5 billion. The NIIP at the end of Quarter 2 2017 has been revised from negative £101.2 billion to negative £225.1 billion.
Figure 8: Decomposition of current account balance, % of GDP
UK, Quarter 1 (Jan to Mar) 2015 to Quarter 3 (July to Sept) 2017
Source: Office for National Statistics
Notes:
- Components may not sum to current account balance due to rounding.
- Q1 refers to Quarter 1 (Jan to Mar), Q2 refers to Quarter 2 (April to June), Q3 refers to Quarter 3 (July to Sept), Q4 refers to Quarter 4 (Oct to Dec).
Download this chart Figure 8: Decomposition of current account balance, % of GDP
Image .csv .xlsFigure 9 shows the net lending/borrowing position for each sector in the UK and from the rest of the world. It shows that all domestic sectors, except non-profit institutions serving households (NPISH), were net borrowers in Quarter 3 2017. The households sector, which has historically been a net lender, is now a net borrower of 0.6% of GDP. Households have now held a net borrowing position for four consecutive quarters – the first time this has occurred.
Figure 9: Net lending/borrowing position by sector, % of GDP
UK, Quarter 1 (Jan to Mar) 2010 to Quarter 3 (July to Sept) 2017
Source: Office for National Statistics
Notes:
- Q1 refers to Quarter 1 (Jan to Mar), Q2 refers to Quarter 2 (April to June), Q3 refers to Quarter 3 (July to Sept), Q4 refers to Quarter 4 (Oct to Dec).
Download this chart Figure 9: Net lending/borrowing position by sector, % of GDP
Image .csv .xlsNotes for The UK’s current account deficit narrows to 4.5% of GDP in Quarter 3 (July to Sept) 2017
- The NIIP has been calculated as a ratio of the rolling four-quarter total of nominal GDP.
10. Growth in CPIH remains unchanged at 2.8% in November 2017
The 12-month growth in the Consumer Prices Index including owner occupiers’ housing costs (CPIH) remained unchanged at 2.8% in November 2017 (Figure 10). The Input Producer Prices Index (input PPI) grew by 7.3% in the 12 months to November 2017, up from 4.8% in the 12 months to October 2017. The output Producer Prices Index (output PPI) grew by 3.0% in the 12 months to November 2017, up from 2.8% in the 12 months to October 2017. Input PPI growth has been primarily affected by changes in the price of crude oil in the last year, and more recently, exchange rate effects.
Figure 10: Annual growth rate for Producer Price Index (PPI) input (left-hand side), PPI output and Consumer Prices Index including owner occupiers' housing costs (CPIH) (right-hand side)
UK, November 2008 to November 2017
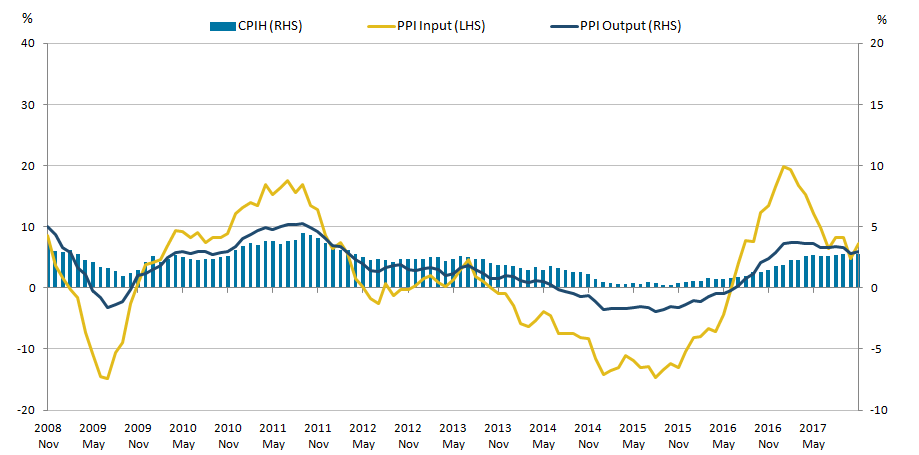
Source: Office for National Statistics
Download this image Figure 10: Annual growth rate for Producer Price Index (PPI) input (left-hand side), PPI output and Consumer Prices Index including owner occupiers' housing costs (CPIH) (right-hand side)
.png (28.4 kB) .xls (30.2 kB)
Owner occupiers’ housing costs (OOH) are the costs of housing services associated with owning, maintaining and living in one’s home. OOH and Council Tax payments are included in CPIH but are excluded from the CPI measure.
Since April 2017, OOH have been growing more slowly than CPI, resulting in the CPI 12-month rate being above that of CPIH. In November 2017, the 12-month growth rate of CPI was 3.1%; this is significant as it means that the Governor of the Bank of England is required to write a letter to the Chancellor of the Exchequer to explain why the CPI is more than 1 percentage point above the 2% inflation target, which has been set by the government. The CPIH 12-month growth rate remained at 2.8% and owner occupiers’ housing costs grew by 1.5% in November 2017.
Figure 11: 12-month growth rates in CPI, CPIH and OOH
January 2008 to November 2017
Source: Office for National Statistics
Download this chart Figure 11: 12-month growth rates in CPI, CPIH and OOH
Image .csv .xlsFigure 12 shows the long-term trend in the volume of property transactions in London and the UK as a whole, indexed to January 2005.
Property transactions for both series have followed broadly consistent trends over the majority of the period. In mid-2015, the volume of property transactions in London began to slow compared with the UK as a whole. Apart from the spike in March 2016, associated with the introduction of higher tax rates on additional properties introduced from 1 April 2016, this gap has been maintained over the period. In particular, the spike in March was followed by a sharp fall in transactions in April 2016, when the new charges came into force, however, both the spike and subsequent dip were more pronounced in London than in the UK as a whole.
Since April 2016, transaction volumes have also recovered more quickly in the UK as a whole than in London, with the gap that emerged in mid-2015 being sustained over the period since. In June 2017, the most recent month for which complete data are available, the volume of transactions in London was only 2.7% higher than in January 2005, while for the UK as a whole the volume of transactions was 44.0% higher.
Figure 12: Trends in property transactions remained lower in London than the UK as a whole since April 2016
UK and London, January 2005 to June 2017
Source: UK House Price Index, ONS calculations
Download this chart Figure 12: Trends in property transactions remained lower in London than the UK as a whole since April 2016
Image .csv .xls11. The unemployment level falls at a slower rate as the UK employment rate declines
Latest estimates from the Labour Force Survey show that the number of unemployed people fell by 26,000 to a level of 1.43 million in the three months to October 2017 compared with the previous quarter. As shown in Figure 13, this was a smaller decrease in the unemployment level compared with the three months to July 2017, when the fall was 75,000.
The UK unemployment rate declined marginally (by 0.1 percentage points) to 4.3% in the three months to October 2017 compared with the previous quarter, to a joint lowest unemployment rate since 1975. By age category, unemployment decreased for four age groups: 18 to 24, 35 to 49, 50 to 64 and 65 and over, whereas it increased for two age groups: 16 to 17 and 25 to 34.
Figure 13: Employment rate and quarterly changes in unemployment level
UK, seasonally adjusted, August to October 2001 to August to October 2017
Source: Office for National Statistics, Labour Force Survey
Download this chart Figure 13: Employment rate and quarterly changes in unemployment level
Image .csv .xlsIn the three months to October 2017, the number of people in work fell by 56,000 compared with the previous quarter to a level of 32.08 million. Despite this fall on the quarter, the level of employment is still up by 325,000 on the previous year. The UK employment rate declined by 0.2 percentage points to 75.1% in the three months to October 2017 compared with the previous quarter (Figure 13). The employment level fell by 50,000 for men and by 6,000 for women.
The total number of self-employed decreased by 41,000 in the three months to October 2017 compared with the three previous months. This is the first decrease in the self-employment level since January to March 2017. During the same period, the inactivity rate for 16- to 64- year- olds increased by 0.3 percentage points on the previous quarter.
The number of economically inactive people aged from 16 to 64 increased by 115,000 to a level of 8.86 million in the three months to October 2017 compared with the three previous months. During the same period, the inactivity rate for 16- to 64- year- olds increased by 0.3 percentage points on the previous quarter.
Nôl i'r tabl cynnwys12. Real wages fell for the eighth successive month
Nominal earnings increased by 2.5% (including bonuses) and by 2.3% (excluding bonuses) in the three months to October 2017 compared with a year earlier. However, real earnings (adjusted for inflation using the Consumer Prices Index including owner occupiers’ housing costs (CPIH)) decreased by 0.2% (including bonuses) and by 0.4% (excluding bonuses). An increase in nominal earnings (including bonuses) was driven largely by finance and business services (K to N) where the increase in bonus pay was 19.7%. This is considerably higher compared with the whole economy increase in bonus pay, which stood at 8.4% in the three months to October 2017 compared with a year earlier.
Figure 14: Regular average weekly earnings growth, real and nominal
GB, seasonally adjusted, three-month on three-month a year ago, October 2006 to October 2017
Source: Office for National Statistics, Monthly Wages and Salaries Survey
Download this chart Figure 14: Regular average weekly earnings growth, real and nominal
Image .csv .xlsThe total number of vacancies increased by 14,000 to 798,000 in the three months to November 2017 compared with the previous quarter, to an all-time record high level. During the same period, there was an increase of 11,000 vacancies across all services industries. In the three months to October 2017, the number of unemployed people per vacancy declined marginally to 1.8, from 1.9 in the previous quarter.
Labour market flows
Recent analysis examined labour market flows data using the most recent published data (July to September 2017). This analysis was motivated largely by the need to better understand more recent decreases in the employment level as well as increases in inactivity. Hence, the latest quarterly changes in gross flows between the three economic statuses covered in this section show the underlying movements that sit behind the recent fall in both employment and unemployment as well as the increase in inactivity.
In the three months to September 2017, the UK employment level decreased (by 14,000) for the first time since August to October 2016 and in the three months to October it decreased further by 56,000. Prior to this, both the employment level and rate had been following an upward trend; reaching the highest level and rate (32.1 million and 75.3% respectively) in the three months to July 2017, since comparable records began. A similar trend applies to economic inactivity indicators. The inactivity rate followed a downward trend reaching a record low (21.2%) in the three months to July but it increased to 21.5% in the latest period (August to October 2017). Hence, these recent changes have prompted further analysis of labour market flows.
The number of people who moved in the opposite direction (from unemployment to employment), fell by 28,000 to 411,000. This indicates that more workers became unemployed, while fewer unemployed people found employment during the latest period (July to September 2017) when compared with the previous quarter. This trend coincides with the quarterly decrease in employment in the three months to September 2017, the first since August to October 2016.
Figure 15: Quarterly change in gross flows for UK labour market
UK, seasonally adjusted, April to June 2017 to July to September 2017
Source: Office for National Statistics, Labour Force Survey
Download this chart Figure 15: Quarterly change in gross flows for UK labour market
Image .csv .xlsFurthermore, the number of people who moved from inactivity to employment decreased by 22,000 to 518,000 in the three months to September 2017 compared with the previous quarter, whereas the gross flow from inactivity to unemployment fell by 41,000 to 356,000. The latest labour market flows data indicate that the number of people joining the labour force from inactivity decreased (this applies to movements from inactivity to both employment and unemployment) as shown in Figure 15. Meanwhile, the number of people leaving the labour force (movements from employment and unemployment to inactivity) increased (by 38,000 and 23,000 respectively).
Figure 16 depicts the net outflows from employment. The total net outflow from employment is calculated by subtracting the total inflow to employment (from unemployment and inactivity) from the total outflow from employment (to unemployment and inactivity). Hence, if the net outflow from employment is positive this means that more people are leaving employment pool compared with those joining this pool. Similarly, comparatively larger negative values for the total net outflow show that more people are joining the employment pool compared with those leaving this pool.
The net outflow from employment is generally negative and follows a procyclical trend indicating that inflows to employment are generally greater than outflows from employment, except during economic downturns when the reverse trend is expected. Figure 16 shows that the net outflow from employment reached a peak of 272,000 during April to June 2009, following the economic downturn, but it has remained negative since October to December 2011.
Figure 16: Net outflows from employment, to unemployment
UK, seasonally adjusted, July to September 2007 to July to September 2017
Source: Office for National Statistics, Labour Force Survey
Download this chart Figure 16: Net outflows from employment, to unemployment
Image .csv .xlsHowever, during the latest available period, the net outflow from employment increased considerably, (by 137,000), compared with the previous quarter. This was partly due to a net outflow from employment to inactivity (of 54,000), which increased by 60,000 and turned positive in the three months to September 2017 from negative (6,000), in the three months to June 2017. During the latest available period, the net outflow from employment to unemployment increased by 77,000 (to a negative 99,000) compared with the previous quarter. It should be noted that the average net outflow between 2010 and 2017 from employment to unemployment was negative (164,000). This implies that a rise in net outflow from employment to unemployment during the latest available quarter was the main driver of the overall increase in the net outflow from employment.
Notably, the net outflow from employment (negative 44,000), during July to September 2017 represents the largest net outflow from employment since July to September 2011. In line with this, during the latest available period (July to September 2017) the hazard rate for remaining in employment declined by 0.4 percentage points from 97.3% to 96.9%. Hazard rates represent the relative likelihood of someone changing their status or remaining in the same category.
Nôl i'r tabl cynnwys