Cynnwys
- Authors and acknowledgements
- Summary
- Background
- Theory of double-deflation and supply and use tables
- Implementing double-deflation within a supply and use framework
- Case studies: derived estimates of double deflation
- Conclusion and next steps
- Contact
- Annex 1: Further notes on the methods used in these case studies
- Annex 2: Single-deflation bias
2. Summary
In May 2017, we updated users on our progress in implementing double-deflation, a recommendation of the Independent Review of Economic Statistics (Bean Review). This article sets out the principles of double-deflation as a methodology for deriving estimates of gross value added (GVA) and gross domestic product (GDP) in volume terms. Using one approach to double-deflation (the H-approach), the article demonstrates how a revision to current single-deflated estimates may arise.
This is the first in a series of articles that will explore the impact of double-deflation methodology in terms of potential revisions to published outputs. Data used within this paper are presented as experimental and users should interpret results with caution as outputs will change as the methodology is further developed and refined. All estimates in this article should be viewed as being “experimental” and have not been designated as National Statistics.
Data have been estimated taking a number of pragmatic steps to overcome gaps in series and the current absence of “real” data. This includes modelling series or making conceptual adjustments to balance data to national accounts identities. While this is clearly a trade-off in terms of quality, the case studies in this article provide an opportunity to explore methodology and working assumptions, as well as engage with users whilst double-deflation is developed for integration into the UK National Accounts.
Nôl i'r tabl cynnwys3. Background
This article describes concepts related to different prices such as current price, constant price and previous year’s price. Table 1 contains the definitions of the prices used to familiarise users with these terms.
Table 1: Price definitions
| Term | Definition | |
| Current price (CP) | These series include the effects of inflation | |
| Constant price (KP) | These series have the effects of inflation removed by holding prices throughout the series at the level in a chosen base year (also known as “real terms” series) | |
| Previous year’s price (PYP) | The series derived from multiplying the volume series in the current period, by the price of the previous year | |
| Chained volume measures (CVM) | These time series have the effects of inflation removed by considering changes in quantity between consecutive periods, holding prices from previous periods constant | |
| Source: Office for National Statistics | ||
Download this table Table 1: Price definitions
.xls (27.6 kB)As part of the production of the UK National Accounts, supply and use tables (SUTs) are used to set the annual current price level of gross domestic product (GDP) linking industry outputs, inputs and gross value added (GVA). In the future these tables will also be compiled in previous year’s prices (PYP) as a requirement of the European System of Accounts 2010 (ESA 2010). Although we do not normally publish SUTs in PYPs, we will explore with users if there is demand for these data to be published. This Eurostat requirement states that member states of the EU are to provide SUTs in PYPs for the year 2015 in 2018 using a matrix of 64 products by 64 industries (A64) and annually thereafter.
Linked to this ESA 2010 requirement, we will implement double-deflation methodology for deriving GVA in volume terms in line with the recommended approach in the UN System of National Accounts 2008 (SNA 2008). This objective is supported by recommendations of the National Statistics Quality Review of National Accounts and Balance of Payments (NSQR) and the Bean Review, and will be implemented in 2020.
GVA is the difference between output and intermediate consumption, measuring the contribution to the economy of each individual producer, industry or institutional sector in the UK. In simple terms, double-deflated GVA is the difference between deflated current price output and deflated current price intermediate consumption. This is shown in the following equations:
Equation 1:
Equation 2:
Where PO and PIC represent output and intermediate consumption prices respectively, QIC and QO represent real intermediate consumption and output. When multiplied by their respective price terms they represent nominal values. GVADD and GVASD represent the double- and single-deflated estimates of GVA respectively.
Using the above previous equations as a starting point, we can derive the difference between single and double deflation as a function of nominal, current price, intermediate consumption and the prices of intermediate consumption and output. For more detail regarding the derivation of this difference, see Annex 2.
Double-deflation is already used by many National Statistics Offices (NSOs) including, France, the Netherlands and Canada; whilst other NSOs, along with the UK, still follow a single-deflation approach. It is important to note that although double-deflation is considered best practice (under the SNA 2008), its use does not necessarily mean one country’s statistics are more accurate than another's.
In terms of comparability across countries, there are many other factors to consider in this context such as the quality of the underlying data in current prices, the quality of price indices for deflators, the appropriateness of deflators used and the level of detail for industries and products. To address these issues, we have established an ongoing project to implement recommendations for deflator improvements and develop further the deflation strategy as part of continuous improvement in this area.
Implementing double-deflation should be viewed as one part of a package of improvements to UK Economic Statistics. It should be noted that improvements to the data underpinning the SUTs are also likely to generate revisions. The Economic Statistics Transformation Programme will deliver improved sources and methods; notably the use of turnover data from administrative VAT returns will improve estimates of output, the purchases survey will improve estimates of intermediate consumption and a new survey of the services sector will provide improved estimates of output in this area.
The application of double-deflation within the UK National Accounts should and will affect volume growth rates of GDP and GVA for existing balanced years (those years that have been balanced using SUTs) due to differences in methods and the use of different price – that is, the move from single-deflation. Any differences will be assessed and impacts explained. When implemented, the approach for double-deflation will be aligned to a best practice compilation approach in the forthcoming UN Handbook on Supply, Use and Input-Output Tables with Extensions and Applications (Global Consultation in the summer of 2017 and publication by the end of 2017).
Nôl i'r tabl cynnwys4. Theory of double-deflation and supply and use tables
Double-deflation is considered the best practice methodology for deriving volume estimates of gross value added (GVA) and should take place within a supply and use table (SUT) framework1. Double-deflation separately deflates output and intermediate consumption to arrive at the production measure of GVA in chained volume measures (CVMs). CVMs are time series that measure gross domestic product (GDP) in real terms (that is, excluding price effects).
A balancing approach is used to address the statistical differences between the three measures of GDP (income, output and expenditure) that exist in the short term and uses detailed indicators, which only become available after 1 or 2 years. In annual SUT balancing, the three approaches to measuring GDP are fully reconciled using a matrix of industries and products. Following this reconciliation exercise, the statistical discrepancy (difference) for the annual estimates is removed and the short-term estimates aligned. This ensures that when double-deflation is applied using annual SUTs, there is coherence between the three measures of GDP in volume terms.
Notes for: Theory of double-deflation and supply and use tables
- For more information see the Eurostat Manual of Supply, Use and Input-Output Tables.
5. Implementing double-deflation within a supply and use framework
Supply and use tables (SUTs) are estimated at purchasers’ prices. The supply of products at purchasers’ price is constructed using domestic output at basic prices, imports, distributors’ trading margins (DTMs) and taxes less subsidies on products. The supply table is presented as these different components whereas the use of products side shows intermediate use and final expenditure components at purchaser’s prices (Figure 1).
Figure 1: Supply and use tables

Source: Office for National Statistics
Download this image Figure 1: Supply and use tables
.png (75.0 kB)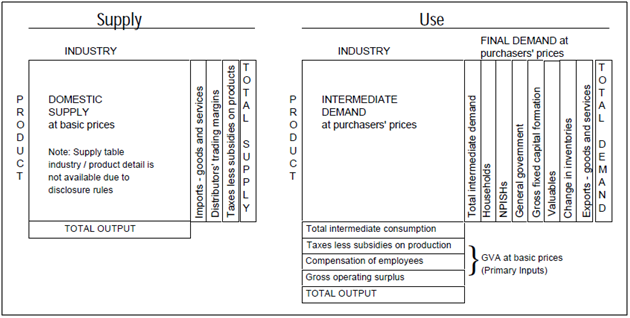
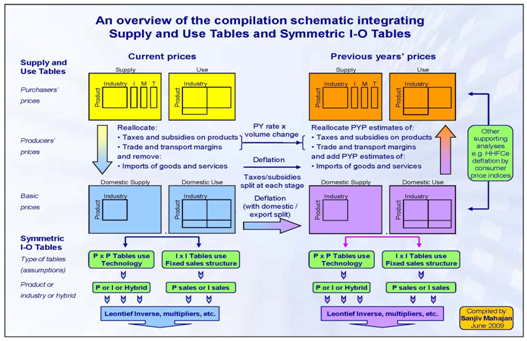
To estimate double-deflated gross value added (GVA) the "H-approach" is considered best practice and outlined in Figure 2:
Figure 2: 'H-Approach'
Source: Office for National Statistics
Download this image Figure 2: 'H-Approach'
.png (254.0 kB)
For the purpose of deflating SUTs and implementing double-deflation we are only concerned with the top half of the diagram which is the compilation of PYP SUTs from balanced current price SUTs. The "H-approach" is the recommended approach to double-deflation within the forthcoming UN Handbook on Supply, Use and Input-Output Tables with Extensions and Applications. The key principle is that double-deflation occurs within a SUT framework, ensuring that all three estimates from the three approaches of gross domestic product (GDP) are equal.
When deflation takes place within a SUT framework, we begin with a balance in current prices and end with a balance in previous years’ prices which can then be chain-linked into a chained volume measure (CVM) for analytical purposes. Deflation occurs by product and is relevant to the components of the Supply Table that make up the purchasers’ price. The use table is split into matrices for domestic output, imports, margins and taxes less subsidies, and deflated separately before re-aggregation. Both the supply and use side are therefore deflated on the same price basis, that is, the amounts received by the seller is the same as the amounts paid by the purchaser. This is shown in Figure 3.
Figure 3: Deflation of supply and use tables

Source: Office for National Statistics
Download this image Figure 3: Deflation of supply and use tables
.png (253.2 kB)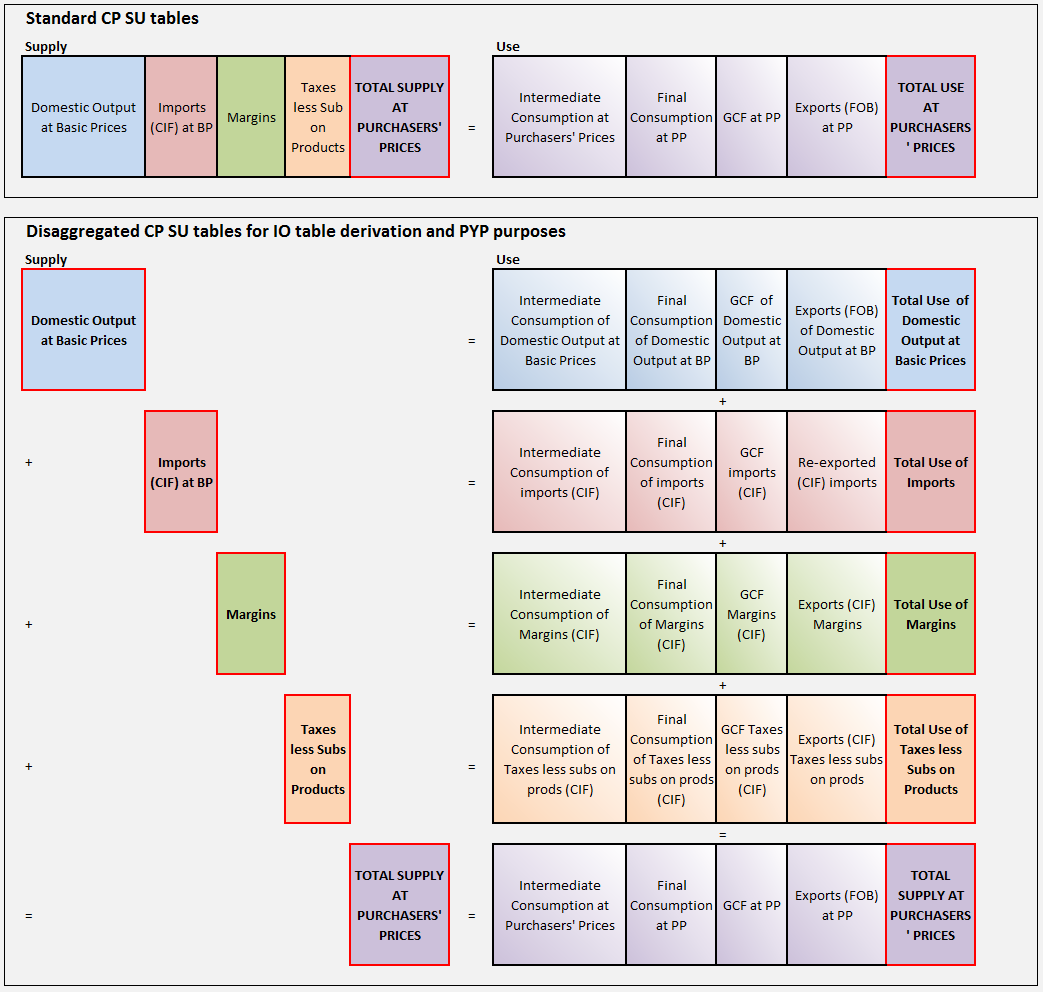
The process commences with balanced SUTs in current prices1. The product row on the supply and use sides, where the use is split up into its component parts (output, imports, distributors’ trading margins (DTMs), VAT and other taxes less subsidies on products) is then deflated to give a balance in volume terms.
In practice, a deflator, X, on the supply side is used to deflate the entirety of that product row within domestic output, across all industries. Deflator X is then used to deflate that product on the use side of the use table at basic prices. This may be done at producers’ prices if prices for deflation are not available at basic prices. Information regarding the compilation of the data can be found in Annex 1.
For the use components of DTMs, VAT and taxes less subsidies, it is not possible to estimate an explicit price and volume component. For the supply and use components (for which we can generate estimates in volume terms) it is feasible to generate these tables in previous year’s prices (PYP) using the following formula:
Equation 3:
In this equation, i, p and t represent industry, product and time period (year) respectively. KP represents constant price volume estimates – the current price estimate divided by deflator (P), which can be calculated using the following equation:
Equation 4:
The method for calculating PYPs for the components that we cannot derive constant price estimates for can be found in Annex 1.
The PYP estimates are then summed by industry and chain-linked to create annual estimates by industry directly comparable to values of other years in the same period, combining the values into a single time series. Estimates presented within this paper are done so in line with national accounts chain-linking methodology. CVMs are calculated using the following formula:
Equation 5:
Given the last year of balanced data within the time series is 2014, 2013 is treated as the base year. For all years preceding the base year, the CVM estimates are obtained using the previous formula (Equation 5). For years exceeding the base year, CVM is equal to PYP and for the base year CVM is equal to CP.
Notes for: Implementing double-deflation within a supply and use framework
- The current price is the actual or estimated monetary value expressed in the terms of the prices of that period. The value can be expressed as: CP=KP*Deflator, where KP represents constant price.
6. Case studies: derived estimates of double deflation
This section presents case studies for a selection of industries within the economy using experimental data. The purpose of this exercise is to illustrate to users the potential differences in chained volume measure (CVM) estimates of gross value added (GVA) that may arise as a result of applying the H-approach to double-deflation.
Whilst there are three approaches to measuring gross domestic product (GDP), these estimates focus on the production measure of GVA for the selected industries. As already explained in this article, these statistics are experimental and a number of quality trade-offs have been made to derive the required data. The case studies here will demonstrate how the mechanics of the H-approach to double-deflation will potentially impact on estimates of real GVA. Users should note that these do not replace published low-level aggregates of GVA, which are separately designated as National Statistics. No conclusion can or should be drawn on revisions to the whole economy.
Derived data
The H-approach to double-deflation follows the principle of deflating on the same price basis for supply and use. To apply this principle, first it was necessary to deconstruct the use table from purchasers’ price to basic price domestic output, imports, distributors’ trading margins (DTMs) and taxes less subsidies. This creates a matrix for each component of the purchasers’ price that sum to the total use for each cell. Once deflated separately, these components can be re-aggregated to the purchasers’ price.
Valuation matrices have previously been published for 2010 and 2013. For 2013, the data for all use components are directly drawn from the 2013 valuation matrices. For years 2012 to 2014, data for imports, output and taxes less subsidies are generated based on Blue Book 2016 consisted supply totals and 2013 proportions of total use for each cell.
For years 2007 to 2011, data for the aforementioned matrices are compiled based on Blue Book 2016 supply totals proportioned out using the 2010 use pattern. Data for DTMs were compiled using existing Office for National Statistics (ONS) data balanced to meet accounting principles. VAT data are compiled using VAT rates and current price use table patterns combined to best split VAT for each product. More detail regarding the composition and derivation of the final data set is contained within Annex 1.
Over the period sampled, the share of total intermediate consumption by each use component is relatively stable. Output and imports make up the largest share of total intermediate consumption with average shares of 74.5% and 21.6% respectively. The smaller component matrices have an average share of 1.8% (VAT), 2.1% (taxes less subsidies) and no value for DTMs given the accounting constraint that they sum to zero by industry and total. The DTMs sum to zero because it simply reallocates the supply of distribution services to the products being distributed.
Following the steps made to overcome gaps in the data, the resultant dataset is compiled of fully populated supply and use (with component matrices) at a 112 product by 112 industry level.
Case studies
Case study outputs are presented in this section for two service industries and one goods industry. Goods are defined as tangible products, for example, the purchase of metal products. This is opposed to services, which are non-tangible and provided by an appropriate agent, for example, a bookmaker facilitating a betting service. The case studies present existing single deflated GVA and how these differ following the adoption of the alternative methodology of double-deflation via the H-approach.
Case study 1: Industry 25 (fabricated metal products excluding machinery and equipment)
The industry is focused on the manufacture of pure metal products (such as parts, containers and structures), usually with a static immovable function. The goods produced range from metal frameworks to the manufacture of tanks and containers of metal. Industry 25 contributed 1.0% to total GVA in 2014 (based on current prices).
Levels of GVA in this industry are lower with double-deflation methodology in all years aside from 2013 (the base year whereby current price and CVMs are equal) and 2014. The largest difference in GVA levels is in 2010 where single-deflation GVA is 16.6% greater than the double-deflation estimate. The smallest difference is in 2014 where double-deflation estimates are 3.1% larger than the single-deflation estimates.
Figure 4: Industry 25 current price, single-deflated and double-deflated gross value added, UK, 2007 to 2014
Source: Office for National Statistics
Download this chart Figure 4: Industry 25 current price, single-deflated and double-deflated gross value added, UK, 2007 to 2014
Image .csv .xlsFor the period covering the economic downturn (2008 to 2009), there are noticeable differences in the growth of this industry. From 2007 to 2008, the contraction is smaller when using the double-deflated estimate (negative 0.3% compared with the single-deflation estimate of negative 4.5%) but conversely for 2008 to 2009, double-deflation shows a greater contraction in GVA (single-deflation GVA growth estimated at negative 17.9% whereas double-deflation growth is estimated at negative 27.0%). There is one year where the signal changes; the estimate for 2013 shows different directions of growth using single-deflation (negative 3.3%) compared with double-deflation (5.8%).
Figure 5: Industry 25 gross value added growth rates, UK, 2008 to 2014
Source: Office for National Statistics
Download this chart Figure 5: Industry 25 gross value added growth rates, UK, 2008 to 2014
Image .csv .xlsCase study 2: Industry 59 (motion picture, video and TV programme production, sound recording and music publishing activities)
This industry is a service industry that produces theatrical and non-theatrical motion pictures whether on film, video tape or disc for direct projection in theatres or for broadcasting on television. It also includes supporting activities such as film editing, cutting and dubbing.This industry makes up 0.6% of total GVA in 2014 current prices.
Double-deflated estimated levels of GVA are higher than single-deflated estimates with the exception of 2014, where double-deflated estimated levels are 1.3% lower. The largest difference is in 2010 where double-deflation levels are 10.1% higher. In contrast to case study 1, levels at the start of the series, 2007, are much closer.
Figure 6: Industry 59 current price, single-deflated and double-deflated gross value added, UK, 2007 to 2014
Source: Office for National Statistics
Download this chart Figure 6: Industry 59 current price, single-deflated and double-deflated gross value added, UK, 2007 to 2014
Image .csv .xlsComparing the growths for 2008 to 2014, the picture for this industry is mixed. Only in 2008 is the direction of growth different. However, in all years there are noticeable differences in the size of the growth, particularly in 2012 to 2013 where the growth rates are 6.3% for single-deflation and 0.7% for double-deflation.
Figure 7: Industry 59 gross value added growth rates, UK , 2008 to 2014
Source: Office for National Statistics
Download this chart Figure 7: Industry 59 gross value added growth rates, UK , 2008 to 2014
Image .csv .xlsCase study 3: Industry 92 (gambling and betting activities)
This industry includes the operation of gambling facilities such as casinos, bingo halls and video gaming terminals, and the provision of gambling services, such as lotteries and off-track betting. The industry makes up 0.6% of 2014 total current price GVA.
Single-deflated and double-deflated estimates of GVA for industry 92 follow a close pattern over the period 2007 to 2014, with an average level absolute difference of 3.0%. The largest absolute difference is in 2010 where single-deflated estimates are 5.0% higher.
Figure 8: Industry 92 current price, single-deflated and double-deflated gross value added, UK, 2007 to 2014
Source: Office for National Statistics
Download this chart Figure 8: Industry 92 current price, single-deflated and double-deflated gross value added, UK, 2007 to 2014
Image .csv .xlsThe experimental data derived show that for the years 2007 to 2014, double-deflation methodology gives a lower level of GVA CVM compared with single-deflated estimates. The previous case study, however, shows that double-deflated estimates are higher – this is a useful comparison in demonstrating that the direction of bias in single-deflation is not uniform, that is, single-deflation does not mean that estimates will always be higher or lower than with double-deflation. The ambiguity of the difference between single- and double-deflation is demonstrated within a recent paper by the International Monetary Fund (IMF). This article presents a similar derivation of the bias in Annex 2.
The direction of growth is the same for all years aside from 2014 where it is positive for single-deflation. The size of growth is different in all years. Both methods show negative growth in 2009, 2010 and 2013.
Figure 9: Industry 92 gross value added growth rates, UK, 2008 to 2014
Source: Office for National Statistics
Download this chart Figure 9: Industry 92 gross value added growth rates, UK, 2008 to 2014
Image .csv .xls7. Conclusion and next steps
The three industry case studies presented in this article show how moving from single to double-deflation methodology can result in higher or lower levels of activity and stronger or weaker growth rates in the chained volume measures (CVMs). The results within this article focus only on the differences between the current production measure and initial experimental double-deflation estimates. Future analysis will explore the impact on the expenditure measure of gross domestic product (GDP).
Whilst users are advised to treat these estimates with caution, applying double-deflation using the H-approach proves to be a useful exercise in understanding how estimates may be revised. The estimates presented in this article will differ from those derived when double-deflation is fully implemented into a production environment and the data are confronted within a supply and use tables balancing framework.
Alternative approaches to double-deflation could similarly yield yet further differences. The approach followed within this article closely replicates the H-approach by deflating components on the supply and use side at the same price basis. If output and intermediate consumption were deflated on different price bases, then this would provide a different result to not only single-deflated existing estimates but also to the H-approach double-deflated estimates. This would be true for both growth and levels. There is further work is to be done on the best way of ensuring consistency between the sectoral and aggregate figures.
At this stage in development, we have not finalised estimates from the double-deflation approach and research continues into the detailed methodology. We recognise that there is a user demand to understand the impact of double-deflation and the potential size of revisions to estimates of gross value added (GVA) and GDP. The case studies contained within this and future articles provide an opportunity to engage with users and we will publish further methods articles as the work continues.
Nôl i'r tabl cynnwys8. Contact
The Supply and Use Development Team is keen to hear your views and take any further questions from our users. We can be contacted via email at sut@ons.gov.uk.
Nôl i'r tabl cynnwys9. Annex 1: Further notes on the methods used in these case studies
Valuation matrices
Valuation matrices are publically available for the years 2010 and 2013 as they are derived in the production of input-output analytical tables. However, they are also required to implement the H-approach and in the absence of data, for years other than 2010 and 2013, they have been modelled as part of the case studies in this article to cover all years in the series and are consistent with supply and use levels in current prices contained within Blue Book 2016. The valuation matrices are not designated as official or National Statistics.
The data available for 2010 and 2013 have provided the basis for constructing experimental valuation matrices, consistent with Blue Book 2016 (BB16), for domestic output, imports and taxes less subsidies (TLS). For VAT and distributors’ trading margins (DTMs) other methods have been used to compile the experimental valuation matrices for most years. Table 2 shows how the valuation matrices have been formed for each year.
Table 2: Modelled data derivation, UK, 2007 to 2014
| Year | Domestic output | Imports | Taxes less subsidies (TLS) | VAT | Distributors' trading margins (DTM) | |||||
| 2007 | BB16 domestic output product totals split by corresponding products industry distribution in the 2010 domestic output valuation table | BB16 imports product totals split by corresponding products industry distribution in the 2010 imports valuation table | BB16 TLS product totals split by corresponding products industry distribution in the 2010 TLS valuation table | Known industry VAT rates and current price use table patterns combined to best split VAT for each product | Current underlying ONS DTM data, balanced to meet DTM accounting principles, were used | |||||
| 2008 | ||||||||||
| 2009 | ||||||||||
| 2010 | ||||||||||
| 2011 | ||||||||||
| 2012 | BB16 domestic output product totals split by corresponding products industry distribution in the 2013 domestic output valuation table | BB16 imports product totals split by corresponding products industry distribution in the 2013 imports valuation table | BB16 imports product totals split by corresponding products industry distribution in the 2013 imports valuation table | |||||||
| 2013 | 2013 domestic output valuation table used | 2013 imports valuation table used | 2013 TLS valuation table used | 2013 VAT valuation table used | 2013 DTM valuation table used | |||||
| 2014 | Same domestic output method as 2012 | Same imports method as 2012 | Same TLS method as 2012 | Same VAT method as 2007 - 2012 | Same DTM method as 2007 - 2012 | |||||
| Source: Office for National Statistics | ||||||||||
Download this table Table 2: Modelled data derivation, UK, 2007 to 2014
.xls (28.2 kB)The valuation matrices were then balanced using optimisation software so that each cell sums across the valuation matrices to the total use for that cell, and also so that the total for each product and supply component is equal to Blue Book 2016 supply value. The optimisation algorithm is set up to achieve this by making minimum adjustments to each cell with adjustments weighted in proportion to the cell value.
Deflators
Domestic output has been deflated using the existing product deflators for output. It should be noted that these are the unadjusted deflators and so will not reflect any adjustments made to current price or volume estimates in the production process. This, to an extent, limits our ability to compare single- and double-deflated estimates based on the differences between the output and intermediate consumption deflators. Product deflators for imports of goods and imports of services have been weighted together using current price data to produce an overall imports deflator for each product.
Price data are not collected for DTMs, taxes less subsidies or VAT and so there is not a suitable deflator for these valuation matrices. To create previous year’s prices (PYPs) for these, the rate of the previous year in current price is calculated and then applied to PYP estimates for the current year as defined by the following equations:
Equation 6:
Equation 7:
Equation 8:
Where DTM, TLS, VAT, OUT and IMP represent distributors’ trading margins, taxes less subsidies, value added tax, domestic output and imports respectively, CP and PYP represent current price and previous years price, i represents each industry and j represents each product in the valuation matrix.
The previous equations (Equations 6, 7 and 8) show steps made to estimate DTMs, taxes less subsidies and VAT on a basis directly comparable with PYPs, overcoming the lack of price deflators for these respective components.
Nôl i'r tabl cynnwys10. Annex 2: Single-deflation bias
The resultant bias from using a single-deflated estimate for gross value added (GVA) is derived within a recent paper by the International Monetary Fund. The direction and magnitude of the bias is ambiguous and depends on the relationship between output and intermediate consumption deflators.
The following equations (Equations 9 and 10) define both single-deflation and double-deflation before taking differences to show the source of bias in single-deflation estimates:
Equation 9:
Equation 10:
In Equations 9 and 10, GVASD represents single-deflated gross value added and GVADD represents double- deflated gross value added. QO and QIC represent real output and intermediate consumption respectively. Where PIC is the deflator for intermediate consumption and PO represents the same for output.
Equation 9 gives the relationship for GVA using double-deflated methods and Equation 10 gives the relationship for single-deflated GVA, which deflates both output and intermediate consumption using the same output price index.
If we take Equation 9 from Equation 10 as below we get the following result:
Equation 11:
Equation 12:
Where PIC QIC = IC (nominal IC). Therefore Equation 12 can be simplified to:
Equation 13:
Multiplying and dividing by PIC gives the difference as follows:
Equation 14:
Equation 14 shows that single-deflation value added is equal to double-deflated value added plus what can be interpreted as a bias term. Simplifying further we can define the bias as in Equation 15, which is consistent with the recent study by the IMF:
Equation 15:
When the output and intermediate consumption deflators are equal there will be no difference between the single-deflated and double-deflated GVA. However, when the price of intermediate consumption is greater (smaller) than the price of output then the single-deflated estimate of GVA will be upward (downward) biased as compared with that of double-deflated GVA.
If the prices of intermediate consumption and output are not equal, single-deflated estimates will result in biased estimates of GVA. The source of this bias is the use of a single deflator for both output and intermediate consumption, based on single-deflation implicitly assuming that output and input prices move in similar direction with similar magnitude.
Nôl i'r tabl cynnwys