2. Summary
In 2014, UK Blue Book 2013-consistent input-output analytical tables (IOATs) with the reference year 2010 were published along with a supporting article detailing the methodology behind their construction. IOATs for the reference year 2013, consistent with the UK Blue Book 2016, were published on 9 March 2017. In this edition of the tables we have further disaggregated exports to show EU and non-EU exports of goods and services. A number of new analyses have also been published including full time equivalent (FTE) multipliers for each industry and a sector breakdown of total imports generated by final demand.
This article describes the theory and method behind the construction of these additional tables. The methodology for the other tables has not changed and so will not be revisited in detail in this publication. An overview of the 2014 article, which details how the supply and use tables are used to create a Leontief inverse matrix and associated effect and multiplier values, is provided in the following section. The report concludes with some examples illustrating how the IOATs can be used.
Nôl i'r tabl cynnwys3. Overview of the construction of the input-output analytical tables (IOATs)
The input-output analytical tables (IOATs) are derived from the Supply and use tables. The supply and use (SU) tables are extended to split output into the market sector, the government sector and the non-profit institutions serving households (NPISH) sector. These tables are then converted into basic prices by removing imports, taxes and subsidies on products, and distributor trading margins. It is these tables that are then transformed into product-by-product tables.
To make the transformation to the data we choose a “product technology” or “industry technology” assumption for each product and industry combination. Product technology assumes products have the same inputs, regardless of the classification of the producing industry, whereas industry technology assumes all products produced by an industry have the same inputs, regardless of the product classification.
The choice of technology assumption is stored in a “hybrid technology” matrix. The advantage of using this approach over using a purely “product technology” method is that nonsensical negative values do not appear, and the advantage over using purely “industry technology” is that the values are more accurate since most combinations are better modelled with “product technology”. Once the “hybrid technology” matrix has been set a transformation matrix is calculated to complete the transformation of the system into product-by-product matrices.
The transformed tables are used to calculate input requirements per product and this forms the matrix of coefficients, which is used to find the Leontief inverse. By using the Leontief inverse the effects of changes to final demand can be investigated and this is discussed further in later sections of this article.
More information on these processes can be found in the 2014 IOAT article.
Nôl i'r tabl cynnwys4. Industry-by-industry derivations
In addition to the outputs produced in the 2014 publication, we have also provided Full time equivalent (FTE) effects and multipliers by industry alongside the 2013 input-output analytical tables (IOATs). These are produced in a similar way to the product–by-product tables, but slightly different assumptions are used. As with the product-by-product case, assumptions need to be made in order to convert the tables from product-by-industry tables. The assumption used in this method is that the use or sales structure of a product is independent of the industry in which it is produced. These assumptions allow a transformation into industry-by-industry using the transformation matrix:
Where V denotes the extended supply matrix and g denotes the diagonal matrix with the entries giving the total industry output.
T premultiplies a vector of product demand or output to give industry output or demand for the output of an industry. T transforms the use matrix and final demand matrix into the industry-by-industry input-output table and final demand matrix respectively.
The industry-by-industry matrix of coefficients is defined by the equation:
Where U is the extended use matrix. This acts on the transformed product demand, to give the intermediate consumption in units of industry output.
The Leontief inverse is calculated as in the product-by-product case and can be used in the same way. It should be noted that the construction of T in this case does not use the hybrid technology matrix so the model is not subject to the product or industry technology assumptions.
The FTE effects produced from the Leontief inverse estimate the number of FTE units created by a £1 million increase in demand for the output of an industry.
Nôl i'r tabl cynnwys5. Interpreting the tables
This section aims to answer some frequently asked questions about the input-output analytical tables (IOATs), and better illustrates some of the often misunderstood concepts with examples of analyses drawn from the Blue Book 2016 consistent IOATs for reference year 2013. A summary of each of the tables can be found in Appendix 1.
5.1 How do I read the product-by-product tables?
The extended domestic use table can be seen as three separate tables, as shown in Table 1.
Table 1: Domestic use table

Source: Office for National Statistics
Download this image Table 1: Domestic use table
.png (10.5 kB)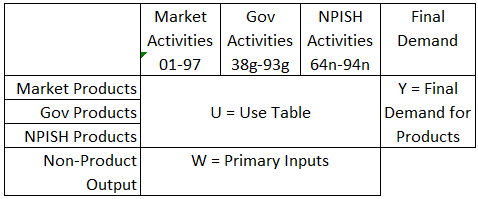
The entries of the product-by-product tables show the required value of the row for the demand of the column.
Table 2 presents the domestic use table, which has been rolled up into three products: dairy, bakery, and other products. Y and W have also been aggregated to save space.
Table 2: Dairy and bakery domestic use table
| 10.5 | 10.7 | |||||||||||||||
| Dairy products | Bakery and farinaceous products | Other Products | Total Intermediate Demand | Households | Other Final Demand Components | Total Demand for Products at Basic Prices | ||||||||||
|---|---|---|---|---|---|---|---|---|---|---|---|---|---|---|---|---|
| 10.5 | Dairy products | 747 | 295 | 2237 | 3279 | 3241 | 1 170 | 7690 | ||||||||
| 10.7 | Bakery and farinaceous products | 5 | 70 | 3588 | 3663 | 5467 | 795 | 9925 | ||||||||
| Other Products | 4940 | 4803 | 1072182 | 1081925 | 840923 | 1100794 | 3023642 | |||||||||
| Total Consumption | 5692 | 5168 | 1078007 | 1088867 | 849631 | 1102759 | 3041257 | |||||||||
| Imports of goods and services | 913 | 834 | 335412 | 337159 | 135848 | 83873 | 556880 | |||||||||
| Other Primary Inputs | 1085 | 3923 | 1610224 | 1615231 | 98532 | 25800 | 1739563 | |||||||||
| Total Output | 7690 | 9925 | 3023642 | 3041257 | 1084011 | 1212432 | 5337700 | |||||||||
| Source: Office for National Statistics | ||||||||||||||||
Download this table Table 2: Dairy and bakery domestic use table
.xls (20.0 kB)Table 2 shows that production of dairy products uses £747 million of domestically produced dairy products; this could be milk used to make cheese for example. Use of domestically produced bakery products to make dairy products is low at £5 million, and use of domestically produced dairy products to make bakery products is £295 million (this would include milk and butter used in the production of breads and pastries).
The right-hand side of Table 2 shows final demand. For example, £3,241 million of domestically produced dairy products were purchased by households. The lower part of Table 2 shows primary input content, including imports. The total production of bakery products in the UK required £834 million of imported goods and services.
The product-by-product imports use table can be viewed in a similar way with the values showing use of imported products instead of domestically produced products.
5.2 What do the matrix of coefficients and Leontief inverse matrices represent?
The matrix of coefficients is the matrix of inputs needed per unit of production. The matrix consists of two parts; the top is the square matrix of domestic consumption requirements, and the bottom is the matrix of primary input requirements.
The matrix of coefficients premultiplies final demand vectors to give the vector of inputs needed to directly satisfy the intermediate consumption. It is important to note that this does not account for the indirect intermediate consumption required by the direct intermediate consumption.
We return to the dairy and bakery example in Table 3.
Table 3: Dairy and bakery matrix of coefficients (partial)
| 10.5 | 10.7 | ||||
| Dairy products | Bakery and farinaceous products | ||||
|---|---|---|---|---|---|
| 10.5 | Dairy products | 0.097 | 0.03 | ||
| 10.7 | Bakery and farinaceous products | 0.001 | 0.007 | ||
| Imports of goods and services | 0.119 | 0.084 | |||
| Taxes less subsidies on products | 0 | 0.007 | |||
| Taxes less subsidies on production | 0.002 | 0.005 | |||
| Compensation of employees | 0.093 | 0.308 | |||
| Gross operating surplus | 0.046 | 0.075 | |||
| Source: Office for National Statistics | |||||
Download this table Table 3: Dairy and bakery matrix of coefficients (partial)
.xls (18.4 kB)Table 3 is the matrix of coefficients. To save space only dairy products, bakery products and primary inputs are displayed. The value of inputs required to directly satisfy a demand can be found by multiplying the matrix of coefficients by the demand vector. In the reduced example shown in Table 3, a final demand increase of zero units of the first product (dairy products) and one unit of the second product (bakery and farinaceous products) yields the following:
That is, a unit of bakery and farinaceous products directly requires 0.030 dairy products, 0.007 bakery and farinaceous products, 0.084 imports of goods and services, and so forth.
In the 2014 IOAT article it is shown that this matrix can be used to construct a Leontief inverse matrix, which premultiplies a final demand vector to give the total demand generated. The vector produced by the Leontief consists of the products required to directly satisfy final demand and the products required to indirectly satisfy final demand. The indirect demand does not only include products used directly to satisfy intermediate consumption of final demand.
For example, if there was final demand for dairy products the intermediate consumption would include agricultural products such as raw milk production and the raising of dairy cattle. The intermediate consumption of dairy would not include prepared animal feeds, which are required for raising dairy cattle. The indirect demand for the final demand for dairy would include not just agricultural products (raw milk), but also prepared animal feed. The analysis does not account for demand driven by the compensation of employees generated.
The entries of the Leontief inverse, therefore, show the total demand of the product given by the row, per unit demand of the product given by the column. Summing column values will give the total demand generated by a unit demand of a product.
5.3 What are effects and multipliers?
The effects published in the detailed input-output analytical tables (IOATs) show the total impact of a £1 million increase in final demand for a product. For example, product 13 (textiles) has a gross value added (GVA) effect of 0.660. This means that an increase of £1 million in the final demand for textiles is estimated to increase total GVA by £0.660 million. The remaining £0.340 million is comprised of taxes on products and imports. Similarly, the output effect for textiles is 1.427 so a £1 million increase in final demand of textiles is estimated to increase total UK output across all products by £1.427 million.
The multipliers measure the ratio between the initial impact and the total impact. Product 10.1 (preserved meat and meat products) has an employment multiplier of 2.649. If final demand for this product was increased such that the compensation of employees generated directly was increased by £1 million, the total increase to compensation of employees across the economy is estimated to be £2.649 million. The detailed IOATs only provide employment data in terms of employment cost by product. A similar analysis in terms of full time equivalent (FTE) jobs per industry can be found in the Industry-by-industry FTE analysis.
Output multipliers are identical to output effects, since the initial impact of a unit change in final demand on output is one and the total impact is defined as the effect value.
The rest of this section provides some illustrative examples to explain what the tables represent and how they can be used.
Effects
How do I calculate the effects of a £10 million change in the final demand of financial and insurance products on the total output of each product?
The IOATs contain effect values for each product, which give the total change in an input for the total economy level per unit change of final demand. By using the Leontief inverse matrix users can calculate the changes on a product level. This example uses the Leontief inverse matrix from Table 6 of the IOAT summary tables.
The total effect caused by the final demand change of £10 million is easily found from the column totals of the Leontief inverse, which represents the effects of a unit change to final demand. This is shown to be £16.85 million (1.685 multiplied by £10 million) and the split of this is found by multiplying the Leontief inverse by the final demand vector representing a 10-unit change in final demand for category 6.
This is calculated using the following equation:
The £11.234 million of output generated from the change in final demand include both the indirect effects and the direct effect of £10 million.
It is important to note that using the Leontief inverse in this way assumes that the inter-industry relationships remain constant under the final demand change. It is therefore more accurate for smaller proposed changes, as larger changes could change the relationships the matrix represents. A larger change would also incur a more significant induced effect, which measures the effect on the economy of increased compensation of employees being re-spent on goods and services and is not modelled in our analyses. The induced effect can be estimated by type two multipliers, which we do not currently produce.
Multipliers
How do I calculate multipliers from the IOAT summary tables and how do I use the GVA multiplier to find the initial effect of a change in GVA given a total effect?
Gross value added (GVA) and employment cost multipliers are published for the detailed IOATs and can be used to estimate the direct and indirect effects of changes in final demand; however, there are various other multipliers that can be calculated from the tables.
To find the import multiplier for category two (production [5 to 39]) on the IOAT summary tables, begin by calculating the output effect vector (as shown previously). This can be found to be:
This gives the product breakdown of the total output generated by a £1 million increase in demand of category two products. The import requirements of £1 million of production for each product can be found at the bottom of the Coefficient matrix, which is too large to display here but can be found in Table 6 of the summary IOATs. This can be multiplied by the previous equation to find the total imports needed for the total demand generated by £1 million increase in final demand of category two products, as shown in the following equation:
The multiplier is calculated by dividing the total imports generated by final demand (calculated previously) by the import requirement of category two products as follows:
For every unit of import used in the production of category two products to directly satisfy final demand, an additional 0.49 units of import are used indirectly to satisfy final demand.
From the detailed IOATs the GVA multiplier for textiles is found to be 1.415 and the GVA effects to be 0.660, this represents the total increase in GVA due to a unit increase of final demand for textiles. The direct effect of the increase on GVA is calculated as follows:
The indirect effect is 0.194, the difference between the total GVA effect and direct GVA effect.
The multipliers are subject to the same assumptions as the effect values.
Nôl i'r tabl cynnwys6. Further analyses
Sector breakdown of total imports generated by final demand
The sector breakdown of total imports generated by final demand was a new table we published this year. Each column is constructed by multiplying the associated sector column in the final demand section of the use table by the import effects.
Product breakdown of compensation of employees generated by an increase by £10 million of household final demand
Section 5.3 explains how a product breakdown of the effects generated by a change in final demand can be calculated from the input-output analytical tables (IOATs). This approach can also be used to find the product breakdown of the effects of a sector on the UK economy per unit of demand.
To do this a unit vector must be created representing the products required by the sector’s increased final demand. Direct effects are found by multiplying this by the input requirements per unit of output. Next the total effects must be calculated. The output effects are found by premultiplying the demand vector by the Leontief inverse matrix, and the product of this is multiplied by the input requirements per unit of output from the matrix of coefficients. The difference between the total and direct effects gives the indirect effects.
From the summary IOATs the total household demand is:
To estimate the effects of the increased demand on the economy a distribution of the increased demand must be produced. For the purposes of this example, it is assumed that no extra information is held about how the distribution of goods demanded by households would change with an increase in final demand and, as such, each item in the previous vector is divided by the total household demand and multiplied by 10 to give the following:
As before the effect of this is calculated using the Leontief inverse as follows:
The compensation of employees figures from the matrix of coefficients can then be multiplied by this, element by element, to give the vector of total compensation of employees generated per unit of final demand by households. This is calculated using the following equation:
Where * denotes element by element multiplication.
This can be split further by using the compensation of employees vector and the £10 million vector of household demand to calculate the direct effects.
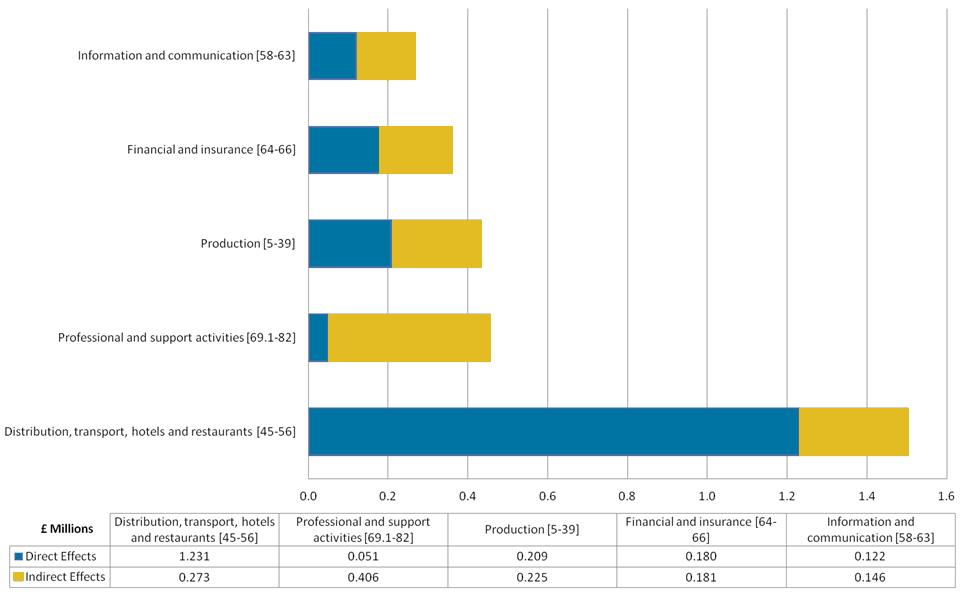
The analysis completed in the previous steps is presented in Figure 1, which shows the top five product categories by total compensation of employees generated by a £10 million total increase in the final demand of households.
The direct effects have been calculated and subtracted from the total effects to give the indirect effects.
Figure 1: Disaggregated compensation of employees effects generated by a £10 million increase in final demand from households
Source: Office for National Statistics
Notes:
- For a larger version, please download the png.
Download this image Figure 1: Disaggregated compensation of employees effects generated by a £10 million increase in final demand from households
.png (53.7 kB) .xls (23.0 kB)
7. Next steps
Since publishing the tables there has been a high level of interest in the input-output analytical tables (IOATs). Through the process of creating the 2013 tables we have improved the compilation process and established more regular access to the required data. As a result, we intend to publish the IOATs annually with the 2014 version consistent with UK Blue Book 2017 following shortly after the Blue Book publication in October 2017.
Furthermore, we recognise that a high number of the users of these analytical tables are interested in industry-by-industry tables, and type two multipliers, which estimate the induced effects. We are looking to publish these as part of future tables.
Nôl i'r tabl cynnwys8. Contact
The Supply and Use Development Team is keen to hear your views and take any further questions from our users. We can be contacted via email at sut@ons.gov.uk.
Nôl i'r tabl cynnwys9. Appendix 1: Summary of tables
This section provides a short summary of what is represented by each published input-output analytical table.
Product by industry tables
Combined use table at purchasers’ prices
This table shows the use of products and primary inputs (rows) by industries (columns). These values are inclusive of imports, taxes minus subsidies on products, and distributor trading margins (DTMs).
Table 5: Combined use, purchasers’ prices
Source: Office for National Statistics
Download this image Table 5: Combined use, purchasers’ prices
.png (9.7 kB)Transition matrix
Values in the transition matrix are subtracted from values in the combined use table at purchasers’ prices to create the domestic use table at basic prices.
Domestic use table at basic prices
This table shows the use of products and primary inputs (rows) by industries (columns). Imports, taxes minus subsidies on products, and distributor trading margins (DTMs) are separated from the values. Industry totals for DTMs equal zero so are not displayed in the primary inputs.
Table 6: Domestic use, basic prices
Source: Office for National Statistics
Download this image Table 6: Domestic use, basic prices
.png (13.5 kB)Product by product tables
Input-output table
This table shows the value of domestically supplied products (rows) required for the output of each product (columns), and to satisfy final demand (columns). This can be thought of as a product-by-product domestic use table.
Imports use table at basic prices
A table showing the imported products (rows) required for the output of each product (columns), and to satisfy final demand (columns).
Matrix of coefficients
A table showing the product and primary input requirements (rows) for £1 million of output of a product (columns).
Leontief inverse
The table showing the total output of a product (row) generated by a unit increase in the final demand of a product (column).
Further analyses
Multipliers and effects
Multipliers can be used to calculate total change in an input generated by a given direct change.
Effects show total change in an input generated by a £1 million increase in final demand for a product.
Primary input content of final demand
A table showing the total primary input values generated by the final demand for products. This derivation uses the hybrid technology assumption.
Composition of final demand in terms of direct and indirect GVA
A table showing the direct and indirect gross value added (GVA) for each final demand category (columns) generated by their demand for each product (rows).
Industrial analysis of primary inputs
A table showing the total primary input values generated by the final demand for products. This derivation uses the assumption that an industry uses the same proportion of primary inputs for each unit of output.