1. Introduction
The balance of payments measures the economic transactions of the UK with the rest of the world. These transactions can be broken down into 3 main accounts: the current account, the capital account and the financial account. The current account comprises the trade in goods and services account, the primary income account and secondary income account. The balance on these accounts is known as the current account balance. The current account balance shows the difference between the sum of exports and income receivable and the sum of imports and income payable.
To elaborate on the conceptual framework, a current account balance is in surplus if overall credits exceed debits and in deficit if overall debits exceed credits. Closely related to the balance of payments is the international investment position series of statistics. The international investment position measures the levels of financial investment with the rest of the world, inward and outward. Developments in these measures are of substantial importance in assessing the degree of external balance that the UK experiences. For instance, external macroeconomic shocks can be transmitted rapidly to the UK economy through investment choices of both UK and foreign investors, as well as through changes in asset prices and fluctuations in the exchange rate. These shocks could have a wider effect on the whole economy than would be implied through trade and investment links alone.
This first chapter will give an analytical overview of the UK’s current account and its constituent parts. It will primarily focus on the trade account and primary income account to assess both their changing roles in the deterioration of the current account balance. There will also be a further decomposition of the international investment position (mainly trends in direct investment) and its subsequent rate of returns, to assess their contribution in the decline in the primary income (earnings on investment) in recent years.
Nôl i'r tabl cynnwys2. Current account overview
To assess recent developments in the UK’s external position, Figure 1.1 breaks down the current account balance into its constituent parts – the trade balance, the primary income balance (income earned by UK residents from investment abroad, less income earned by non-residents on their UK investments) and the secondary income balance that captures transfers between the UK and other countries (for example, payments and receipts to or from EU institutions and other international bodies). It shows that the UK has been recording a current account deficit every year since 1994. From 1998 to 2008, the deficit widened, peaking at 3.6% of nominal Gross Domestic Product (GDP) in 2008. In subsequent years, the deficit narrowed slightly but – widened thereafter. Latest figures show the current account deficit widened to 5.1% of nominal GDP in 2014, representing the largest deficit (in annual terms) since our records began in 1948. This deterioration in performance can be partly attributed to the recent weakness in the primary income balance: suggesting that UK earnings on assets overseas had fallen relative to the earnings of foreign investors in the UK.
Figure 1.1: UK current account balance as percentage of nominal GDP, 1994 to 2014
Source: Office for National Statistics
Download this chart Figure 1.1: UK current account balance as percentage of nominal GDP, 1994 to 2014
Image .csv .xlsAlthough previous deteriorations in the current account balance have been driven by a fall in the balance on trade, the recent deterioration is a consequence of a sharply lower primary income balance (income earned by UK residents from investments overseas, less income earned by non-residents on their UK investments). The primary income balance also reached a record annual deficit in 2014 of 1.8% of nominal GDP; a figure that can be primarily attributed to a fall in UK residents’ earnings from investment abroad and broadly stable foreign resident earnings on their investments in the UK.
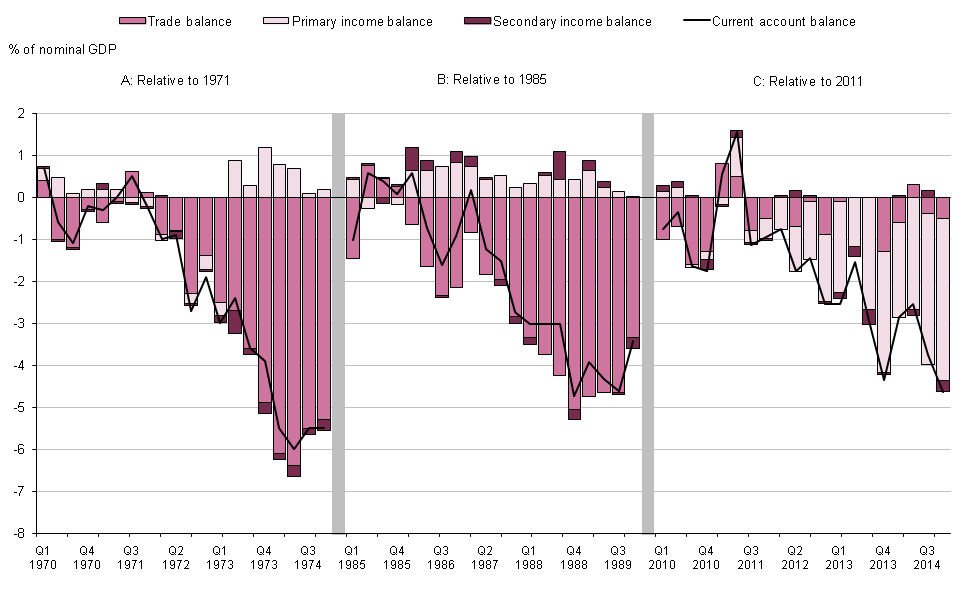
For a detailed assessment of the deterioration in the balance, Figure 1.2 compares contributions to the fall in the current account balance since 2011 (Panel C) to previous occurrences in the 1970s (Panel A) and 1980s (Panel B). The first 2 panels show that previous declines – of 6.0% and 4.7% of GDP respectively – were mainly driven by the balance of trade (shown in the dark pink bars). In contrast, the latest decline in the current account of 4.7% of GDP since 2011 has been driven by a decline of the primary income balance (shown in the light pink bars). A further examination of the drivers of the deterioration in the primary income will be analysed in a subsequent section of this chapter.
Figure 1.2: Contributions to the deterioration in the UK current account relative to selected calendar years, percentage of nominal GDP
Source: Office for National Statistics
Notes:
- Q1 refers to Quarter 1 (Jan to Mar), Q2 refers to Quarter 2 (Apr to June), Q3 refers to Quarter 3 (July to Sept) and Q4 refers to Quarter 4 (Oct to Dec)
Download this image Figure 1.2: Contributions to the deterioration in the UK current account relative to selected calendar years, percentage of nominal GDP
.png (51.5 kB)
From an international perspective, there have been striking divergences in the relative performance of current accounts among the major developed economies. Figure 1.3 compares the current account balance as a proportion of GDP in the G7 economies (US, Japan, UK, Germany, France, Italy and Canada) for the 2 most recent calendar years with that in 2007. This highlights how the external position of major economies has evolved following the economic downturn in 2008 and 2009.
Figure 1.3 shows that 4 of the 7 economies (including the UK) have experienced deteriorating current account balances relative to 2007; however, the UK recorded the largest current account deficit as a percentage of GDP (5.1%) among these economies in 2014. Along with Japan, this also represented a worsening position relative to 2013. In contrast, Germany experienced the largest current account surplus as a percentage of GDP in 2014, which was also a small improvement on the surpluses recorded in 2007 and 2013. Similarly, the US experienced an improvement on its current account balance as a percentage of GDP from a deficit of 5.0% in 2007 to a deficit of 2.3% of GDP in 2014.
Figure 1.3: Current account balances of the G7 economies, 2007, 2013 and 2014
Credits less debits
Source: Office for National Statistics, Organisation for Economic Co-operation and Development, Japan Cabinet Office
Notes:
- Data for Japan in 2007 is sourced from the Japanese Cabinet Office
Download this chart Figure 1.3: Current account balances of the G7 economies, 2007, 2013 and 2014
Image .csv .xls3. Trade
As explored in the introductory section above, the trade balance has accounted for a smaller proportion to the recent deterioration in the current account balance, when compared to previous occurrences. The widening of the current account deficit has been a consequence of the decline in the primary income account. This, coupled with a persistent trade deficit, has put further downward pressure on the current account balance, highlighting the importance of trade in the developments of the current account balance.
Figure 1.4 compares the trade balance as a proportion of GDP in the G7 economies (US, Japan, UK, Germany, France, Italy and Canada) for the calendar year 2014 with that in 2007. It shows 4 of the 7 economies (the UK included) experienced an improvement in their trade balance relative to 2007. The UK, France and the US experienced trade deficits in both periods, while Germany recorded a trade surplus in both periods.
Figure 1.4: G7 trade balances as a percentage of nominal GDP, 2007 and 2014
Credits less debits
Source: Office for National Statistics, Organisation for Economic Co-operation and Development
Download this chart Figure 1.4: G7 trade balances as a percentage of nominal GDP, 2007 and 2014
Image .csv .xlsAs illustrated in Figure 1.4, Japan, France and Canada experienced deteriorating trade balances (when imports are greater than exports) in 2014 compared with 2007. This was particularly notable for Japan and Canada who switched from a surplus in 2007 to a deficit in 2014. The US and UK have, however, seen a narrowing in their trade balances when compared with 2007, while Germany saw a slight increase in its surplus since 2007. However, Italy recorded a small deficit in 2007 but switched to a comparatively large surplus in 2014. One contributing factor to explain the different experiences across countries could be differences in relative exchange rate movements. Economic theory suggests that, all else equal, depreciation in the exchange rate results in the fall of imports and an increase in exports. This is because the purchasing power of the domestic currency falls, requiring more currency to buy foreign goods. A currency appreciation has the opposite effect. The recent strength of the pound in recent periods may have reduced the competitiveness of the UK’s exports and the overall trade balance.
Figure 1.5 compares the trend in the Sterling trade weighted exchange rate index with that of total exports and imports, relative to 2005. It shows between 2007 and 2009, the sterling effective exchange rate depreciated by 22%. This was the largest depreciation of sterling in recent history, more than reversing the appreciation of the late 1990s. However, this depreciation over this period appears to have had at most a relatively modest impact on the UK’s trading position. Subsequent to 2009, the pound has been appreciating, although over the last year it has appreciated at a faster rate. This may be an indication of why UK’s exports were less competitive in the same period resulting in the widening of the trade deficit to £34.5 billion in 2014.
Figure 1.5: UK Sterling effective exchange rate and total UK imports and exports 2005=100, 1994 to 2014
Credits less debits
Source: Office for National Statistics
Download this chart Figure 1.5: UK Sterling effective exchange rate and total UK imports and exports 2005=100, 1994 to 2014
Image .csv .xlsA detailed analysis of the trade balance shows a record surplus on services trade, offset to some extent by a persistent deficit on goods. As illustrated in Figure 1.6, the recent strength of trade surplus in services is partly due to lower imports, but also because of a resilient export performance. The export of services as a percentage of GDP has increased by almost 71% since 1994, while imports rose by just 33% over the same period. However, much of the weakness of aggregate UK exports is attributable to the recent decline in the exports of goods, explained by the decline in goods exports to the EU.
Figure 1.6: UK imports and exports as a percentage of nominal GDP, 1994 to 2014
Source: Office for National Statistics
Download this chart Figure 1.6: UK imports and exports as a percentage of nominal GDP, 1994 to 2014
Image .csv .xlsIn levels terms, the values of UK exports of goods to the EU and non-EU countries are now broadly similar: in 2014 these were £147.6 billion and £145.8 billion respectively. However, in recent years UK goods exports to non-EU countries have grown at a much faster rate than UK goods exports to the EU. Since 2007, goods exports to non-EU countries rose by 54%, while goods exports to EU countries rose by only 15%. In part, this reflects the relative strength of these markets during the downturn. Exports of goods to EU countries were more affected by the economic downturn, highlighting the relative economic performances of the UK’s trading partners since then, with much weaker demand growth in the EU and stronger demand growth in non-EU markets. This might suggest that the extent of overseas demand for UK products may have been limited by prevailing global economic conditions. However, whether the UK’s trade performance has been proportionate to economic conditions in its major export partners is difficult to establish.
To analyse this closely, Figure 1.7 shows the growth of the UK’s goods and services export markets compared with the actual growth of UK goods and services exports. The former involves weighting the import growth in a selection of economies according to the amount that the UK exports to each country.
Figure 1.7: UK annual percentage change in export markets and export growth, 2003 to 2014
Source: Office for National Statistics, IMF
Download this chart Figure 1.7: UK annual percentage change in export markets and export growth, 2003 to 2014
Image .csv .xlsFigure 1.7 indicates that the extent of overseas demand for UK goods may have been limited by prevailing economic conditions. It shows that UK export growth broadly tracks the weighted import growth of other countries. You would expect this, as a higher demand from abroad should translate to export growth from the UK, all else being equal. UK export growth saw a marked decline during the downturn of 2008 to 2009, recovering in 2010. The recent decline in export growth could in part be attributed to weaker economic performance in the EU more than offsetting relatively stronger growth in non-EU countries.
Figure 1.8: UK trade in goods and services balance with selected EU countries, 2003 to 2014
Source: Office for National Statistics
Download this chart Figure 1.8: UK trade in goods and services balance with selected EU countries, 2003 to 2014
Image .csv .xlsFigure 1.8 and 1.9 examines the disparities in the UK’s trade balance with the EU and some non-EU countries in more detail. UK trade in goods and services with the EU involves some bilateral surpluses (Ireland and Netherlands) and some deficits, as seen in Figure 1.8. The most substantial bilateral deficit within the EU is with Germany, which increased by 13% to £27.3 billion in 2014. The UK trade balance with respect to Germany has been in deficit for the past decade with the largest deficit recorded in 2014. In contrast, the UK trade balance with Ireland has been in surplus from 2003, while UK trade with the Netherlands has experienced both deficits and surpluses during this period. The UK trade deficit with EU countries as a whole is currently valued at £61.7 billion.
Figure 1.9: UK trade in goods and services balance with selected non-EU countries, 2003 to 2014
Source: Office for National Statistics
Download this chart Figure 1.9: UK trade in goods and services balance with selected non-EU countries, 2003 to 2014
Image .csv .xlsAmong the non-EU countries, the UK has seen rising surpluses in trade with the US in recent years, reaching a peak of £41.0 billion in 2013 (Figure 1.9). However, the UK also had the largest trading deficit with China in the last decade; this has grown markedly since 2005 and is currently recorded at £19.6 billion.
Nôl i'r tabl cynnwys4. Primary income
Figure 1.2 in the introductory section illustrated that in recent years, the deterioration in the current account balance has become less attributable to the trade balances and more attributable to the decline in the primary income balance. This suggests that UK earnings on assets overseas fell in value relative to the earnings of foreign investors in the UK. Figure 1.10 shows the main drivers of the primary income balance. This is a net concept, so it factors in the income flows to and from the UK on our assets and liabilities with the rest of the world. It shows that the recent deterioration in the primary income balance can be attributed to the decline in the direct investment income balance and net income earned on debt securities.
For more detailed information on the decline of net direct investment income, please see our analysis of foreign direct investment which is also published today.
Figure 1.10: Contribution to the UK primary income balance, 1997 to 2014
Source: Office for National Statistics
Download this chart Figure 1.10: Contribution to the UK primary income balance, 1997 to 2014
Image .csv .xlsThe fall in the balance on primary income reflects a combination of different effects, including a relative fall in the rates of return on UK assets held overseas. As set out in previous analysis, the balance on primary income depends on the relative quantities of assets held by UK investors overseas and overseas investors in the UK, and the relative rates of return that they earn on their respective portfolios. All else being equal, larger holdings of assets by UK investors overseas will tend to increase the balance on primary income. While increased holdings of UK assets by overseas investors will lead to a decrease in the balance on primary income. Similarly, a relative fall in the rate of return earned by UK investors will tend to decrease the balance on income. While a fall in the rate of return for overseas investors would lead to an increase in the primary income balance.
As the primary income balance reflects the difference between 2 earnings flows from investments, it can readily be decomposed into its 4 component parts: the stock of assets that the UK holds overseas, and the rate of return it receives on those assets, as well as the stock of assets that overseas agents hold in the UK, and the rate of return that they receive on those assets. As a matter of accounting, the total earnings flows divided by the average value of opening and closing assets held by the UK overseas, equates to the implied rate of return on these assets. Trends in all 3 are examined in the next section.
Nôl i'r tabl cynnwys5. Further examination of the UK’s stock position
With UK residents investing in overseas assets at a slower rate compared to their foreign counterparts, there has also been a worsening of the UK’s International Investment Position (IIP). The UK’s IIP comprises of UK assets (UK residents’ holdings of overseas assets) and UK liabilities (foreign owned assets in the UK); with the Net International Investment Position (NIIP) simply the difference between them. The IIP is made up of 5 distinguishable functional categories, which are:
direct investment
portfolio investment
- equity and investment fund shares
- debt securities
financial derivatives
other investment
reserve assets
Figure 1.11 outlines the contribution to the UK’s NIIP during the past 2 decades. Since 1994, the NIIP has consistently represented a negative position, with the exception of a brief positive outturn in 2008. However, in recent years, the UK’s external position has deteriorated further, with latest estimates showing a negative NIIP of around 25% of nominal GDP in 2014. This broadly represents the accumulated deficits that the UK has run with the rest of the world and gives an indication of the degree of external balance that the UK experiences. Historically, the UK has offset mostly negative net portfolio and other investment with much larger positive net direct investment positions. A larger deficit on portfolio investment and increased overseas holdings of Foreign Direct Investment (FDI) assets in the UK combined with lower UK holdings of FDI abroad, account for the majority of the recent fall in the NIIP.
Figure 1.11: Contribution to the UK net international investment position, 1994 to 2014
Source: Office for National Statistics
Download this chart Figure 1.11: Contribution to the UK net international investment position, 1994 to 2014
Image .csv .xlsFigure 1.12 focuses on the UK’s FDI position in detail, showing UK asset and liability stocks and the net figure as a percentage of nominal GDP. Prior to 2012, the UK’s net FDI position was markedly above zero as UK investors held more overseas assets (UK assets) than their foreign counterparts’ holdings of UK assets (UK liabilities). The gap between these 2 positions has converged in subsequent years, with the stocks of UK liabilities surpassing that of UK assets in 2014, recording the first ever negative FDI net position since our records begun. The UK’s net direct investment reduced from a surplus of 28.1% in 2008 to a deficit of 8.1% in 2014 of nominal GDP respectively.
Figure 1.12: UK long-run FDI assets, liabilities and net positions, 1994 to 2014
Source: Office for National Statistics
Download this chart Figure 1.12: UK long-run FDI assets, liabilities and net positions, 1994 to 2014
Image .csv .xls6. An examination of the rate of returns
While the total value of UK investors’ holdings of overseas assets has fallen relative to the value of holdings in the UK by overseas investors, the fall in the rate of return on UK assets overseas may have also played an important role in the widening of the deficit on the investment income balance. Outlined in the above section, a fall in the rate of return earned by UK investors (or overseas investors) will tend to reduce (or increase) the balance on investment income. For a detailed look at the developments in these measures, Figure 1.13 shows the rates of return received by UK and overseas investors for 3 different forms of asset functional categories: direct investment, portfolio investment and other investments. It shows that during most of the years, the UK generated a higher rate of return on its direct investments than overseas investors, while the differences for portfolio and other investments were relatively slight.
Figure 1.13: UK and overseas rates of return: direct, portfolio and other investments, 1997 to 2014
Source: Office for National Statistics
Download this chart Figure 1.13: UK and overseas rates of return: direct, portfolio and other investments, 1997 to 2014
Image .csv .xlsHowever, in the period coinciding with the further marked deterioration in the primary income balance (2012 to 2014), the rates of return on direct investments have converged and overseas investors now generate a higher rate of return on portfolio investments than their UK counterparts. This could reflect a range of factors such as the relative strength of the UK economy or relative weakness of overseas economies in which UK assets are based.
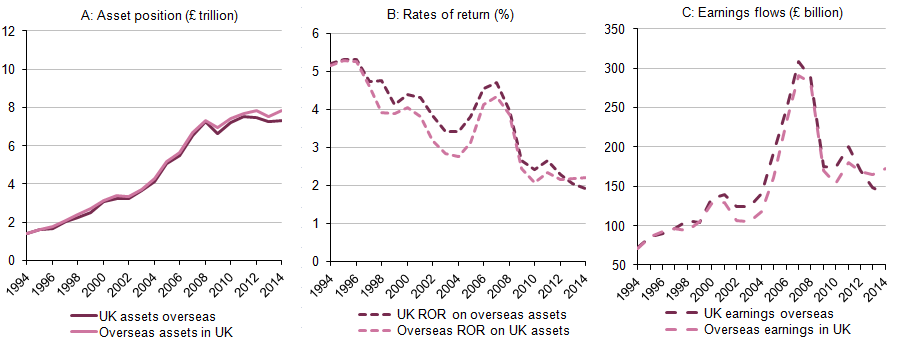
Figure 1.14: Assets (£ trillion), rates of return (%) and earnings (£ billion) for UK assets overseas and overseas assets in the UK, 1994 to 2014
Source: Office for National Statistics
Download this image Figure 1.14: Assets (£ trillion), rates of return (%) and earnings (£ billion) for UK assets overseas and overseas assets in the UK, 1994 to 2014
.png (37.1 kB)
Figure 1.14 summarises the main factors that appear to be driving the recent decline in the primary income balance. Firstly, the gap between the stock of assets that the UK holds abroad and the stock of assets held by overseas investors in the UK has widened markedly in recent years. This is likely to be the result of a combination of currency effects and relative movements in FDI flows which have had a greater impact on the stock of UK assets held abroad. Secondly, the rate of return that the UK receives on its assets abroad has fallen slightly, while the rate of return earned by agents overseas on assets in the UK has risen slightly. This likely reflects the strong performance of the UK economy, in particular relative to the euro area, where a large fraction of the UK’s overseas assets are based. Both of these factors have driven a growing wedge between UK earnings overseas and overseas earnings in the UK, as shown in Panel C.
Nôl i'r tabl cynnwys