Cynnwys
- Main points
- Things you need to know about this release
- The total trade deficit narrowed in the three months to September 2018
- Removing the effect of inflation, the trade balance narrowed in the three months to September 2018
- The trade in goods deficit narrowed with the EU and non-EU countries in the three months to September 2018
- The total trade balance deficit narrowed in the 12 months to September 2018
- The UK trade in goods deficit narrowed with the EU and widened with non-EU countries in the 12 months to September 2018
- Explore UK trade in goods country-by-commodity data via our interactive tools
- Links to related statistics
- Quality and methodology
1. Main points
The total trade deficit (goods and services) narrowed £3.2 billion to £2.9 billion in the three months to September 2018, due mainly to an improving goods balance.
Goods exports increased £5.0 billion compared with a £2.1 billion rise in goods imports, resulting in the goods deficit narrowing £2.9 billion to £31.9 billion in the three months to September 2018.
Cars had the single-largest impact on the goods balance due to a combined £1.0 billion rise in non-EU exports and £1.7 billion fall in EU imports in the three months to September 2018.
Rising exports was the main factor for the goods deficit narrowing with both EU and non-EU countries, by £2.5 billion and £0.4 billion respectively, in the three months to September 2018.
Removing the effect of inflation, the total trade deficit narrowed £4.0 billion to £1.7 billion in the three months to September 2018.
In the 12 months to September 2018, the total trade deficit narrowed £7.6 billion, due mainly to a widening of the trade in services surplus.
2. Things you need to know about this release
International Passenger Survey
Estimates derived from the International Passenger Survey (IPS) are used to help measure exports and imports of travel services. The International Passenger Survey (IPS) has recently transferred data collection from paper forms to tablet computers. While initial analysis of the new data found no detectible discontinuities, we are continuing to check the data. Therefore, headline trade and other national accounts estimates will continue to include some forecast data for exports and imports of travel services in the most recent periods. More information is available in the Overseas travel and tourism release.
Data revision policy
All of the data within this release have been revised back to July 2018
All of the data in this release have been revised back to July 2018 when compared with trade figures published in our previous trade bulletin on 10 October 2018. Data in this release are consistent with estimates published in the Quarterly national accounts release also published on 9 November 2018 for Quarter 3 (July to Sept) 2018.
National Statistics designation status
The UK Statistics Authority suspended the National Statistics designation of UK trade (PDF 72.8KB) on 14 November 2014. We have now responded to all of the specific requirements of the reassessment of UK trade and are in the final stages of providing evidence to the Authority. We are undertaking a programme of improvements to UK trade statistics in line with the UK trade development plan, including more detail and improvements now published to address anticipated future demands. On 24 October 2018, we published an article outlining our achievements so far and forward look at the transformation of our trade statistics; we will continue to work with the Office for Statistics Regulation team to regain National Statistics status for UK trade statistics. We welcome feedback on our new trade statistics, developments and future plans.
Nôl i'r tabl cynnwys3. The total trade deficit narrowed in the three months to September 2018
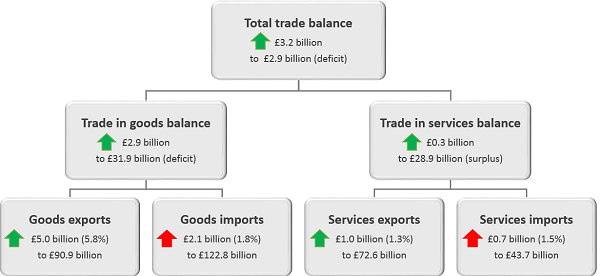
Figure 1 shows the change to goods, services and total trade balances along with exports and imports in the three months to September 2018 compared with the three months to June 2018.
The total trade deficit (goods and services) narrowed £3.2 billion to £2.9 billion in the three months to September 2018 due to increases in exports being larger than imports across both goods and services.
Trade in goods was the main factor in the narrowing of the total trade deficit, as the goods deficit narrowed £2.9 billion to £31.9 billion in the three months to September 2018; exports increased £5.0 billion, which was partially offset by a £2.1 billion increase in imports.
Trade in services also contributed to the narrowing of the total trade deficit, as the services surplus widened £0.3 billion, due to a £1.0 billion increase in exports, which was partially offset by a £0.7 billion increase in imports.
Figure 1: Changes in UK trade balances, exports and imports, three months to September 2018 compared with three months to June 2018
Source: Office for National Statistics
Notes:
The arrow direction indicates whether a component has increased or decreased, while the colour denotes the impact the direction of a movement has on the trade balance.
For example, an increase in imports is denoted by an upward red arrow, as a rise in imports has a negative impact on the trade balance, while an increase in exports is denoted by an upward green arrow, as a rise in exports has a positive impact on the trade balance.
Download this image Figure 1: Changes in UK trade balances, exports and imports, three months to September 2018 compared with three months to June 2018
.png (44.3 kB)
Figure 2 shows UK trade balances on a three-month on three-month basis between September 2016 and September 2018. The total trade balance shows a broadly narrowing trend over the period, ranging from a deficit of £13.7 billion in the three months to September 2016, to a deficit of £2.9 billion in the three months to September 2018.
Excluding erratic commodities, the total trade deficit narrowed £2.2 billion to £3.8 billion in the three months to September 2018.
Figure 2: UK trade balances, three-month on three-month, September 2016 to September 2018
Source: Office for National Statistics
Download this chart Figure 2: UK trade balances, three-month on three-month, September 2016 to September 2018
Image .csv .xls4. Removing the effect of inflation, the trade balance narrowed in the three months to September 2018
This section presents volume and prices estimates of the UK trade balances, exports and imports using chained volume measures (CVMs) and implied deflators (IDEFs). A CVM is a measure that has had the effect of inflation removed. An IDEF shows the implied change in average prices for the respective components of the trade balance.
Figure 3 shows the UK trade balances on a CVM basis, three-month on three-month, from September 2016 to September 2018.
The total UK trade deficit (goods and services) narrowed £4.0 billion to £1.7 billion in CVM terms in the three months to September 2018. The narrowing of the total trade deficit was due to trade in goods, as the deficit in goods narrowed £4.5 billion to £28.5 billion; partially offsetting this, the services surplus narrowed by £0.5 billion.
Goods exports grew by £3.5 billion, while goods imports fell by £1.1 billion in the three months to September 2018; services exports increased £0.5 billion, which was offset by a £1.1 billion rise in imports.
The total trade deficit in CVM terms shows a clear narrowing trend over the past two years and has ranged from £14.3 billion in September 2016 to £1.7 billion in September 2018, the latest monthly period.
Figure 3: Total trade balances, chained volume measures, three-month on three-month, September 2016 to September 2018
Source: Office for National Statistics
Download this chart Figure 3: Total trade balances, chained volume measures, three-month on three-month, September 2016 to September 2018
Image .csv .xlsFigure 4 shows the CVM for UK total trade exports along with accompanying implied deflator. The main factor in the narrowing of the total trade deficit in the three months to September 2018 was a £3.5 billion (4.4%) increase in the volume of goods exports. The increase in exports was due mainly to the volume increase as prices increased by a lesser 1.5%.
In CVM terms, goods exports increased £9.6 billion between the three months to September 2016 and the three months to September 2018, from £72.3 billion to £81.9 billion respectively.
Figure 4: Exports of total trade, chained volume measures and implied deflator, three-month on three-month, September 2016 to September 2018
Source: Office for National Statistics
Download this chart Figure 4: Exports of total trade, chained volume measures and implied deflator, three-month on three-month, September 2016 to September 2018
Image .csv .xls5. The trade in goods deficit narrowed with the EU and non-EU countries in the three months to September 2018
Figure 5 shows the change in goods exports, imports and trade balances with EU and non-EU countries between the three months to June 2018 and the three months to September 2018.
The trade in goods deficit narrowed £2.5 billion with EU countries and £0.4 billion with countries outside the EU in the three months to September 2018. Rising goods exports were the main factor for the narrowing of the deficit with both EU and non-EU countries, although falling goods imports also had an impact on the trade balance with the EU.
The main contributors to the £2.5 billion narrowing of the goods deficit with the EU were a £1.1 billion increase in exports of fuels (mostly oil) and a £1.2 billion fall in the imports of machinery and transport equipment (mainly cars) in the three months to September 2018.
A £2.2 billion rise in exports of machinery and transport equipment (mainly cars) to non-EU countries was the largest export contributor in the three months to September 2018. While imports increased overall from non-EU countries, a £1.3 billion fall in imports of unspecified goods had a large impact on the overall goods balance with non-EU countries.
Falling imports of cars from EU countries and rising car exports to non-EU countries meant cars were the largest single goods contributing to the narrowing of the trade in goods deficit. You can now explore these lower-level movements using our trade interactives or country by commodity data for exports and imports that are based on non-seasonally adjusted data.
Figure 5: Changes in UK goods exports, imports and trade balance with EU and non-EU countries, three months to June 2018 compared with three months to September 2018
Source: Office for National Statistics
Download this chart Figure 5: Changes in UK goods exports, imports and trade balance with EU and non-EU countries, three months to June 2018 compared with three months to September 2018
Image .csv .xls6. The total trade balance deficit narrowed in the 12 months to September 2018
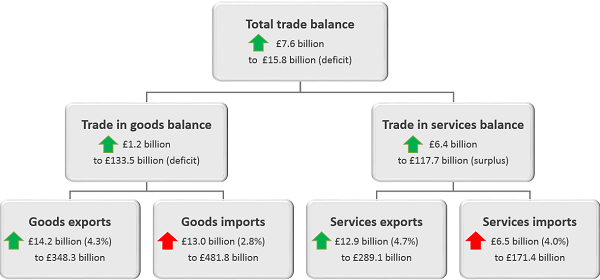
Figure 6 shows the changes to goods, services and total trade balance along with exports and imports in the 12 months to September 2018, compared with the 12 months to September 2017.
The total UK trade deficit (goods and services) narrowed £7.6 billion to £15.8 billion in the 12 months to September 2018. The narrowing in the total trade balance deficit due mainly to a £6.4 billion widening in the services surplus; the trade in goods deficit narrowed by a lesser £1.2 billion.
Services exports rose by £12.9 billion in the 12 months to September 2018, while services imports increased by a lesser £6.5 billion. The largest contributors to the increase in exports were other business services along with financial services.
Exports of goods increased £14.2 billion over the same period, which was broadly offset by a £13.0 billion growth in imports of goods.
Figure 6: Changes to UK trade balances, exports and imports, 12 months to September 2018 compared with 12 months to September 2017
Source: Office for National Statistics
Notes:
The arrow direction indicates whether a component has increased or decreased, while the colour denotes the impact the direction of a movement has on the trade balance.
For example, an increase in imports is denoted by an upward red arrow, as a rise in imports has a negative impact on the trade balance, while an increase in exports is denoted by an upward green arrow, as a rise in exports has a positive impact on the trade balance.
Download this image Figure 6: Changes to UK trade balances, exports and imports, 12 months to September 2018 compared with 12 months to September 2017
.png (46.0 kB)
7. The UK trade in goods deficit narrowed with the EU and widened with non-EU countries in the 12 months to September 2018
Figure 7 shows the changes in UK goods exports, imports and trade balances with EU and non-EU countries in the 12 months to September 2018 compared with the 12 months to September 2017.
The UK trade in goods deficit narrowed £3.0 billion with EU countries and widened £1.8 billion with countries outside the EU in the 12 months to September 2018.
Exports to EU countries grew by £10.1 billion in the 12 months to September 2018 compared with a £7.1 billion increase in imports. Imports from non-EU countries increased £5.9 billion while exports rose by £4.1 billion.
Figure 7: Changes in UK goods exports, imports and trade balance with EU and non-EU countries, 12 months to September 2018 compared with 12 months to September 2017
Source: Office for National Statistics
Download this chart Figure 7: Changes in UK goods exports, imports and trade balance with EU and non-EU countries, 12 months to September 2018 compared with 12 months to September 2017
Image .csv .xlsFigure 8 shows the percentage split of goods exports and imports by countries inside and outside the EU in the 12 months to September 2018.
In the 12 months to September 2018, of all UK goods imports 54.6% came from EU countries, while 48.9% of goods exports went to the EU. This is broadly unchanged from the 12 months to September 2017, in which 54.6% of goods were imported from the EU while 48.0% of goods were exported to the EU.
To explore what goods we exported and imported to and from certain partner countries in the 12 months to September 2018, see our country by commodity exports and imports datasets. Users should note that these datasets are on a non-seasonally adjusted basis whereas the data referred to in this section are seasonally adjusted.
Figure 8: UK trade in goods exports and imports percentage split by EU and non-EU countries, 12 months to September 2018
Source: Office for National Statistics
Download this chart Figure 8: UK trade in goods exports and imports percentage split by EU and non-EU countries, 12 months to September 2018
Image .csv .xls8. Explore UK trade in goods country-by-commodity data via our interactive tools
For more information about our methods and how we compile these statistics, please see Trade in goods, country-by-commodity experimental data: 2011 to 2016. Users should note that the data published alongside this release are no longer experimental.
What goods does the UK trade with the rest of the world? Our data breaks down UK trade in goods with 234 countries by 125 commodities.
Use our map to get a better understanding of UK trade in goods with a particular country. Select a country by hovering over it or using the drop-down menu.
Embed code
What about trade in a particular commodity? What percentage of UK car exports goes to the EU? Where does the UK's imported tea and coffee come from?
Use our interactive tools to understand UK trade of a particular commodity.
Select a commodity from the drop-down menu, or click through the levels to explore the data.
UK trade in goods by commodity with the rest of the world, imports and exports, 2012 to 2017
UK exports, 2017
Embed code
Embed code
10. Quality and methodology
Trade is measured through both exports and imports of goods and/or services. Data are supplied by over 30 sources including several administrative sources, HM Revenue and Customs (HMRC) being the largest.
This monthly release contains tables showing the total value of trade in goods together with chained volume measures (CVMs) and implied deflators (IDEFs). Figures are analysed by broad commodity group (CVMs and IDEFs) and according to geographical area (values only). In addition, the UK trade statistical bulletin also includes early monthly estimates of the value of trade in services.
Further qualitative data and information can be found in the attached datasets. This includes data on:
Detailed methodological notes are published in the UK Balance of Payments, The Pink Book 2018.
The UK trade methodology web pages have been developed to provide detailed information about the methods used to produce UK trade statistics.
The UK trade Quality and Methodology Information report contains important information on:
the strengths and limitations of the data and how it compares with related data
uses and users of the data
how the output was created
the quality of the output including the accuracy of the data