Cynnwys
- Main points
- Things you need to know about this release
- UK current account deficit widens
- Widening trade deficit as imports increase more than exports
- Smaller direct investment surplus widens deficit on primary income account
- Current account deficit with EU widens while surplus with non-EU narrows
- Financial account shows a net inflow to UK
- International investment position continues to show a net asset position
- Quality and methodology
1. Main points
The UK’s current account deficit was £16.9 billion in Quarter 1 (Jan to Mar) 2017, a widening of £4.8 billion from a deficit of £12.1 billion in Quarter 4 (Oct to Dec) 2016, due predominantly to a widening in the deficit on trade; the current account deficit in Quarter 1 2017 equated to 3.4% of gross domestic product (GDP) at current market prices, up from 2.4% in Quarter 4 2016.
The total trade deficit widened to £8.8 billion in Quarter 1 2017 following a sharp narrowing of the deficit in Quarter 4 2016 (£4.8 billion); this was due to a widening in the deficit on trade in goods and a narrowing in the surplus on trade in services.
The primary income deficit widened to £2.7 billion in Quarter 1 2017 from a 3-year low of £1.0 billion in Quarter 4 2016; this was due to the surplus on the direct investment balance narrowing to £5.3 billion along with the deficit on portfolio investment balance widening to £5.4 billion in Quarter 1 2017.
A current account deficit of £22.2 billion was recorded with the EU in Quarter 1 2017 whilst a surplus of £5.3 billion was recorded with non-EU countries.
The financial account shows a net inflow of £11.4 billion in Quarter 1 2017.
The international investment position shows UK net assets of £415.0 billion at the end of Quarter 1 2017.
2. Things you need to know about this release
In accordance with the National Accounts Revisions Policy, the revisions window is closed for this period and there are no revisions against previously published data.
When we published the Quarter 4 (Oct to Dec) 2016 statistical bulletin we explained that the unusually large net errors and omissions in the financial account were due to the unbalanced reporting of mergers and acquisitions in the period. Since then, we have received further information and have incorporated this into the Quarter 1 (Jan to Mar) 2017 period where necessary. Unfortunately, the closed revisions window this period does not allow us to reflect the new information in Quarter 4 (Oct to Dec) 2016. This will be included when we publish the Quarter 2 (Apr to June) 2017 statistical bulletin on 29 September 2017 when the revisions window is open.
Pre-release access
On 15 June 2017, the National Statistician announced that pre-release access to Office for National Statistics (ONS) statistics will stop with effect from 1 July 2017.
The quarterly balance of payments dataset is produced by ONS with a quality assurance role provided by members of the Government Statistical Service (GSS) working in ONS. Ministers and those officials not directly involved in the production and release of statistics will no longer have access to the bulletin and data tables in advance of publication.
A brief introduction to the UK Balance of Payments provides an overview of the concepts and coverage of the UK Balance of Payments using the Balance of Payments Manual sixth edition.
The Balance of payments (BoP) QMI Quality and Methodology Information document is available.
Also available is an overview of how movements in foreign exchange rates can impact the balance of payments and international investment position.
Nôl i'r tabl cynnwys3. UK current account deficit widens
In Quarter 1 2017, the UK current account deficit was £16.9 billion and equates to 3.4% of gross domestic product (GDP) at current market prices. This was a widening from the deficit of £12.1 billion (2.4% of GDP) in Quarter 4 2016 (Figure 1). The widening in the current account deficit was due mostly to a widening in the deficit on total trade.
Figure 1: UK balances as a percentage of gross domestic product
Quarter 2 (Apr to June) 2014 to Quarter 1 (Jan to Mar) 2017
Source: Office for National Statistics
Notes:
- Q1 refers to Quarter 1 (Jan to Mar), Q2 refers to Quarter 2 (Apr to June), Q3 refers to Quarter 3 (July to Sept) and Q4 refers to Quarter 4 (Oct to Dec).
Download this chart Figure 1: UK balances as a percentage of gross domestic product
Image .csv .xlsThe trade in goods deficit widened by £2.6 billion to £34.3 billion or 6.9% of GDP. This was due to imports increasing by £4.3 billion while exports only increased by £1.7 billion (see section 4 for more information).
In addition to the widening in the trade in goods deficit there was a widening in the deficit on primary income to £2.7 billion (or 0.5% of GDP) in Quarter 1 2017, compared with a deficit of £1.0 billion (or 0.2% of GDP) in Quarter 4 2016 (see section 5 for more information). Additionally, there was a £1.4 billion narrowing in the trade in services surplus to £25.4 billion in Quarter 1 2017 compared with a surplus of £26.8 billion in Quarter 4 2016.
Notes for: UK current account deficit widens
- Throughout this release Quarter 1 refers to January to March, Quarter 2 refers to April to June, Quarter 3 refers to July to September, and Quarter 4 refers to October to December.
4. Widening trade deficit as imports increase more than exports
Figure 2: UK trade in goods and services balances (seasonally adjusted)
Quarter 2 (Apr to June) 2014 to Quarter 1 (Jan to Mar) 2017
Source: Office for National Statistics
Notes:
- Q1 refers to Quarter 1 (Jan to Mar), Q2 refers to Quarter 2 (Apr to June), Q3 refers to Quarter 3 (July to Sept) and Q4 refers to Quarter 4 (Oct to Dec).
Download this chart Figure 2: UK trade in goods and services balances (seasonally adjusted)
Image .csv .xlsThe total trade deficit widened by £4.0 billion to £8.8 billion in Quarter 1 2017, following a sharp narrowing of the deficit in Quarter 4 2016. This was due to a widening in the deficit on trade in goods and a narrowing in the surplus on trade in services.
The widening in the trade in goods deficit was due to imports increasing more than exports. Imports of goods increased by £4.3 billion in Quarter 1 2017 (Figure 2). Of this £4.3 billion; £1.6 billion can be attributed to increases in imports of finished manufactured goods of which £1.4 billion is from the imports of machinery and transport equipment, with £1.0 billion attributed to imports of oil and a further £1.0 billion attributed to semi-manufactured goods.
Exports of goods increased £1.7 billion in Quarter 1 2017 of which exports of finished manufactured goods increased £1.5 billion, exports of oil increased £1.3 billion and semi-manufactured goods increased £0.9 billion. These increases were offset by a decrease in the exports of goods categorised as erratic commodities (for example, non-monetary gold and aircraft), which decreased £2.1 billion.
The trade in services surplus narrowed by £1.4 billion to £25.4 billion in Quarter 1 2017 (Figure 2), this was due to imports increasing £0.6 billion along with exports decreasing £0.8 billion.
The rise in imports was due mostly to imports of other business services, which increased £1.2 billion on the quarter. Partially offsetting this increase were several smaller decreases to imports of services.
The decrease to the exports of services was due mainly to exports of other business services decreasing £0.7 billion as well as exports of insurance and pension services, which decreased £0.6 billion in Quarter 1 2017.
Please note: Erratic series are defined as a specific group of commodities that are both volatile and high in value so impact the overall trade in goods balance. These are defined as ships, aircraft, precious stones, silver and non-monetary gold.
Notes for: Widening trade deficit as imports increase more than exports
- Throughout this release Quarter 1 refers to January to March, Quarter 2 refers to April to June, Quarter 3 refers to July to September, and Quarter 4 refers to October to December.
5. Smaller direct investment surplus widens deficit on primary income account
Figure 3: UK primary income account balances (seasonally adjusted)
Quarter 2 (Apr to June) 2014 to Quarter 1 (Jan to Mar) 2017
Source: Office for National Statistics
Notes:
- Q1 refers to Quarter 1 (Jan to Mar), Q2 refers to Quarter 2 (Apr to June), Q3 refers to Quarter 3 (July to Sept) and Q4 refers to Quarter 4 (Oct to Dec).
Download this chart Figure 3: UK primary income account balances (seasonally adjusted)
Image .csv .xlsThe primary income deficit widened from £1.0 billion in Quarter 4 2016 to £2.7 billion in Quarter 1 2017 (Figure 3), with payments rising by £1.4 billion while receipts fell by £0.3 billion. The widening of the deficit in Quarter 1 2017 was due to the balance on direct investment narrowing to a surplus of £5.3 billion along with the balance on portfolio investment widening to a deficit of £5.4 billion.
The value of earnings on UK foreign direct investment (FDI) abroad (credits) increased over each quarter of 2016, whereas the value of earnings on inward FDI (debits) has remained broadly constant. This has seen the value of UK FDI credits increase to values comparable with those in 2014, as shown in Figure 4. FDI debits have been relatively constant, fluctuating between £10 billion and £16 billion per quarter since the start of 2011. At the same time, the values of FDI credits have fallen from an average of £26.2 billion per quarter in 2011 to £16.3 billion per quarter in 2016.
These trends made the balance on FDI earnings (the difference between credits and debits) a deficit in the final quarter of 2015 and Quarter 1 2016. The balance returned to a surplus from Quarter 2 2016 onwards, making the UK balance on FDI earnings for the whole of 2016 (of £9.5 billion) similar to the level achieved in 2015 (£9.1 billion). The values of FDI credits and debits in the first quarter of 2017 were comparable with the last 2 quarters of 2016. This suggests that the longer-term downward trend in the balance on FDI earnings may have flattened.
Figure 4: Quarterly foreign direct investment earnings (seasonally adjusted)
Quarter 1 (Jan to Mar) 2011 to Quarter 1 (Jan to Mar) 2017
Source: Office for National Statistics
Notes:
- Q1 refers to Quarter 1 (Jan to Mar), Q2 refers to Quarter 2 (Apr to June), Q3 refers to Quarter 3 (July to Sept) and Q4 refers to Quarter 4 (Oct to Dec).
Download this chart Figure 4: Quarterly foreign direct investment earnings (seasonally adjusted)
Image .csv .xlsWe have published more detailed analysis of FDI statistics in a review of UK FDI statistics, which explores some of the factors behind the trends in implied rates of return and the impact of exchange rate changes on UK FDI among other topics.
Notes for: Smaller direct investment surplus widens deficit on primary income account
- Throughout this release Quarter 1 refers to January to March, Quarter 2 refers to April to June, Quarter 3 refers to July to September, and Quarter 4 refers to October to December.
6. Current account deficit with EU widens while surplus with non-EU narrows
A current account deficit of £22.2 billion was recorded with the EU in Quarter 1 2017, compared with a deficit of £19.5 billion in Quarter 4 2016 (Figure 5). The widening in the deficit was due mostly to total primary income switching from a surplus of £1.1 billion in Quarter 4 2016 to a deficit of £2.1 billion in Quarter 1 2017.
Figure 5: UK current account balances with EU and non-EU countries (seasonally adjusted)
Quarter 2 (Apr to June) 2014 to Quarter 1 (Jan to Mar) 2017
Source: Office for National Statistics
Notes:
- Q1 refers to Quarter 1 (Jan to Mar), Q2 refers to Quarter 2 (Apr to June), Q3 refers to Quarter 3 (July to Sept) and Q4 refers to Quarter 4 (Oct to Dec).
Download this chart Figure 5: UK current account balances with EU and non-EU countries (seasonally adjusted)
Image .csv .xlsThe current account surplus with non-EU countries narrowed from £7.4 billion in Quarter 4 2016 to £5.3 billion in Quarter 1 2017. This was due mainly to the movements in trade as the deficit on goods widened and the surplus on services narrowed leading to the total trade surplus of £13.6 billion in Quarter 4 2016 narrowing to £9.2 billion in Quarter 1 2017. Partially offsetting trade was a narrowing in the deficit on primary income from £2.2 billion in Quarter 4 2016 to £0.6 billion in Quarter 1 2017.
Notes for: Current account deficit with EU widens while surplus with non-EU narrows
- Throughout this release Quarter 1 refers to January to March, Quarter 2 refers to April to June, Quarter 3 refers to July to September, and Quarter 4 refers to October to December.
7. Financial account shows a net inflow to UK
Figure 6: UK financial account balances (not seasonally adjusted)
Quarter 2 (Apr to June) 2014 to Quarter 1 (Jan to Mar) 2017
Source: Office for National Statistics
Notes:
- Q1 refers to Quarter 1 (Jan to Mar), Q2 refers to Quarter 2 (Apr to June), Q3 refers to Quarter 3 (July to Sept) and Q4 refers to Quarter 4 (Oct to Dec).
- Total includes reserve assets.
Download this chart Figure 6: UK financial account balances (not seasonally adjusted)
Image .csv .xlsThe total financial account showed a net inflow (that is, more money flowing into the UK) of £11.4 billion in Quarter 1 2017 compared with a net inflow of £53.0 billion in Quarter 4 2016 (Figure 6).
In Quarter 1 2017, direct investment recorded a net outflow of £20.1 billion as foreign investment into the UK slowed following large inward investment in 2016. The last time the UK was a net investor was in Quarter 4 2015 when a net investment of £10.6 billion was recorded.
Portfolio investment recorded a net inflow (that is, more money flowing into the UK) of £22.3 billion in Quarter 1 2017 compared with a net outflow of £8.1 billion in Quarter 4 2016.
Financial derivatives and employee stock options showed net settlement receipts of £5.6 billion in Quarter 1 2017 following net settlement receipts of £0.1 billion in Quarter 4 2016.
Other investment in Quarter 1 2017 recorded a net inflow (that is, more money flowing into the UK) of £18.9 billion compared with a net outflow (that is, more money flowing out of the UK) of £49.7 billion in Quarter 4 2016.
Reserve assets showed net investment of £4.1 billion in Quarter 1 2017.
Notes for: Financial account shows net inflow to UK
- Throughout this release Quarter 1 refers to January to March, Quarter 2 refers to April to June, Quarter 3 refers to July to September, and Quarter 4 refers to October to December.
8. International investment position continues to show a net asset position
Figure 7: UK international investment position (not seasonally adjusted)
Quarter 2 (Apr to June) 2014 to Quarter 1 (Jan to Mar) 2017
Source: Office for National Statistics
Notes:
- Q1 refers to Quarter 1 (Jan to Mar), Q2 refers to Quarter 2 (Apr to June), Q3 refers to Quarter 3 (July to Sept) and Q4 refers to Quarter 4 (Oct to Dec).
Download this chart Figure 7: UK international investment position (not seasonally adjusted)
Image .csv .xlsThe international investment position showed net external assets (that is, assets exceed liabilities) of £415.0 billion at the end of Quarter 1 2017, compared with net external assets of £468.5 billion at the end of Quarter 4 2016 (Figure 7).
UK assets fell by £252.0 billion to £10,848.6 billion in Quarter 1 2017. UK external liabilities dropped £198.4 billion in Quarter 1 2017 to £10,433.7 billion, the lowest levels since Quarter 1 2016.
The fall in both UK assets and UK liabilities was due mainly to a decline in financial derivatives with the latest figure for UK assets dropping by £335.2 billion to £2,167.8 billion (the lowest value since Quarter 2 2008, which was £2,063.7 billion) and the latest figure for UK liabilities falling by £336.1 billion to £2,148.3 billion (the lowest value since Quarter 2 2014, which was recorded as £2,129.1 billion).
Figure 8: Sterling exchange rates with major trading partners
Quarter 3 (July to Sept) 2012 to Quarter 1 (Jan to Mar) 2017

Source: Office for National Statistics
Notes:
- Q1 refers to Quarter 1 (Jan to Mar), Q2 refers to Quarter 2 (Apr to June), Q3 refers to Quarter 3 (July to Sept) and Q4 refers to Quarter 4 (Oct to Dec).
Download this image Figure 8: Sterling exchange rates with major trading partners
.png (23.5 kB) .xls (28.7 kB)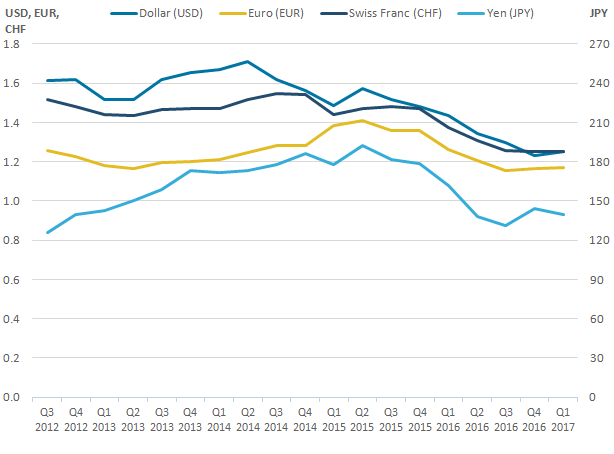
Figure 8 presents sterling exchange rates against the currencies of major trading partner countries at the close of markets at each quarter end. During Quarter 1 2017, sterling’s depreciation against a basket of foreign currencies steadied and appreciated against several currencies including the United States dollar. Sterling only showed a noticeable depreciation against the Japanese yen in Quarter 1 2017, but is still stronger than Quarter 3 2016.
The stock of UK assets and liabilities with the rest of the world can be influenced by movements in exchange rates and price revaluations. On balance, exchange rate movements in Quarter 1 have had less of an impact than the previous year. Table 1 summarises which type of investment is impacted by these changes.
Table 1: Revaluation impacts on investments, UK, Quarter 1 (Jan to Mar) 2017
| Assets | Liabilities | |||
| Exchange rate movements | Price revaluations | Exchange rate movements | Price revaluations | |
| Direct Investment | Impact | Impact | No impact | Impact |
| Portfolio Investment | ||||
| Equities | Impact | Impact | No impact | Impact |
| Debt Securities | Impact | Impact | No impact | Impact |
| Other Investment | ||||
| Deposits | Impact | No impact | Impact | No impact |
| Loans | Impact | No impact | Impact | No impact |
| Source: Office for National Statistics | ||||
Download this table Table 1: Revaluation impacts on investments, UK, Quarter 1 (Jan to Mar) 2017
.xls (26.6 kB)Notes for: International investment position continues to record a net asset position
- Throughout this release Quarter 1 refers to January to March, Quarter 2 refers to April to June, Quarter 3 refers to July to September, and Quarter 4 refers to October to December.
9. Quality and methodology
The Balance of payments (BoP) Quality and Methodology Information document contains important information on:
the strengths and limitations of the data and how it compares with related data
uses and users of the data
how the output was created
the quality of the output including the accuracy of the data