Cynnwys
- Main points
- Summary
- Current account balances as percentage of GDP
- Current account with EU and non-EU countries (Table C)
- Trade in goods (Table E) and services (Table F)
- Primary income account (Table G)
- Secondary income account (Table H)
- Capital account (Table I)
- Financial account (Table J)
- International investment position (Table K)
- Summary of revisions
- Background notes
- Methodoleg
1. Main points
The United Kingdom’s (UK) current account deficit was £32.6 billion in Quarter 1 (January to March) 2016, down from a revised deficit of £34.0 billion in Quarter 4 (October to December) 2015. The deficit in Quarter 1 (January to March) 2016 equated to 6.9% of gross domestic product (GDP) at current market prices, down from 7.2% in Quarter 4 (October to December) 2015, which remains the largest proportion since quarterly records began in 1955.
The narrowing in the current account deficit was mainly due to a narrowing in the deficits on secondary income and primary income, partially offset by a slight widening in the total trade deficit.
The total trade deficit widened to £12.0 billion in Quarter 1 (January to March) 2016, from £11.6 billion in Quarter 4 (October to December) 2015. This was due to the trade in services surplus narrowing by £0.5 billion, partially offset by a slight narrowing in the trade in goods deficit (£0.1 billion).
The primary income deficit narrowed slightly to £14.9 billion in Quarter 1 (January to March) 2016, from £15.1 billion in Quarter 4 (October to December) 2015. The small narrowing was mainly due to a narrowing in the deficits on portfolio investment and other investment. These were partially offset by a widening in the deficit on direct investment.
The deficit on secondary income narrowed by £1.6 billion, from £7.3 billion in Quarter 4 (October to December) 2015 to £5.7 billion in Quarter 1 (January to March) 2016. This was due to payments decreasing more than receipts.
The financial account recorded a net inflow of £33.9 billion during Quarter 1 (January to March) 2016.
The international investment position recorded UK net liabilities of £127.8 billion at the end of Quarter 1 (January to March) 2016.
Nôl i'r tabl cynnwys2. Summary
The balance of payments summarises the economic transactions of the UK with the rest of the world. These transactions can be broken down into 3 main accounts: the current account, the capital account and the financial account.
The current account comprises the trade in goods and services account, the primary income account and secondary income account. The difference in the monetary value of these accounts is known as the current account balance. A current account balance is in surplus if overall credits exceed debits, and in deficit if overall debits exceed credits.
The sum of the current and capital account balances are equal to the balance of the financial account. As the capital account is relatively small in comparison, the current account and financial account can be said to be counterparts.
The current account balance plus the capital account balance measures the extent to which the UK is a net lender (that is, in surplus) or net borrower (that is, in deficit). The UK has run a combined current and capital account deficit in every year since 1983, and every quarter since Quarter 3 1998.
Figure 1: UK current account balances (seasonally adjusted), Quarter 2 (Apr to June) 2013 to Quarter 1 (Jan to Mar) 2016
Source: Office for National Statistics
Notes:
- Q1 refers to Quarter 1 (Jan to Mar), Q2 refers to Quarter 2 (Apr to June), Q3 refers to Quarter 3 (July to Sept) and Q4 refers to Quarter 4 (Oct to Dec).
Download this chart Figure 1: UK current account balances (seasonally adjusted), Quarter 2 (Apr to June) 2013 to Quarter 1 (Jan to Mar) 2016
Image .csv .xlsQuarter 1 2016 overview
In Quarter 1 2016, the UK was a net borrower of £32.4 billion, down from £34.4 billion in Quarter 4 2015. This was due to the narrowing in the current account deficit of £1.4 billion and a switch in the capital account from a deficit of £0.5 billion in Quarter 4 2015 to a surplus of £0.2 billion in Quarter 1 2016.
The £0.4 billion widening in the total trade deficit was mainly due to a narrowing of £0.5 billion in the trade in services surplus, as exports decreased by £0.5 billion and imports remained virtually unchanged from Quarter 4 2015. Partially offsetting this was a slight narrowing in the deficit on trade in goods of £0.1 billion. The narrowing in the trade in goods deficit was due to exports increasing by £0.9 billion while imports rose by £0.8 billion.
The £0.2 billion narrowing in the total primary income deficit from Quarter 4 2015 was mainly due to the narrowing in the deficits on portfolio investment and other investment of £0.8 billion and £0.3 billion respectively. Partially offsetting the improvement in the portfolio investment and other investment balances in Quarter 1 2016 was a further deterioration in the balance on income of direct investment of £1.0 billion.
The £1.6 billion narrowing in the secondary income deficit in Quarter 1 2016 to £5.7 billion was due to payments decreasing more than receipts.
Notes for Summary
- Throughout this release Quarter 1 refers to January to March, Quarter 2 refers to April to June, Quarter 3 refers to July to September, and Quarter 4 refers to October to December.
3. Current account balances as percentage of GDP
Figure 2: UK balances as percentage of GDP, Quarter 2 (Apr to June) 2013 to Quarter 1 (Jan to Mar) 2016
Source: Office for National Statistics
Notes:
- Q1 refers to Quarter 1 (Jan to Mar), Q2 refers to Quarter 2 (Apr to June), Q3 refers to Quarter 3 (July to Sept) and Q4 refers to Quarter 4 (Oct to Dec).
Download this chart Figure 2: UK balances as percentage of GDP, Quarter 2 (Apr to June) 2013 to Quarter 1 (Jan to Mar) 2016
Image .csv .xlsThe current account deficit equated to 6.9% of gross domestic product (GDP) at current market prices in Quarter 1 2016, compared with 7.2% in Quarter 4 2015. The deficit on trade in goods and services was equivalent to 2.5% of GDP in Quarter 1 2016, unchanged from Quarter 4 2015. The deficit on primary income equated to 3.1% of GDP in Quarter 1 2016, compared with a deficit equivalent to 3.2% in Quarter 4 2015. The deficit on secondary income equated to 1.2% of GDP in Quarter 1 2016, compared with 1.5% in Quarter 4 2015.
Notes for Current account balances as percentage of GDP
- Throughout this release Quarter 1 refers to January to March, Quarter 2 refers to April to June, Quarter 3 refers to July to September, and Quarter 4 refers to October to December.
4. Current account with EU and non-EU countries (Table C)
Figure 3: UK current account balances with EU and non-EU countries (seasonally adjusted), Quarter 2 (Apr to June) 2013 to Quarter 1 (Jan to Mar) 2016
Source: Office for National Statistics
Notes:
- Q1 refers to Quarter 1 (Jan to Mar), Q2 refers to Quarter 2 (Apr to June), Q3 refers to Quarter 3 (July to Sept) and Q4 refers to Quarter 4 (Oct to Dec).
Download this chart Figure 3: UK current account balances with EU and non-EU countries (seasonally adjusted), Quarter 2 (Apr to June) 2013 to Quarter 1 (Jan to Mar) 2016
Image .csv .xlsA current account deficit of £29.2 billion was recorded with the EU in Quarter 1 2016, compared with a deficit of £30.0 billion in Quarter 4 2015. This was mainly due to the deficit on secondary income narrowing from £3.6 billion in Quarter 4 2015 to £2.6 billion in Quarter 1 2016. Additionally, the deficit on total trade narrowed from £18.1 billion in Quarter 4 2015 to £17.6 billion in Quarter 1 2016. Partially offsetting these was a slight widening in the deficit on primary income from £8.3 billion in Quarter 4 2015 to £9.0 billion in Quarter 1 2016.
The current account deficit with non-EU countries also narrowed from £4.0 billion in Quarter 4 2015 to a deficit of £3.4 billion in Quarter 1 2016. This was mainly due to the primary income deficit narrowing from £6.7 billion in Quarter 4 2015 to a deficit of £5.9 billion in Quarter 1 2016. Additionally, the deficit on secondary income narrowed from £3.7 billion in Quarter 4 2015 to £3.1 billion in Quarter 1 2016. Partially offsetting these was a narrowing in the surplus on total trade from £6.5 billion in Quarter 4 2015 to £5.6 billion in Quarter 1 2016.
Notes for Current account with EU and non-EU countries (Table C)
- Throughout this release Quarter 1 refers to January to March, Quarter 2 refers to April to June, Quarter 3 refers to July to September, and Quarter 4 refers to October to December.
5. Trade in goods (Table E) and services (Table F)
Figure 4: UK trade in goods and services balances (seasonally adjusted), Quarter 2 (Apr to June) 2013 to Quarter 1 (Jan to Mar) 2016
Source: Office for National Statistics
Notes:
- Q1 refers to Quarter 1 (Jan to Mar), Q2 refers to Quarter 2 (Apr to June), Q3 refers to Quarter 3 (July to Sept) and Q4 refers to Quarter 4 (Oct to Dec).
Download this chart Figure 4: UK trade in goods and services balances (seasonally adjusted), Quarter 2 (Apr to June) 2013 to Quarter 1 (Jan to Mar) 2016
Image .csv .xlsTrade in goods covers transactions in general merchandise for which changes of ownership occur between UK residents and the rest of the world. General merchandise (with some exceptions) refers to moveable goods.
The trade in goods deficit in Quarter 1 2016 was £34.3 billion, slightly narrower than the £34.4 billion deficit recorded in Quarter 4 2015. The slight narrowing in the deficit in Quarter 1 2016 was due to exports rising by £0.9 billion while imports rose by £0.8 billion.
The increase in exports was mainly attributed to a £0.8 billion increase in chemicals and a £0.4 billion increase in cars. These increases were partially offset by a £0.5 billion decrease in exports of oil.
The increase in imports was primarily due to a £1.3 billion rise in mechanical machinery. There were also rises in miscellaneous manufactures (£0.8 billion) and unspecified goods (£0.6 billion). These increases were partially offset by falls in imports of oil (£1.3 billion) and food and live animals (£0.7 billion).
Trade in services covers the provision of services by UK residents to non-residents and vice versa. It also covers transactions in goods which are not freighted out of the country in which transactions take place, for example, purchases for local use by foreign forces in the UK, or by UK forces abroad and purchases by tourists. Transactions in goods which are freighted into or out of the UK are included under trade in goods.
The trade in services surplus was £22.3 billion in Quarter 1 2016, a decrease of £0.5 billion from Quarter 4 2015. Exports fell by £0.5 billion from Quarter 4 2015, to £57.9 billion, with imports almost unchanged from Quarter 4 2015, at £35.6 billion.
The fall in exports was mainly due to a fall in the export of other business services of £3.1 billion. Partially offsetting this was a rise in the export of most other types of services such as telecommunication, computer and information services rising by £0.8 billion, transport services rising by £0.7 billion and manufacturing and maintenance services rising by £0.6 billion.
While total imports of services remained almost unchanged there were offsetting increases and decreases within the components, the most notable movement being a decrease of £1.4 billion in the import of travel services. This decrease was offset by smaller increases in most services such as an increase of £0.6 billion in the imports of other business services.
Notes for Trade in goods (Table E) and services (Table F)
- Throughout this release Quarter 1 refers to January to March, Quarter 2 refers to April to June, Quarter 3 refers to July to September, and Quarter 4 refers to October to December.
6. Primary income account (Table G)
Figure 5: UK primary income account balances (seasonally adjusted), Quarter 2 (Apr to June) 2013 to Quarter 1 (Jan to Mar) 2016
Source: Office for National Statistics
Notes:
- Q1 refers to Quarter 1 (Jan to Mar), Q2 refers to Quarter 2 (Apr to June), Q3 refers to Quarter 3 (July to Sept) and Q4 refers to Quarter 4 (Oct to Dec).
Download this chart Figure 5: UK primary income account balances (seasonally adjusted), Quarter 2 (Apr to June) 2013 to Quarter 1 (Jan to Mar) 2016
Image .csv .xlsThe primary income account is comprised of compensation of employees, investment income and other primary income.
Compensation of employees presents remuneration in return for the labour input into the production process contributed by an individual. In the international accounts, compensation of employees is recorded when the employer (the producing unit) and the employee are resident in different economies.
Investment income covers earnings (for example, profits, dividends and interest payments and receipts) arising from foreign investment in financial assets and liabilities. Credits are the earnings of UK residents from their investments abroad and other foreign assets. Debits are the earnings of foreign residents from their investments in the UK and other UK liabilities. The flow of investment in the financial account is recorded separately from earnings, although reinvested earnings of companies with foreign affiliates are a component of both. The total value of UK assets and liabilities held at any time is also recorded separately under the international investment position.
Other primary income covers earnings from rent and taxes, and subsidies on production and on the import of goods. Under the Balance of Payments Manual fifth edition, taxes and subsidies on production and on the import of goods were classified to secondary income (previously titled current transfers). The recording of rent was previously classified to other investment income.
The primary income deficit narrowed slightly from £15.1 billion in Quarter 4 2015, to £14.9 billion in Quarter 1 2016.
The balance on compensation of employees recorded a deficit of £43 million in Quarter 1 2016, a narrowing from a deficit of £73 million in Quarter 4 2015.
The balance on direct investment income widened from a deficit of £6.2 billion in Quarter 4 2015, to a deficit of £7.2 billion in Quarter 1 2016. The widening was due to receipts falling £2.7 billion from Quarter 4 2015 to £10.2 billion in Quarter 1 2016, while payments only fell £1.7 billion from Quarter 4 2015 to £17.4 billion in Quarter 1 2016.
The fall in total UK receipts from direct investment abroad during Quarter 1 2016 (£2.7 billion) was broad-based with all sectors recording a decrease in earnings except for monetary financial institutions which recorded a small increase (£0.2 billion). The largest decreases in receipts were reported by private non-financial corporations (£2.2 billion) and insurance companies (£0.7 billion).
Apart from UK monetary financial institutions all other UK sectors recorded decreased payments to their foreign direct investors in Quarter 1 2016, notably private non-financial corporations (£0.6 billion) and other financial intermediaries (£0.5 billion).
The deterioration in Quarter 1 2016 of the balance on direct investment income reflects a recent downward trend. On an annual basis, the value of the stock of UK foreign direct investment (FDI) assets rose to £1,397 billion in 2015, up £13 billion on the 2014 level. Despite the rise in assets, the value of credits continued to follow a downward trend in 2015, falling by £5 billion to £66 billion. This marks the fourth consecutive decline since 2011, when credits were £105 billion.
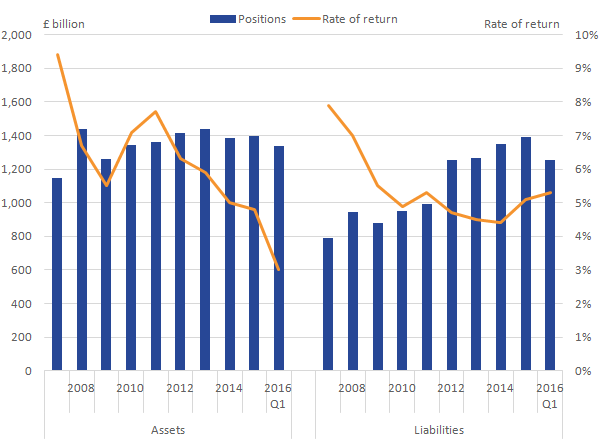
Figure 6: UK direct investment positions and rates of return (non-seasonally adjusted), 2007 to Quarter 1 (Jan to Mar) 2016
Source: Office for National Statistics
Notes:
- Q1 refers to Quarter 1 (Jan to Mar), Q2 refers to Quarter 2 (Apr to June), Q3 refers to Quarter 3 (July to Sept) and Q4 refers to Quarter 4 (Oct to Dec).
- Rates of return are calculated using the income data from Table G and a rolling average of the international investment position from Table K.
Download this image Figure 6: UK direct investment positions and rates of return (non-seasonally adjusted), 2007 to Quarter 1 (Jan to Mar) 2016
.png (26.4 kB) .xls (27.1 kB)
The decline in credits over this period largely reflects continuing deteriorations in rates of return, which have fallen from a peak of 7.7% in 2011 to 5.0% in 2014, and have fallen further in 2015 to 4.8%. Annualised rates of return for Quarter 1 2016 indicate a further decline in the rate of return, having fallen to an estimated 3.0%.
The value of the stock of UK FDI liabilities in 2015 recorded a further rise of £40 billion to £1,390 billion. The value of debits also recorded a further increase, rising by £12 billion to £69 billion. The rise in debits since 2011 has been largely driven by increases in the level of UK liabilities as the indicative rates of return have fallen over the same period from 5.3% in 2011 to 4.4% in 2014. This fall was smaller when compared to the fall in the rate of return on assets. In contrast to assets, the rate of return on liabilities has improved in recent quarters, and increased to 5.1% in 2015.
Annualised earnings estimates for Quarter 1 2016 suggest that rates of return have increased further, rising to 5.3% for the first quarter.
In this publication we have implemented the foreign direct investment annual benchmark data, please see background notes, “What’s new? This quarter” for further information.
The portfolio investment income deficit narrowed by £0.8 billion between Quarter 4 2015 and Quarter 1 2016, to £5.0 billion. This was due to a narrowing in the deficit in both equity securities and debt securities of £0.3 billion and £0.5 billion respectively.
The deficit on earnings from other investment also narrowed slightly (£0.3 billion), to £2.6 billion in Quarter 1 2016.
The deficit on other primary income was £0.3 billion in Quarter 1 2016, virtually unchanged from Quarter 4 2015.
Notes for Primary income account (Table G)
- Throughout this release Quarter 1 refers to January to March, Quarter 2 refers to April to June, Quarter 3 refers to July to September, and Quarter 4 refers to October to December.
7. Secondary income account (Table H)
Figure 7: UK secondary income balance (seasonally adjusted), Quarter 2 (Apr to June) 2013 to Quarter 1 (Jan to Mar) 2016
Source: Office for National Statistics
Notes:
- Q1 refers to Quarter 1 (Jan to Mar), Q2 refers to Quarter 2 (Apr to June), Q3 refers to Quarter 3 (July to Sept) and Q4 refers to Quarter 4 (Oct to Dec).
Download this chart Figure 7: UK secondary income balance (seasonally adjusted), Quarter 2 (Apr to June) 2013 to Quarter 1 (Jan to Mar) 2016
Image .csv .xlsSecondary income represents the provision (or receipt) of an economic value by one party without directly receiving (or providing) a counterpart item of economic value. In plain terms, this is a transaction representing “something for nothing” or without a quid pro quo. Transfers can be in the form of money or of goods or services provided without the expectation of payment. General government transfers include receipts, contributions and subscriptions from or to European Union (EU) institutions and other international bodies, bilateral aid and military grants.
The deficit on secondary income narrowed from £7.3 billion in Quarter 4 2015 to £5.7 billion in Quarter 1 2016. This was due to payments decreasing more than receipts.
It should be noted that the quarterly path of net contributions to EU institutions can be erratic due to the timing of payments.
Notes for Secondary income account (Table H)
- Throughout this release Quarter 1 refers to January to March, Quarter 2 refers to April to June, Quarter 3 refers to July to September, and Quarter 4 refers to October to December.
8. Capital account (Table I)
The capital account comprises 2 components: capital transfers and the acquisition or disposal of non-produced, non-financial assets.
Under BPM6, there is no longer a requirement to record migrant transfers. The manual clarifies that the change in the residence does not involve a transaction between 2 entities but a change in status.
Capital transfers are those involving transfers of ownership of fixed assets, transfers of funds associated with the acquisition or disposal of fixed assets, and cancellation of liabilities by creditors without any counterparts being received in return. As with current transfers, they can be subdivided into general government transfers and other sectors transfers. The main sources of information are government departments (Department for International Development and HM Treasury) and the Bank of England. Compensation payments from the EU are also included here, for example, payments related to the destruction of animals to combat BSE and foot and mouth disease.
The sale or purchase of non-produced, non-financial assets covers intangibles such as patents, copyrights, franchises, leases and other transferable contracts, and goodwill. It also covers transactions involving tangible assets that may be used or needed for the production of goods and services but have not themselves been produced, such as land and sub-soil assets. The use of such assets is recorded under trade in services as royalties and license fees; only the outright purchase or sale of such assets is recorded in the capital account.
The capital account recorded a surplus of £0.2 billion in Quarter 1 (January to March) 2016, a switch from a deficit of £0.5 billion in Quarter 4 (October to December) 2015.
Nôl i'r tabl cynnwys9. Financial account (Table J)
Figure 8: UK financial account balances (not seasonally adjusted), Quarter 2 (Apr to June) 2013 to Quarter 1 (Jan to Mar) 2016
Source: Office for National Statistics
Notes:
- Q1 refers to Quarter 1 (Jan to Mar), Q2 refers to Quarter 2 (Apr to June), Q3 refers to Quarter 3 (July to Sept) and Q4 refers to Quarter 4 (Oct to Dec).
Download this chart Figure 8: UK financial account balances (not seasonally adjusted), Quarter 2 (Apr to June) 2013 to Quarter 1 (Jan to Mar) 2016
Image .csv .xlsThe financial account covers transactions that result in a change of ownership of financial assets and liabilities between UK residents and non-residents, for example, the acquisitions and disposals of foreign shares by UK residents.
The total financial account showed a net inflow (that is, more money flowing into the UK) of £33.9 billion in Quarter 1 2016, compared with a net inflow of £42.0 billion in Quarter 4 2015.
Direct investment recorded a net inflow (that is, more money flowing into the UK) of £61.0 billion in Quarter 1 2016, compared with a net inflow of £5.4 billion in Quarter 4 2015.
For further information on the impact of foreign direct investment acquisitions and disposals, please see background notes, understanding the data, part 2 interpreting the data. In this publication we have implemented the foreign direct investment annual benchmark data, please see background notes, “What’s new? This quarter” for further information.
Portfolio investment recorded a net inflow (that is, more money flowing into the UK) of £33.4 billion in Quarter 1 2016, a decrease from a net inflow of £71.8 billion in Quarter 4 2015. The decreased inflow in portfolio investment was mainly due to non-residents switching from net investment of £77.2 billion in Quarter 4 2015 to net disinvestment of £11.9 billion in Quarter 1 2016. UK residents also switched from net investment of £5.4 billion to net disinvestment of £45.4 billion over the same time period.
Financial derivatives and employee stock options showed net settlement receipts of £36.2 billion in Quarter 1 2016, following net settlement payments of £7.5 billion in Quarter 4 2015.
Other investment in Quarter 1 2016 recorded a net outflow (that is, more money flowing from the UK) of £22.1 billion, compared with a net outflow of £40.6 billion in Quarter 4 2015.
Reserve assets showed net investment of £2.3 billion in Quarter 1 2016, a slight increase from net investment of £2.1 billion in Quarter 4 2015.
Nôl i'r tabl cynnwys10. International investment position (Table K)
Figure 9: UK net international investment position (not seasonally adjusted), Quarter 2 (Apr to June) 2013 to Quarter 1 (Jan to Mar) 2016
Source: Office for National Statistics
Notes:
- Q1 refers to Quarter 1 (Jan to Mar), Q2 refers to Quarter 2 (Apr to June), Q3 refers to Quarter 3 (July to Sept) and Q4 refers to Quarter 4 (Oct to Dec).
Download this chart Figure 9: UK net international investment position (not seasonally adjusted), Quarter 2 (Apr to June) 2013 to Quarter 1 (Jan to Mar) 2016
Image .csv .xlsThe international investment position brings together the available estimates of the levels of identified UK external assets (foreign assets owned by UK residents) and identified UK external liabilities (UK assets owned by foreign residents) at the end of each calendar period.
The international investment position showed net external liabilities (that is, liabilities exceed assets) of £127.8 billion at the end of Quarter 1 2016, compared with net external liabilities of £269.1 billion at the end of Quarter 4 2015.
UK external assets abroad increased by £405.5 billion from the end of Quarter 4 2015, to a level of £10,272.1 billion at the end of Quarter 1 2016. The increase in the stock of UK external assets in Quarter 1 2016 was mainly due to an increase in the stock of financial derivatives and employee stock options, portfolio investment and other investment. Partially offsetting these was a decrease in the stock of direct investment.
UK external liabilities increased by £264.2 billion in Quarter 1 2016, to a level of £10,399.9 billion. The increase in UK external liabilities in Quarter 1 2016 was mainly due to an increase in the stock of financial derivatives and employee stock options, portfolio investment and other investment in the UK. Partially offsetting these was a decrease in the stock of direct investment.
Notes for International investment position (Table K)
- Throughout this release Quarter 1 refers to January to March, Quarter 2 refers to April to June, Quarter 3 refers to July to September, and Quarter 4 refers to October to December.
11. Summary of revisions
Data in this release have been revised from Quarter 1 (Jan to Mar) 1997. Revisions tables are included in the balance of payments reference tables (Tables R1, R2 and R3). A detailed assessment of indicative changes to the Balance of Payments and International Investment Position annually for 1997 to 2014 can be found in an article published on 7 June 2016.
The changes and improvements implemented in this release and set out in the impact article can be split into 2 categories:
improvements as a result of adhering to European System of Accounts 2010 (ESA10) international standards, which have been incorporated into this release and are consistent with the National Accounts and Balance of Payments in Blue Book 2016 and Pink Book 2016
other regular improvements, methodological changes and corrections
Table 1 summarises the impact of these changes on 2015.
Table 1: Summary of impact by change on 2015
| Change | Summary of change | Impact 2015 | |
| Current account impacting changes | |||
| Improvements to the method for estimating the value of imputed rental on second homes in the UK and abroad. | Improvements to the value of imputed rental on second homes in the UK impacted the value of inward imputed rental and outward imputed rental. | Current account impacts: Trade balance Revision of £0.7 billion | |
| UK listed shares and mutual funds and bonds. | An issue was identified with the levels of shares, mutual funds and bonds. These levels are under-reported in most periods from 2011 onwards. This issue also affects unlisted shares (minimal impact) and the level of dividend and bond interest receipts between sectors. | Current account impacts: Primary income balance Revision of -£2.4 billion Other impacts: Financial account and International Investment Position | |
| Source: Office for National Statistics | |||
Download this table Table 1: Summary of impact by change on 2015
.xls (26.1 kB)In addition to changes highlighted above which are due to improvements, methodological changes and corrections, which have carried through to Quarter 1 2016, revisions are also due to:
Trade in goods – Revisions from Quarter 1 (Jan to Mar) 2015 reflect revised data from HM Revenue and Customs and other data suppliers, revised estimates of trading associated with VAT Missing Trader Intra-Community (MTIC) fraud, revised survey data on trade prices and a reassessment of seasonal factors. Further information on trade is available in the UK Trade April 2016 statistical bulletin.
Trade in services – Revisions from Quarter 1 (Jan to Mar) 2015 are due to updated transport survey information and administrative sources and a reassessment of seasonal factors.
Secondary income account – Revisions to the secondary income account are due to revised source data for transfers involving the UK government, the use of the latest data for various ONS surveys and a reassessment of seasonal factors.
Capital account – Revisions to the capital account are attributable to revised source data from HM Treasury and the ONS International Trade in Services survey.
Primary income, financial account and international investment position – Revisions from Quarter 1 (Jan to Mar) 2015 reflect new and revised survey data, a reassessment of coverage adjustments to data from the Bank for International Settlements and a reassessment of seasonal factors. Revisions also reflect new estimates from the Bank for International Settlements.
Quarterly revisions to the current account balance as a percentage of GDP – Revisions to the current account balance as a percentage of GDP in this release may be due to revisions to the current account detailed above and / or changes to nominal GDP.
Table 2 provides revisions to the current account balance as a percentage of GDP annually between 2012 to 2015 and quarterly between Quarter 1 2013 to Quarter 4 2015.
Table 2: UK Balance of Payments revisions to current account balance as a percentage of GDP, Quarter 1 (Jan to Mar) 2016
| % | |||||
| Period | Current account balance as a percentage of GDP previously published | Current account balance as a percentage of GDP latest estimate | Total current account balance as a percentage of GDP revisions (percentage points) | ||
| 2012 | -3.3 | -3.7 | -0.4 | ||
| 2013 | -4.5 | -4.4 | 0.1 | ||
| 2014 | -5.1 | -4.7 | 0.4 | ||
| 2015 | -5.2 | -5.4 | -0.2 | ||
| 2013 Q1 | -4.2 | -3.7 | 0.5 | ||
| 2013 Q2 | -3.2 | -3.2 | 0.0 | ||
| 2013 Q3 | -4.6 | -4.7 | -0.1 | ||
| 2013 Q4 | -6.0 | -6.0 | 0.0 | ||
| 2014 Q1 | -4.5 | -4.7 | -0.2 | ||
| 2014 Q2 | -4.1 | -3.9 | 0.2 | ||
| 2014 Q3 | -5.5 | -4.6 | 0.9 | ||
| 2014 Q4 | -6.2 | -5.4 | 0.8 | ||
| 2015 Q1 | -5.3 | -5.4 | -0.1 | ||
| 2015 Q2 | -4.1 | -4.2 | -0.1 | ||
| 2015 Q3 | -4.3 | -4.7 | -0.4 | ||
| 2015 Q4 | -7.0 | -7.2 | -0.2 | ||
| Source: Office for National Statistics | |||||
| Note: | |||||
| 1. Q1 refers to Quarter 1 (Jan to Mar), Q2 refers to Quarter 2 (Apr to June), Q3 refers to Quarter 3 (July to Sept) and Q4 refers to Quarter 4 (Oct to Dec). | |||||