Cynnwys
- Main points
- Review of how economic statistics are published
- Summary
- Current account balances as percentage of GDP
- Current account with EU and non-EU countries (Table C)
- Trade in goods (Table E) and services (Table F)
- Primary income account (Table G)
- Secondary income account (Table H)
- Capital account (Table I)
- Financial account (Table J)
- International investment position (Table K)
- Summary of revisions
- Quality and methodology
- Background notes
1. Main points
The UK’s current account deficit was £28.7 billion in Quarter 2 (April to June) 2016, up from a revised deficit of £27.0 billion in Quarter 1 (January to March) 2016. The deficit in Quarter 2 2016 equated to 5.9% of gross domestic product (GDP) at current market prices, up from 5.7% in Quarter 1 2016.
The widening in the current account deficit was mainly due to a widening in the deficits on trade and secondary income, partially offset by a narrowing in the primary income deficit.
The total trade deficit widened to £12.7 billion in Quarter 2 2016, from £10.0 billion in Quarter 1 2016. This was due to the trade in goods deficit widening by £1.8 billion and a £0.9 billion narrowing in the trade in services surplus.
The primary income deficit narrowed to £10.0 billion in Quarter 2 2016, from £11.5 billion in Quarter 1 2016. The narrowing was mainly due to a narrowing in the deficit on direct investment, partially offset by a slight widening in the deficit on portfolio investment.
The deficit on secondary income widened by £0.5 billion, from £5.5 billion in Quarter 1 2016 to £6.0 billion in Quarter 2 2016. This was due to payments increasing while receipts were virtually unchanged.
The financial account recorded a net inflow of £14.5 billion during Quarter 2 2016.
The international investment position recorded UK net liabilities of £57.0 billion at the end of Quarter 2 2016.
Nôl i'r tabl cynnwys2. Review of how economic statistics are published
From January 2017 we are improving the way we publish economic statistics, with related data grouped together under new "theme" days. This will increase the coherence of our data releases and involve minor changes to the timing of certain publications. For more information see Changes to publication schedule for economic statistics.
Nôl i'r tabl cynnwys3. Summary
The balance of payments summarises the economic transactions of the UK with the rest of the world. These transactions can be broken down into 3 main accounts: the current account, the capital account and the financial account.
The current account comprises the trade in goods and services account, the primary income account and secondary income account. The difference in the monetary value of these accounts is known as the current account balance. A current account balance is in surplus if overall credits exceed debits, and in deficit if overall debits exceed credits.
The sum of the current and capital account balances are equal to the balance of the financial account. As the capital account is relatively small in comparison, the current account and financial account can be said to be counterparts.
The current account balance plus the capital account balance measures the extent to which the UK is a net lender (that is, in surplus) or net borrower (that is, in deficit). The UK has run a combined current and capital account deficit in every year since 1983, and every quarter since Quarter 3 1998.
Figure 1: UK current account balances (seasonally adjusted)
Quarter 3 (July to Sept) 2013 to Quarter 2 (Apr to June) 2016
Source: Office for National Statistics
Notes:
- Q1 refers to Quarter 1 (Jan to Mar), Q2 refers to Quarter 2 (Apr to June), Q3 refers to (July to Sept) and Q4 refers to Quarter 4 (Oct to Dec).
Download this chart Figure 1: UK current account balances (seasonally adjusted)
Image .csv .xlsQuarter 2 2016 overview
In Quarter 2 2016, the UK was a net borrower of £29.0 billion, up from £26.5 billion in Quarter 1 2016. This was due to a widening in the current account deficit of £1.7 billion and a switch in the capital account from a surplus of £0.5 billion in Quarter 1 2016 to a deficit of £0.3 billion in Quarter 2 2016.
The £2.7 billion widening in the total trade deficit was mainly due to a widening of £1.8 billion in the trade in goods deficit, as imports increased by £4.4 billion while exports only increased by £2.6 billion from Quarter 1 2016. Additionally there was a £0.9 billion narrowing in the trade in services surplus. The narrowing in the trade in services surplus was due to exports decreasing by £0.5 billion and imports increasing by £0.4 billion.
The £1.6 billion narrowing in the total primary income deficit from Quarter 1 2016 was mainly due to a £1.8 billion narrowing in the direct investment deficit. Partially offsetting the improvement in the direct investment balance in Quarter 2 2016 was a slight widening in the deficit on portfolio investment income of £0.2 billion. The other investment deficit was virtually unchanged at £2.7 billion.
The £0.5 billion widening in the secondary income deficit in Quarter 2 2016 to £6.0 billion was due to payments increasing while receipts were virtually unchanged.
Notes for Summary
- Throughout this release Quarter 1 refers to January to March, Quarter 2 refers to April to June, Quarter 3 refers to July to September, and Quarter 4 refers to October to December.
4. Current account balances as percentage of GDP
Figure 2: UK balances as percentage of GDP
Quarter 3 (July to Sept) 2013 to Quarter 2 (Apr to June) 2016
Source: Office for National Statistics
Notes:
- Q1 refers to Quarter 1 (Jan to Mar), Q2 refers to Quarter 2 (Apr to June), Q3 refers to (July to Sept) and Q4 refers to Quarter 4 (Oct to Dec).
Download this chart Figure 2: UK balances as percentage of GDP
Image .csv .xlsThe current account deficit equated to 5.9% of gross domestic product (GDP) at current market prices in Quarter 2 2016, compared with 5.7% in Quarter 1 2016. The deficit on trade in goods and services was equivalent to 2.6% of GDP in Quarter 2 2016, compared with 2.1% in Quarter 1 2016. The deficit on primary income equated to 2.1% of GDP in Quarter 2 2016, compared with a deficit equivalent to 2.4% in Quarter 1 2016. The deficit on secondary income equated to 1.2% of GDP in Quarter 2 2016, unchanged from Quarter 1 2016.
Notes for Current account balances as percentage of GDP
- Throughout this release Quarter 1 refers to January to March, Quarter 2 refers to April to June, Quarter 3 refers to July to September, and Quarter 4 refers to October to December.
5. Current account with EU and non-EU countries (Table C)
Figure 3: UK current account balances with EU and non-EU countries (seasonally adjusted)
Quarter 3 (July to Sept) 2013 to Quarter 2 (Apr to June) 2016
Source: Office for National Statistics
Notes:
- Q1 refers to Quarter 1 (Jan to Mar), Q2 refers to Quarter 2 (Apr to June), Q3 refers to (July to Sept) and Q4 refers to Quarter 4 (Oct to Dec).
Download this chart Figure 3: UK current account balances with EU and non-EU countries (seasonally adjusted)
Image .csv .xlsA current account deficit of £24.6 billion was recorded with the EU in Quarter 2 2016, compared with a deficit of £26.8 billion in Quarter 1 2016. This was mainly due to the deficit on total trade narrowing from £17.5 billion in Quarter 1 2016 to £16.4 billion in Quarter 2 2016. Additionally, the deficit on primary income narrowed from £6.8 billion in Quarter 1 2016 to £5.7 billion in Quarter 2 2016. Partially offsetting these was a very slight widening in the deficit on secondary income.
The current account deficit with non-EU countries widened from £0.2 billion in Quarter 1 2016 to £4.1 billion in Quarter 2 2016. This was mainly due to the total trade surplus narrowing from £7.5 billion in Quarter 1 2016 to £3.7 billion in Quarter 2 2016. Additionally, the deficit on secondary income widened from £2.9 billion in Quarter 1 2016 to £3.5 billion in Quarter 2 2016. Partially offsetting these was a narrowing in the deficit on primary income from £4.8 billion in Quarter 1 2016 to £4.3 billion in Quarter 2 2016.
Notes for Current account with EU and non-EU countries (Table C)
- Throughout this release Quarter 1 refers to January to March, Quarter 2 refers to April to June, Quarter 3 refers to July to September, and Quarter 4 refers to October to December.
6. Trade in goods (Table E) and services (Table F)
Figure 4: UK trade in goods and services balances (seasonally adjusted)
Quarter 3 (July to Sept) 2013 to Quarter 2 (Apr to June) 2016
Source: Office for National Statistics
Notes:
- Q1 refers to Quarter 1 (Jan to Mar), Q2 refers to Quarter 2 (Apr to June), Q3 refers to (July to Sept) and Q4 refers to Quarter 4 (Oct to Dec).
Download this chart Figure 4: UK trade in goods and services balances (seasonally adjusted)
Image .csv .xlsTrade in goods covers transactions in general merchandise for which changes of ownership occur between UK residents and the rest of the world. General merchandise (with some exceptions) refers to moveable goods.
The trade in goods deficit in Quarter 2 2016 was £34.7 billion, compared with a deficit of £32.9 billion recorded in Quarter 1 2016. The widening in the deficit in Quarter 2 2016 was due to imports rising by £4.4 billion, compared with a rise in exports of £2.6 billion. The increase in imports was spread across all components but primarily due to a £1.9 billion rise in machinery and transport equipment. There were also rises in oil (£0.8 billion), material manufactures (£0.6 billion) and unspecified goods (£0.6 billion). The rise in exports was mainly due to a £2.6 billion increase in machinery and transport equipment, of which aircraft rose by £1.4 billion while other components had small offsetting movements.
Trade in services covers the provision of services by UK residents to non-residents and vice versa. It also covers transactions in goods which are not freighted out of the country in which transactions take place, for example, purchases for local use by foreign forces in the UK, or by UK forces abroad and purchases by tourists. Transactions in goods which are freighted into or out of the UK are included under trade in goods.
The trade in services surplus was £22.0 billion in Quarter 2 2016, a decrease of £0.9 billion from Quarter 1 2016. Exports fell by £0.5 billion from Quarter 1 2016, to £58.0 billion, with imports rising by £0.4 billion from Quarter 1 2016, to £36.1 billion.
The fall in exports was mainly due to a fall in the export of other business services of £0.7 billion. Offsetting this was a £0.2 billion rise in the export of government services. Other components recorded small offsetting changes.
The small rise in total imports of services was mainly due to an increase in the import of transport services and financial services by £0.3 billion and £0.2 billion respectively. These were partially offset by small falls in the import of most other components, such as other business services.
Notes for Trade in goods (Table E) and services (Table F)
- Throughout this release Quarter 1 refers to January to March, Quarter 2 refers to April to June, Quarter 3 refers to July to September, and Quarter 4 refers to October to December.
7. Primary income account (Table G)
Figure 5: UK primary income account balances (seasonally adjusted)
Quarter 3 (July to Sept) 2013 to Quarter 2 (Apr to June) 2016
Source: Office for National Statistics
Notes:
- Q1 refers to Quarter 1 (Jan to Mar), Q2 refers to Quarter 2 (Apr to June), Q3 refers to (July to Sept) and Q4 refers to Quarter 4 (Oct to Dec).
Download this chart Figure 5: UK primary income account balances (seasonally adjusted)
Image .csv .xlsThe primary income account is comprised of compensation of employees, investment income and other primary income.
Compensation of employees presents remuneration in return for the labour input into the production process contributed by an individual. In the international accounts, compensation of employees is recorded when the employer (the producing unit) and the employee are resident in different economies.
Investment income covers earnings (for example, profits, dividends and interest payments and receipts) arising from foreign investment in financial assets and liabilities. Credits are the earnings of UK residents from their investments abroad and other foreign assets. Debits are the earnings of foreign residents from their investments in the UK and other UK liabilities. The flow of investment in the financial account is recorded separately from earnings, although reinvested earnings of companies with foreign affiliates are a component of both. The total value of UK assets and liabilities held at any time is also recorded separately under the international investment position.
Other primary income covers earnings from rent and taxes, and subsidies on production and on the import of goods. Under the Balance of Payments Manual fifth edition, taxes and subsidies on production and on the import of goods were classified to secondary income (previously titled current transfers). The recording of rent was previously classified to other investment income.
The primary income deficit narrowed from £11.5 billion in Quarter 1 2016, to £10.0 billion in Quarter 2 2016.
The balance on compensation of employees recorded a deficit of £83 million in Quarter 2 2016, a switch from a surplus of £15 million in Quarter 1 2016.
The balance on direct investment income narrowed from a deficit of £3.8 billion in Quarter 1 2016, to a deficit of £2.0 billion in Quarter 2 2016. The narrowing was due to receipts rising by £2.2 billion from Quarter 1 2016 to £15.3 billion in Quarter 2 2016, while payments only rose by £0.5 billion from Quarter 1 2016 to £17.3 billion in Quarter 2 2016.
Foreign direct investment (FDI) net earnings have followed a broadly downward trend from 2011, falling from an average surplus of £13.4 billion per quarter in 2011 to a record deficit of £6.2 billion in Quarter 4 2015. This was driven by consistent falls in credits, whilst debits increased slightly over the same period. The deficit in net FDI earnings narrowed in the first 2 quarters of 2016, reaching a deficit of £2.0 billion in Quarter 2 2016.
Figure 6: Quarterly foreign direct investment earnings (seasonally adjusted)
Quarter 1 (Jan to Mar) 2011 to Quarter 2 (Apr to June) 2016
Source: Office for National Statistics
Notes:
- Q1 refers to Quarter 1 (Jan to Mar), Q2 refers to Quarter 2 (Apr to June), Q3 refers to (July to Sept) and Q4 refers to Quarter 4 (Oct to Dec).
Download this chart Figure 6: Quarterly foreign direct investment earnings (seasonally adjusted)
Image .csv .xlsThe broadly downward trend shown in FDI credits since 2011 was predominantly caused by falling returns – with the rate of return on FDI assets falling from 7.7% in 2011 to 4.8% in 2015 – while FDI assets remained fairly consistent over this period. In contrast, FDI debits have tended to increase over this period. Initially, this was due to increased investment into the UK, with FDI liabilities rising up until 2015, before rates of return also began to increase in 2015.
The narrowing of the FDI net earnings deficit in the first 2 quarters of 2016 was driven by several combining factors. Firstly, FDI debits fell from £19.1 billion to £16.8 billion between Quarter 4 2015 and Quarter 1 2016; due to a fall in FDI liabilities rather than a change in returns, as shown in Figure 7. FDI credits, meanwhile, were virtually unchanged in Quarter 1 2016.
The FDI net earnings deficit continued to narrow in Quarter 2 2016. In contrast to the first quarter, this was driven by an increase in FDI credits, as opposed to a decrease in debits. FDI credits increased from £13.0 billion to £15.3 billion between Quarter 1 2016 and Quarter 2 2016. This was mainly attributable to a £65.2 billion increase in FDI assets, to £1,414.7 billion; coupled with an increase in the rate of return by 0.6 percentage points to 4.4%, as shown in Figure 7. The improvement in FDI earnings in Quarter 2 2016 was partly offset by a small increase in FDI debits, which reflect a small increase in both FDI liabilities and rate of return.
Figure 7: UK direct investment positions and rates of return (non-seasonally adjusted)
2008 to Quarter 2 2016

Source: Office for National Statistics
Notes:
- Rates of return are calculated using the income data from Table G and a rolling average of the international investment position from Table K.
- Rates of return for Quarter 1 and Quarter 2 2016 have been annualised.
- Q1 refers to Quarter 1 (Jan to Mar), Q2 refers to Quarter 2 (Apr to June), Q3 refers to Quarter 3 (July to Sept) and Q4 refers to Quarter 4 (Oct to Dec).
Download this image Figure 7: UK direct investment positions and rates of return (non-seasonally adjusted)
.png (19.2 kB) .xls (27.6 kB)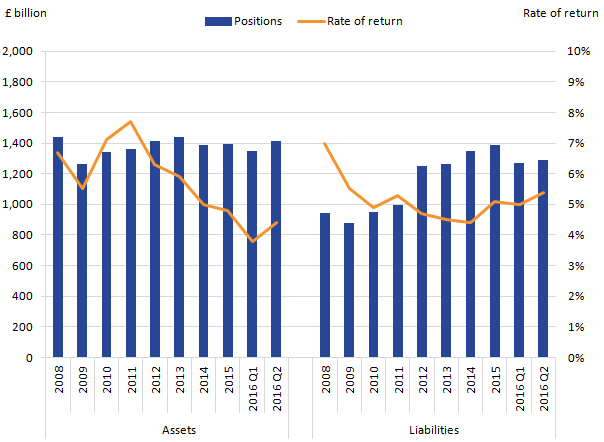
The portfolio investment income deficit widened by £0.2 billion between Quarter 1 2016 and Quarter 2 2016, to £5.2 billion. This was due to a slight widening in the deficits in both equity securities and debt securities.
The deficit on earnings from other investment was virtually unchanged at £2.7 billion in Quarter 2 2016.
The deficit on other primary income was £0.2 billion in Quarter 2 2016, which was £0.1 billion narrower than Quarter 1 2016.
Notes for Primary income account (Table G)
- Throughout this release Quarter 1 refers to January to March, Quarter 2 refers to April to June, Quarter 3 refers to July to September, and Quarter 4 refers to October to December.
8. Secondary income account (Table H)
Figure 8: UK secondary income balance (seasonally adjusted)
Quarter 3 (July to Sept) 2013 to Quarter 2 (Apr to June) 2016
Source: Office for National Statistics
Notes:
- Q1 refers to Quarter 1 (Jan to Mar), Q2 refers to Quarter 2 (Apr to June), Q3 refers to (July to Sept) and Q4 refers to Quarter 4 (Oct to Dec).
Download this chart Figure 8: UK secondary income balance (seasonally adjusted)
Image .csv .xlsSecondary income represents the provision (or receipt) of an economic value by one party without directly receiving (or providing) a counterpart item of economic value. In plain terms, this is a transaction representing “something for nothing” or without a quid pro quo. Transfers can be in the form of money or of goods or services provided without the expectation of payment. General government transfers include receipts, contributions and subscriptions from or to European Union (EU) institutions and other international bodies, bilateral aid and military grants.
The deficit on secondary income widened from £5.5 billion in Quarter 1 2016 to £6.0 billion in Quarter 2 2016. This was due to payments increasing while receipts remained virtually unchanged.
It should be noted that the quarterly path of net contributions to EU institutions can be erratic due to the timing of payments.
Notes for Secondary income account (Table H)
- Throughout this release Quarter 1 refers to January to March, Quarter 2 refers to April to June, Quarter 3 refers to July to September, and Quarter 4 refers to October to December.
9. Capital account (Table I)
The capital account comprises 2 components: capital transfers and the acquisition or disposal of non-produced, non-financial assets.
Under BPM6, there is no longer a requirement to record migrant transfers. The manual clarifies that the change in the residence does not involve a transaction between 2 entities but a change in status.
Capital transfers are those involving transfers of ownership of fixed assets, transfers of funds associated with the acquisition or disposal of fixed assets, and cancellation of liabilities by creditors without any counterparts being received in return. As with current transfers, they can be subdivided into general government transfers and other sectors transfers. The main sources of information are government departments (Department for International Development and HM Treasury) and the Bank of England. Compensation payments from the EU are also included here, for example, payments related to the destruction of animals to combat BSE and foot and mouth disease.
The sale or purchase of non-produced, non-financial assets covers intangibles such as patents, copyrights, franchises, leases and other transferable contracts, and goodwill. It also covers transactions involving tangible assets that may be used or needed for the production of goods and services but have not themselves been produced, such as land and sub-soil assets. The use of such assets is recorded under trade in services as royalties and license fees; only the outright purchase or sale of such assets is recorded in the capital account.
The capital account recorded a deficit of £0.3 billion in Quarter 2 (April to June) 2016, a switch from a surplus of £0.5 billion in Quarter 1 (January to March) 2016.
Nôl i'r tabl cynnwys10. Financial account (Table J)
Figure 9: UK financial account balances (not seasonally adjusted)
Quarter 3 (July to Sept) 2013 to Quarter 2 (Apr to June) 2016
Source: Office for National Statistics
Notes:
- Q1 refers to Quarter 1 (Jan to Mar), Q2 refers to Quarter 2 (Apr to June), Q3 refers to (July to Sept) and Q4 refers to Quarter 4 (Oct to Dec).
Download this chart Figure 9: UK financial account balances (not seasonally adjusted)
Image .csv .xlsThe financial account covers transactions that result in a change of ownership of financial assets and liabilities between UK residents and non-residents, for example, the acquisitions and disposals of foreign shares by UK residents.
The total financial account showed a net inflow (that is, more money flowing into the UK) of £14.5 billion in Quarter 2 2016, compared with a net inflow of £30.5 billion in Quarter 1 2016.
Direct investment recorded a net inflow (that is, more money flowing into the UK) of £2.0 billion in Quarter 2 2016, compared with a net inflow of £70.8 billion in Quarter 1 2016.
For further information on the impact of foreign direct investment acquisitions and disposals, please see background notes, understanding the data, part 2 interpreting the data.
Portfolio investment recorded a net inflow (that is, more money flowing into the UK) of £105.1 billion in Quarter 2 2016, an increase from a net inflow of £35.2 billion in Quarter 1 2016. The increased inflow in portfolio investment was due to non-residents’ net investment of £62.7 billion in Quarter 2 2016. This was broken down into net investment in UK equities of £11.8 billion and UK debt securities of £50.9 billion. Additionally, UK residents recorded net disinvestment of £42.4 billion in Quarter 2 2016. This was broken down into net disinvestment of foreign equities of £6.6 billion and net disinvestment of foreign debt of £35.7 billion.
Financial derivatives and employee stock options showed net settlement payments of £17.0 billion in Quarter 2 2016, following net settlement receipts of £35.3 billion in Quarter 1 2016.
Other investment in Quarter 2 2016 recorded a net outflow (that is, more money flowing from the UK) of £106.7 billion, compared with a net outflow of £37.9 billion in Quarter 1 2016.
Reserve assets showed net investment of £2.8 billion in Quarter 2 2016, a slight increase from net investment of £2.3 billion in Quarter 1 2016.
Nôl i'r tabl cynnwys11. International investment position (Table K)
Figure 10: UK net international investment position (not seasonally adjusted)
Quarter 3 (July to Sept) 2013 to Quarter 2 (Apr to June) 2016
Source: Office for National Statistics
Notes:
- Q1 refers to Quarter 1 (Jan to Mar), Q2 refers to Quarter 2 (Apr to June), Q3 refers to (July to Sept) and Q4 refers to Quarter 4 (Oct to Dec).
Download this chart Figure 10: UK net international investment position (not seasonally adjusted)
Image .csv .xlsThe international investment position brings together the available estimates of the levels of identified UK external assets (foreign assets owned by UK residents) and identified UK external liabilities (UK assets owned by foreign residents) at the end of each calendar period.
The international investment position showed net external liabilities (that is, liabilities exceed assets) of £57.0 billion at the end of Quarter 2 2016, compared with net external liabilities of £97.4 billion at the end of Quarter 1 2016.
UK external assets abroad increased by £708.8 billion from the end of Quarter 1 2016, to a level of £11,020.0 billion at the end of Quarter 2 2016. The increase in the stock of UK external assets in Quarter 2 2016 was due to an increase in the value of stock in all asset classes. The value of UK portfolio investment assets increased in Quarter 2 2016 due to the combination of exchange rates movements and price changes in equities and bonds as UK residents continued to be net sellers of foreign equities and debt securities.
UK external liabilities increased by £668.4 billion in Quarter 2 2016, to a level of £11,077.0 billion. The increase in UK external liabilities in Quarter 2 2016 was due to an increase in UK liabilities in each of the main asset classes. While non-residents were generally net investors in the UK in Quarter 2 2016, the devaluation of sterling was also evident in the changes to UK liabilities. The UK has a large banking sector where non-residents place on deposit large amounts of foreign currency. During Quarter 2 2016, these deposits increased significantly in value as sterling weakened.
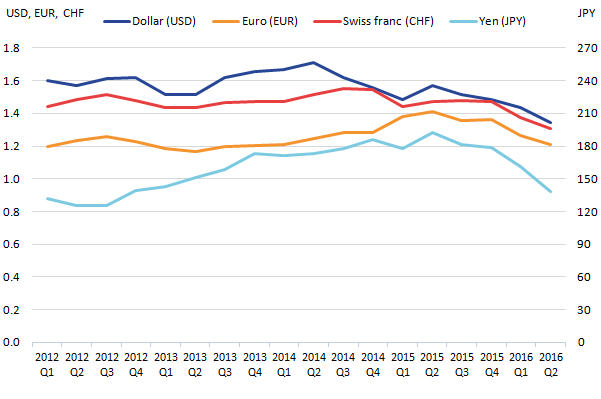
Figure 11: Sterling exchange rates with major trading partners
Quarter 1 (Jan to Mar) 2012 to Quarter 2 (Apr to June) 2016
Source: Office for National Statistics
Download this image Figure 11: Sterling exchange rates with major trading partners
.png (19.6 kB) .xls (20.5 kB)
Figure 11 presents sterling exchange rates against the currencies of major trading partner countries at the close of markets at each quarter end. The chart shows that sterling has been depreciating against most currencies since Quarter 2 2015. From Quarter 4 2015, sterling weakened markedly and continued to weaken following the European Union referendum held in the latter part of Quarter 2 2016. This weakening has in part contributed to the decrease in the UK’s net liability position.
The stock of UK assets and liabilities with the rest of the world can be influenced by movements in exchange rates and price revaluations. Table 1 summarises which type of investment is impacted by these changes.
Most UK assets are held in foreign currency although a small portion of assets such as deposits and loans are held in sterling. Due to the UK’s Balance of Payments being presented in sterling, some assets have increased in value due to the devaluation of sterling. An article summarising the impact of exchange rates on direct investment abroad has also been published today. While direct investment and portfolio investment liabilities are valued in sterling, some elements of other investment liabilities are held by foreign investors in foreign currency, so have also increased in value as a result of the sterling devaluation.
Direct investment and portfolio investment, assets and liabilities, can also be impacted by price changes. During Quarter 2 2016, UK equity assets in the United States of America would have fared comparatively well as the main indices increased slightly compared with falls in European indices, however, foreign exchange movements more than offset these movements. UK equity liabilities increased from Quarter 1 2016 as non-residents continued to invest in UK equities together with the All-share index closing higher despite market volatility. Over the same period, the value of debt securities increased in the UK and generally around the world leading to increases in debt security assets and liabilities.
Table 1: Revaluation impacts on investments
| Assets | Liabilities | ||||||
| Exchange rate movements | Price revaluations | Exchange rate movements | Price revaluations | ||||
| Direct Investment | Impact | Impact | No impact | Impact | |||
| Portfolio Investment | |||||||
| Equities | Impact | Impact | No impact | Impact | |||
| Debt Securities | Impact | Impact | No impact | Impact | |||
| Other Investment | |||||||
| Deposits | Impact | No impact | Impact | No impact | |||
| Loans | Impact | No impact | Impact | No impact | |||
| Source: Office for National Statistics | |||||||
Download this table Table 1: Revaluation impacts on investments
.xls (27.1 kB)Notes for International investment position (Table K)
- Throughout this release Quarter 1 refers to January to March, Quarter 2 refers to April to June, Quarter 3 refers to July to September, and Quarter 4 refers to October to December.
12. Summary of revisions
Data in this release have been revised from Quarter 1 (Jan to Mar) 2015. Revisions tables are included in the balance of payments datasets (Tables R1, R2 and R3). Revisions are due to:
Trade in goods – Revisions from Quarter 1 2015 reflect revised data from HM Revenue and Customs and other data suppliers, revised estimates of trading associated with VAT Missing Trader Intra-Community (MTIC) fraud and a seasonal adjustment. Further information on trade is available in the UK Trade July 2016 statistical bulletin.
Trade in services – Revisions from Quarter 1 2016 are due to updated and late data to survey and administrative sources and a reassessment of seasonal factors.
Secondary income account – Revisions to the secondary income account are due to revised source data for transfers involving the UK government, the use of the latest data for various ONS surveys and a reassessment of seasonal factors.
Capital account – Revisions to the capital account are attributable to revised source data from HM Treasury and the ONS International Trade in Services survey.
Primary income, financial account and international investment position – Revisions from Quarter 1 2015 reflect new and revised survey data, a reassessment of coverage adjustments to data from the Bank for International Settlements and a reassessment of seasonal factors. Revisions also reflect new estimates from the Bank for International Settlements.
Quarterly revisions to the current account balance as a percentage of GDP
Revisions to the current account balance as a percentage of GDP in this release may be due to revisions to the current account detailed in this section and / or changes to nominal GDP.
Table 2 provides revisions to the current account balance as a percentage of GDP annually for 2015 and quarterly between Quarter 1 2015 to Quarter 1 2016.
Table 2: Balance of Payments revisions to current account balance as a percentage of GDP, Quarter 2 (Apr to Jun) 2016
| % | |||
| Period | Current account balance as a percentage of GDP previously published | Current account balance as a percentage of GDP latest estimate | Revisions to total current account balance as a percentage of GDP (percentage points) |
| 2015 | -5.4 | -5.4 | 0.0 |
| 2015 Q1 | -5.4 | -5.4 | 0.0 |
| 2015 Q2 | -4.2 | -4.7 | -0.5 |
| 2015 Q3 | -4.7 | -4.4 | 0.3 |
| 2015 Q4 | -7.2 | -7.0 | 0.2 |
| 2016 Q1 | -6.9 | -5.7 | 1.2 |
| Source: Office for National Statistics | |||
| Note: | |||
| 1. Q1 refers to Quarter 1 (Jan to Mar), Q2 refers to Quarter 2 (Apr to June), Q3 refers to Quarter 3 (July to Sept) and Q4 refers to Quarter 4 (Oct to Dec). | |||
Download this table Table 2: Balance of Payments revisions to current account balance as a percentage of GDP, Quarter 2 (Apr to Jun) 2016
.xls (26.6 kB)13. Quality and methodology
The Balance of payments (BoP) QMI Quality and Methodology Information document contains important information on:
the strengths and limitations of the data and how it compares with related data
users and uses of the data
how the output was created
the quality of the output including the accuracy of the data
Methods
More detailed methodological notes for the UK balance of payments are available on our website.
Composition of the data
Table C provides an EU/non-EU breakdown of the current account and is presented on an EU28 basis.
International investment position statistics are based on recording direct investments at book values, and other assets and liabilities at estimated market values. These estimates are likely in some respects to be deficient in scope and coverage. Quarterly estimates tend to be less reliable because they are largely based on cumulated flows and not reported levels.
In theory, every credit entry should be matched by a corresponding debit so that total current, capital and financial account credits should be equal to, and therefore offset by, total debits. In practice there is a discrepancy termed net errors and omissions. The net errors and omissions are shown on Table A.
Seasonal adjustment
Current and capital accounts are seasonally adjusted. Financial account and international investment position data are not seasonally adjusted.
When compiling the geographic breakdown of primary income, secondary income and trade in services, the EU countries are seasonally adjusted. The non-EU seasonally adjusted figure is calculated by subtracting the seasonally adjusted EU total from the seasonally adjusted world total. Both EU and non-EU data are seasonally adjusted for trade in goods; these are aggregated to form the world total.
Applying annual benchmark data
Foreign Direct Investment (FDI) statistics are collated using a combination of data from the quarterly and annual surveys, both for outward and inward investment. The quarterly survey for outward and inward FDI has 680 and 970 sampled enterprise groups respectively, these increase to 2,100 and 3,500 enterprise groups on the annual survey. Quarterly data are used in the short term to estimate FDI statistics and these data are updated each year through an annual benchmarking process.
The larger annual sample size and responses – taken from audited annual accounts, rather than quarterly management accounts – can result in revisions. A range of methods are used to benchmark the various FDI variables and their constituent components. For earnings and flows, the difference is allocated evenly or proportionately according to the data from the quarterly FDI survey, across the quarters of the year being benchmarked. For the investment position, otherwise referred to as the stock of investment, Quarter 4 is constrained to the investment position data from the annual survey. The quarterly path for Quarter 1 to Quarter 3 is determined by data from the quarterly survey, so that the movements are maintained, but the values reflect the pre-determined values in Quarter 4.
Quality
Basic quality information
Common pitfalls in interpreting series are the following:
- expectations of accuracy and reliability in early estimates are often too high
- revisions are an inevitable consequence of the trade off between timeliness and accuracy
- early estimates are based on incomplete data
Very few statistical revisions arise as a result of “errors” in the popular sense of the word. All estimates, by definition, are subject to statistical “error”, but in this context the word refers to the uncertainty inherent in any process or calculation that uses sampling, estimation or modelling. Most revisions reflect either the adoption of new statistical techniques, or the incorporation of new information which allows the statistical error of previous estimates to be reduced. Only rarely are there avoidable “errors” such as human or system failures, and such mistakes are made quite clear when they do occur.
National Accounts revisions policy
The data in this statistical bulletin are subject to revisions following our National Accounts Revision policy.
Estimates for the most recent quarters are provisional and, as usual, are subject to revision in light of updated source information. We provide analysis of past revisions in the Balance of Payments and other statistical bulletins which present time series.
Revision triangles
Revisions to data provide one indication of the reliability of main indicators. Table 3 shows summary information on the size and direction of the revisions which have been made to the data covering a 5 year period. A statistical test has been applied to the average revision to find out if it is statistically significantly different from zero. An asterisk (*) shows that the test is significant.
Table 3 covers estimates first published in the balance of payments from December 2008 (Quarter 3 (July to Sept) 2008) to September 2013 (Quarter 2 (Apr to June) 2013).
Table 3: Balance of Payments revisions analysis
Current account (seasonally adjusted) £ million Revisions between first publication and estimates 3 years later Value in latest period Average over the last 5 years Average over the last 5 years without regard to sign (average absolute revisions) Credits (HBON) 170,555 5,828* 6,429* Debits (HBOO) 199,239 4,860* 5,932* Net (HBOP) -28,684 968 2,269 Source: Office for National Statistics Download this table Table 3: Balance of Payments revisions analysis
.xls (25.6 kB)Spreadsheets giving revisions analysis (real time databases) of estimates from 1996 to date and the calculations behind the averages in the table are available on our website.
An article analysing balance of payments current account revisions was published in the May 2007 edition of Economic and Labour Market Review.