1. Introduction
Consumer price indices estimate changes to the total cost of a “basket” of goods and services by calculating the average price change of items within the basket. As households spend more of their household budget on some goods and services than others, price indices are weighted using the amount that we spend on these items as consumers. This ensures that indices reflect the relative importance of the various items in the basket. For example, we would expect a 10% increase in the price of petrol to have a greater impact on the rate of inflation than a similar increase in the price of tea.
Three different approaches to measuring inflation are presented in the article Measuring changes in prices and costs for consumers and households. Three indices are presented that meet different user needs: the Consumer Prices Index including owner occupiers’ housing costs (CPIH), the Household Costs Indices (HCIs) and the Retail Prices Index (RPI).
The CPIH is a comprehensive measure of price change across the UK economy as a whole, and is the lead measure in our publications of consumer price inflation. The HCIs are a set of measures currently in development that aim to reflect changes in prices and costs as understood and experienced by households. The RPI is a “legacy” measure that is produced to meet ongoing requirements for index-linked long-term gilts and contracts.
While there are a number of similarities in the way that these measures are constructed, there are also notable differences that are necessary in meeting the indices’ required concepts. For example, the measures all have different items within scope of their respective baskets and all use (or are proposed to use in the case of the HCIs) different data sources and different methods of weighting the items within their baskets.
This article investigates the impact that using different data sources and different methods of weighting has on our lead measure of inflation, the CPIH. To investigate this impact it is necessary to keep all other aspects of index construction constant. Therefore this empirical analysis utilises CPIH methodology and references CPIH (as published) for the remainder of this article. This is a research article and we are not currently considering making any of these changes to CPIH, which is designated a National Statistic and uses methodology that is in line with international best practice.
Nôl i'r tabl cynnwys2. Data sources
Background
There are two primary data sources that are currently used when constructing expenditure weights for consumer price inflation measures. The Consumer Prices Index including owner occupiers’ housing costs (CPIH) largely uses data from estimates of household final consumption expenditure (HHFCE), whereas the Retail Prices Index (RPI) uses data from the Living Costs and Food Survey (LCF). As the expenditure data from both sources is not timely enough for immediate use in price indices, the data are price updated to approximate, as far as possible, current patterns of expenditure. Further details regarding how these weights are calculated are provided in Consumer price inflation, updating weights: 2017.
These two sources and their limitations are discussed in this section along with the impact that using LCF, instead of HHFCE, as the primary data source for CPIH weights would have on the resulting index, while holding all other elements of construction constant.
The Living Costs and Food Survey
The most detailed level of household expenditure data currently available is from the Living Costs and Food Survey (LCF). The LCF is a continuous survey of the expenditure patterns of private households based on an achieved sample of around 6,000 households per year. Declining response rates in social surveys means the achieved sample is decreasing over time, which may have implications on the accuracy of estimates.
Each household’s expenditure within the sample is weighted using a “survey weight”, which reflects how many households within the population each sample household represents. More details on the LCF weighting can be found in the LCF technical report (PDF, 689KB).
As LCF expenditure data are available at the household level, a benefit of this data source is that, in addition to expenditure, it also collects a useful array of information on the demographics of households that can be used to analyse differences in spending patterns between households and household groups. However, it also has a number of limitations. For example, the LCF is believed to under-report expenditure for a number of items (such as alcohol and tobacco) and as the LCF only surveys private households, a small proportion of the population are missed (such as those in student halls and other communal establishments, such as nursing homes).
Household final consumption expenditure
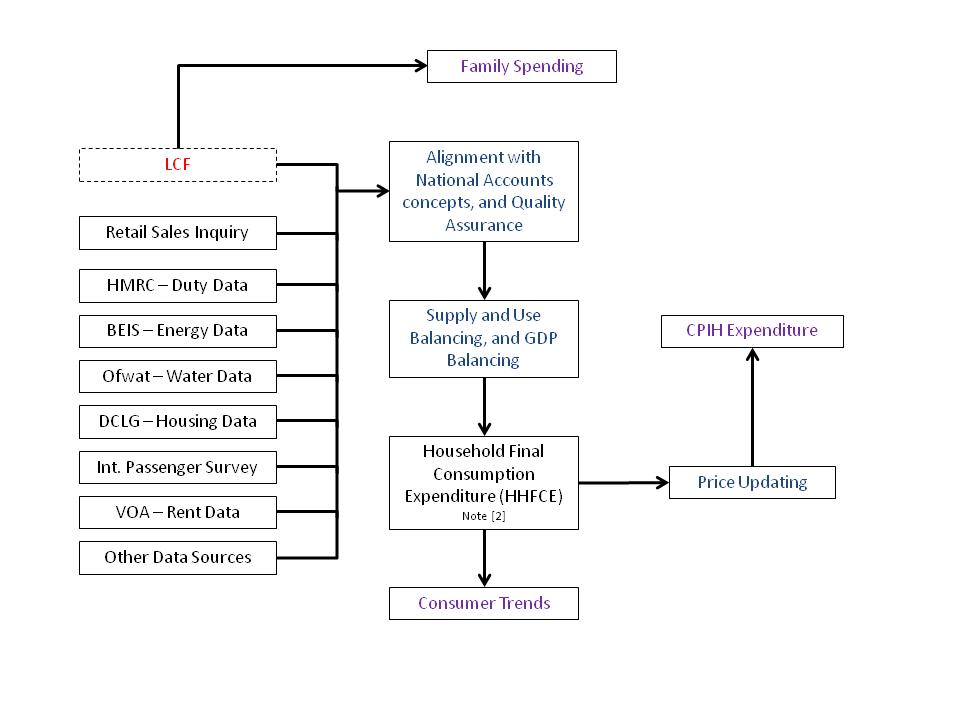
Expenditure at the aggregate level can be obtained from HHFCE data. HHFCE includes data on consumption goods and services and is used by the national accounts to measure the contribution of household spending to economic growth. The LCF is one of the inputs for HHFCE, but HHFCE also uses data from a number of secondary sources, as displayed in Figure 1.
Figure 1: Sources of expenditure used in the CPIH weights (class-level and above)
Source: Office for National Statistics, 2017
Notes:
- Figure 1 shows a number of the sources and processes used in the compilation of the CPIH. LCF is the Living Costs and Food Survey, HMRC is Her Majesty’s Revenue and Customs, BEIS is the Department for Business, Energy and Industrial Strategy, OfWat is the water regulator, DCLG is the Department for Communities and Local Government, Int. Passenger Survey is the International Passenger Survey, VOA is the Valuation Office Agency.
- The weight for a small number of classes (for example, package holidays) uses a different source of information (see the Consumer Price Indices Technical Manual for more information).
Download this image Figure 1: Sources of expenditure used in the CPIH weights (class-level and above)
.png (14.7 kB)
Alternative sources are used within HHFCE where the LCF is believed to under-report expenditure (including alcohol and tobacco) or where data quality is deemed to be stronger from administrative sources (including energy). Estimates also vary where the concepts captured in the national accounts differ from the pure expenditure estimates collected in the LCF. For example, the national accounts adjust the data to a domestic basis, while LCF only captures expenditure of UK private households (national basis). HHFCE is published quarterly in the Consumer trends release as part of the quarterly national accounts.
While the aggregate expenditure estimates for HHFCE may be considered more accurate than the unadjusted LCF data, the data lacks the low-level detail of the LCF. This means that HHFCE cannot be used to investigate spending patterns of households, or groups of households, without first being reconciled with another source.
Method for constructing weights using different data sources
Where CPIH is presented in this section it is the same as the CPIH as published in our consumer price inflation bulletins. The CPIH uses data primarily from the HHFCE because the expenditure information is comprehensive and balanced against data collected in other sectors of the economy to create the most accurate picture of consumer spending. However, there are a few exceptions where additional source data are used to supplement the HHFCE data and improve the coherence with the intended scope of the index. For example, when calculating the CPIH weights for insurance, an average of the most recent three years data is used in line with international best practice (details of this practice can be found in Consumer price inflation, updating weights: 2017).
As the CPIH expenditure deviates from HHFCE expenditure in a small number of areas, the remainder of this section refers to “CPIH expenditure”, although HHFCE remains the primary source.
The CPIH uses the Classification of Individual Consumption According to Purpose (COICOP) as its underlying aggregation structure. COICOP groups together similar goods and services to enable analysis and comparisons between categories of items and between years. As this is the aggregation structure used for consumer price indices internationally, it also enables comparisons between countries.
To construct expenditure weights from the raw LCF expenditure data that are consistent with the CPIH, the expenditure of each household within the LCF is weighted so that the total expenditure of LCF households is representative of total expenditure of the whole population. Weighted expenditure on each LCF variable is then mapped to the appropriate COICOP class. The total LCF expenditure on each COICOP class is calculated as a proportion of total expenditure on all classes and this proportion is expressed in parts per thousand.
To construct an aggregate price index consistent with the CPIH using this data, the class-level weights are then combined with the published CPIH class-level indices.
Results
Impact of different data sources on expenditure shares
The average weight of 12 divisions between 2005 and 2016 are presented in Table 1 for both CPIH (as published) and CPIH as it would look were it to be calculated based primarily on LCF data. For ease of interpretation these averages have been rounded to zero decimal places (dp). The percentage difference between these averages is also presented (rounded to one dp), a positive value shows that the CPIH using LCF as the primary data source to construct the weights is higher than the CPIH as published.
Table 1: Average CPIH weight compared to the average weight calculated using LCF data as the primary expenditure source, parts per thousand, UK, 2005 to 2016
| Division | CPIH (as published) | CPIH (LCF weighted) | Difference (%) |
|---|---|---|---|
| 1. Food and non-alcoholic beverages | 87 | 118 | 35.6 |
| 2. Alcoholic beverages and tobacco | 34 | 26 | -23.5 |
| 3. Clothing and footwear | 52 | 49 | -5.8 |
| 4. Housing, water, electricity, gas and other fuels | 300 | 241 | -19.7 |
| 5. Furniture, household equipment and maintenance | 50 | 70 | 40 |
| 6. Health | 19 | 13 | -31.6 |
| 7. Transport | 122 | 141 | 15.6 |
| 8. Communication | 21 | 29 | 38.1 |
| 9. Recreation and culture | 117 | 126 | 7.7 |
| 10. Education | 16 | 17 | 6.3 |
| 11. Restaurants and hotels | 101 | 88 | -12.9 |
| 12. Miscellaneous goods and services | 79 | 82 | 3.8 |
| Source: Office for National Statistics | |||
Download this table Table 1: Average CPIH weight compared to the average weight calculated using LCF data as the primary expenditure source, parts per thousand, UK, 2005 to 2016
.xls (26.6 kB)There are five divisions where there is a larger average weight in the CPIH (as published) than when the LCF is used as the primary data source for constructing weights. These are: alcoholic beverages and tobacco; clothing and footwear; housing, water, electricity, gas and other fuels; health; and restaurants and hotels1.
This can be explained by the additional data sources used for the expenditure estimates used to calculate CPIH weights (primarily from HHFCE). For example, expenditure on alcoholic beverages and tobacco is believed to be largely underreported in the LCF; as HHFCE adjusts the data to account for this, the weight for this division within CPIH is larger than it would be if using the LCF data alone. This is one of the divisions, along with clothing and footwear, and health, where the CPIH data is largely obtained from other sources (PDF, 172KB).
Although the underlying expenditure total may be broadly similar for some divisions using the two data sources, the relative weight will not often be the same. For example, the underlying expenditure total for food and non-alcoholic beverages will be broadly similar for the CPIH and LCF-derived weights, as the HHFCE largely utilises data from the LCF to estimate household spending within this COICOP division. However, as expenditure within other divisions is greater in the CPIH, the food and non-alcoholic beverages division receives a smaller relative weight.
Presenting the division-level weights may obscure interesting differences at lower levels of aggregation. For example, within miscellaneous goods and services are three categories of insurance. Insurance premia can be broken into two components; some of the premium is paid into a “claims pool” that is redistributed back to the household sector, the rest of the premium is considered a service charge and is what households pay for the service. As the former component is returned to the household sector, it is not in scope of the CPIH. Therefore only the latter service charge is included in the construction of the weight.
Conversely, as LCF expenditure does not separate the service charge from the payment into the claims pool, the total expenditure on insurance premiums is included. This leads to a much greater weight for insurance classes when calculated using primarily LCF data than is used in the CPIH. On average, insurance weights are 34% lower in the CPIH than if they were to be calculated using primarily LCF expenditure data between the years 2005 and 2016.
Impact of using LCF expenditure data to construct weights on CPIH
Figure 2 shows the impact of using the LCF expenditure data to weight CPIH (holding everything else constant), compared with the CPIH as published. The CPIH that is constructed using data primarily from the LCF is referred to as CPIH (LCF-weighted), while CPIH is referred to CPIH (as published) for the remainder of this article.
Figure 2: Impact of using the LCF expenditure data to construct weights for CPIH, compared to CPIH (as published), cumulative price changes
UK, January 2005 to December 2016
Source: Office for National Statistics
Download this chart Figure 2: Impact of using the LCF expenditure data to construct weights for CPIH, compared to CPIH (as published), cumulative price changes
Image .csv .xlsCPIH (LCF-weighted) has grown at a faster rate to the CPIH (as published) over the period 2005 to 2016. To examine this in further detail, Figure 3 compares the 12-month growth rate for these indices.
Figure 3: Impact of using the LCF expenditure data to construct weights for CPIH, compared to CPIH (as published), 12-month growth rate (%)
UK, January 2006 to December 2016
Source: Office for National Statistics
Download this chart Figure 3: Impact of using the LCF expenditure data to construct weights for CPIH, compared to CPIH (as published), 12-month growth rate (%)
Image .csv .xlsWhile CPIH (LCF-weighted) follows the same trend as CPIH (as published), the movements appear more extreme. In earlier periods the CPIH (as published) shows slower growth than it would, were the weights constructed using primarily LCF expenditure data. Furthermore, CPIH (LCF-weighted) shows periods of negative growth in 2014 and 2015, while the CPIH (as published) shows slow, yet positive, growth.
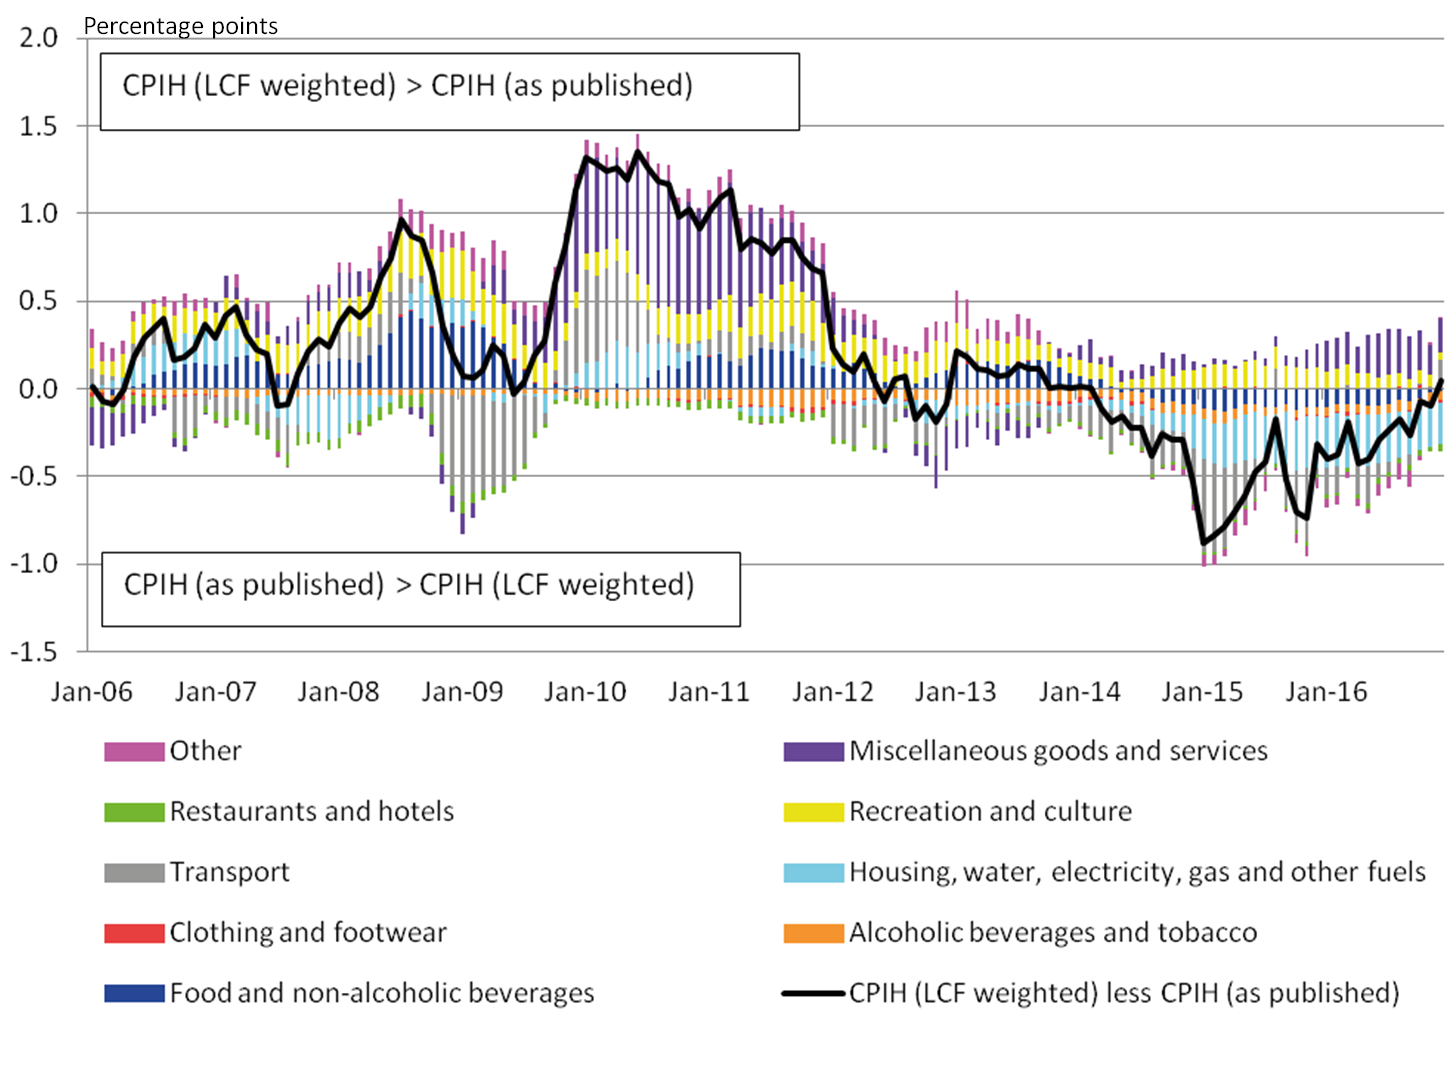
To identify why the LCF data shows more extreme trends in a number of years, the contribution of different categories of product to the 12-month growth rate for the indices are examined in Figure 4. This demonstrates the categories of product that are driving the difference in growth rates between these indices.
Figure 4: Contributions to the difference in the 12-month growth rate: CPIH (LCF weighted) 12-month growth rate less CPIH (as published) 12-month growth rate, percentage points
UK, January 2005 to December 2016
Source: Office for National Statistics
Notes:
- Stacked bar charts reflect the difference in percentage point contributions of each of the 87 class level items (defined using COICOP categorisation) to the 12-month growth rate between CPIH (as published) and CPIH were the weights calculated primarily using LCF data as the underlying expenditure source. The contribution of each of the 87 class level items is estimated separately, before being aggregated to the categories above. Note that a reduction in the contribution to the 12-month growth rate need not imply falling prices; it could also reflect a lower rate of growth than observed in the previous year.
- Other is comprised of the following divisions (as defined using COICOP categorisation): furniture, household equipment and maintenance; health; communication; and education. All other divisions are presented in their own right.
- Contributions may not sum due to rounding.
Download this image Figure 4: Contributions to the difference in the 12-month growth rate: CPIH (LCF weighted) 12-month growth rate less CPIH (as published) 12-month growth rate, percentage points
.png (356.8 kB) .xls (49.7 kB)
The differences in the contributions between the two indices are naturally driven by divisions where the data sources display the greatest differences. This is further exaggerated when prices are rising or falling rapidly. For example, food and non-alcoholic beverages has a higher weight when constructed using LCF expenditure as the primary data source than in the published CPIH. This means that when prices for this division are rising (for example, between 2006 and 2010) the 12-month growth rate for CPIH (as published) is lower than the 12-month growth rate for CPIH (LCF-weighted). Between 2014 and 2016, prices for food and non-alcoholic beverages have had a negative contribution to the growth rate, which has contributed to CPIH (as published) rising faster than CPIH (LCF-weighted).
One of the main contributors to the difference in 12-month rates is miscellaneous goods and services. As already discussed, there are conceptual differences regarding the measurement of insurance within this division, using these two sources. This leads to insurance having a lower weight in CPIH (as published). Therefore, when insurance is experiencing price growth, the CPIH (LCF-weighted) grows at a faster rate than the published CPIH.
Notes for Data sources:
- This was corrected from four to five divisions on 16 November 2017 to include clothing and footwear
3. Methods of weighting
Background
There are a number of different methods of weighting that can be considered when measuring consumer price inflation. The primary methods discussed in this section are plutocratic and democratic1. We also consider the impact of “trimming”, and how this compares with the aforementioned methods.
The Consumer Prices Index including owner occupiers’ housing costs (CPIH) uses the plutocratic method of weighting in accordance with its underlying economic principles. Plutocratic weighting takes the sum of expenditures in a given class over all households, and divides by the total expenditure of all households on all classes to get the weight for that particular class. The use of aggregate expenditure to calculate weights means that each household contributes to the weights an amount proportional to its expenditure.
As plutocratic weighting is relative to the total pounds sterling value of all items bought within the economy, the method maintains the purchasing power of the national currency (one Great British Pound (GBP) in the UK). This means that one GBP has the same purchasing power to a low-spending household as it does to a high-spending household. A secondary consequence of this is that expenditure patterns of high-spending households have more influence on the resulting index.
The Household Costs Indices (HCIs) are proposed to use democratic weighting. This method first calculates each household’s expenditure share on a particular class, by dividing each household’s expenditure on that class by the household’s total expenditure. The average of these expenditure shares for this class gives us the democratic weight. While using this method each household’s expenditure receives an equal weight within the index, a secondary consequence of this method is that the purchasing power of one GBP differs between households. For example, a low-spending household may get more value from one GBP than a high-spending household. This may result in an index that is more in line with the household’s experience of inflation.
The Retail Prices Index (RPI) uses a method commonly referred to as “trimming”, where the top 4% of high earners are removed from the underlying LCF expenditure data prior to the calculation of the weights, along with pensioner households with at least 75% of their income derived from State Pensions and benefits.
It has been theorised that trimming in this way provides an approximation to democratic weighting. For example, Astin and Leyland (2015) (PDF, 547KB) speculate that trimming should remove the influence of extreme values from the mean value, rendering the latter more representative of the distribution and therefore a rough approximation of a democratic index. They also suggested that tails of the distribution could be trimmed equally as opposed to the method currently used in the RPI. They proposed that equal trimming may provide an even better approximation of a democratic index.
Notes for: Background
- It is noted that Astin and Leyland [Towards a Household Inflation Index, 2015] prefer the terminology “household” and “expenditure” weighting, however for consistency with previous literature, we remain with the convention of naming the approach democratic and plutocratic weighting respectively.
Method for constructing weights using different approaches
Household level expenditure data is required to calculate democratic weights. As discussed in section 2, household final consumption expenditure (HHFCE) data, the primary source used to calculate weights in the CPIH, is not available at this low-level of detail. However, if raw LCF expenditure data are used to weight the democratic index then this index could not be directly compared with CPIH, as it would be uncertain whether the difference was a result of the different method of weighting used, or the differences in the underlying data sources.
To maintain consistency with CPIH and to ensure the most accurate representation of aggregate expenditure is being used, the methodology used to calculate household-level expenditure for democratic weights is consistent with the methodology used to calculate CPIH-consistent inflation rates for UK household groups. This method involves reconciling CPIH expenditure totals with LCF data to arrive at CPIH-consistent expenditure data at a household level. This household-level expenditure is referred to as “CPIH-consistent expenditure” for the remainder of this article.
Further details as to how democratic and plutocratic weights for CPIH are constructed are also provided in the methodology document. The plutocratic CPIH presented in this section is as published in our consumer price inflation bulletins.
Alongside analysis of plutocratic and democratic weighting, this section also presents analysis of the impact of using a number of different trimming methods on CPIH. These methods also utilise the CPIH-consistent expenditure to enable comparisons with the published CPIH. Once CPIH expenditure totals have been reconciled with LCF households, the households in the dataset are ordered (according to either their level of income or level of expenditure) and households within the tails of the respective distribution are “trimmed”. Plutocratic weights are then calculated based on these trimmed datasets, using methodology consistent with the CPIH (as published). A number of variations on trimming are presented in this section, including the RPI method and methods of trimming using both the income and expenditure distributions of households.
Annex A expands on this analysis, providing details of how inflation rates using the different approaches to weighting would differ, were they to be calculated based on raw LCF expenditure data.
Results
Percentage differences between the average plutocratic and democratic weights (2005 to 2016) using CPIH-consistent expenditure are displayed in Table 2 for 12 divisions (as defined using Classification of Individual Consumption According to Purpose (COICOP) categorisation). For clarity, the average weight presented here is rounded to zero decimal places (dp) and the percentage difference between the weights is rounded to one dp.
Table 2: Average plutocratic weight compared to the average democratic weight, parts per thousand, UK, 2005 to 2016
| Division | CPIH (plutocratic) | CPIH (democratic) | Difference (%) | ||
|---|---|---|---|---|---|
| 1. Food and non-alcoholic beverages | 87 | 106 | 21.8 | ||
| 2. Alcoholic beverages and tobacco | 34 | 40 | 17.6 | ||
| 3. Clothing and footwear | 52 | 44 | -15.4 | ||
| 4. Housing, water, electricity, gas and other fuels | 300 | 347 | 15.7 | ||
| 5. Furniture, household equipment and maintenance | 50 | 45 | -10 | ||
| 6. Health | 19 | 16 | -15.8 | ||
| 7. Transport | 122 | 104 | -14.8 | ||
| 8. Communication | 21 | 25 | 19 | ||
| 9. Recreation and culture | 117 | 103 | -12 | ||
| 10. Education | 16 | 8 | -50 | ||
| 11. Restaurants and hotels | 101 | 91 | -9.9 | ||
| 12. Miscellaneous goods and services | 79 | 71 | -10.1 | ||
| Source: Office for National Statistics | |||||
Download this table Table 2: Average plutocratic weight compared to the average democratic weight, parts per thousand, UK, 2005 to 2016
.xls (27.6 kB)There are four divisions where the democratic weight is higher than the plutocratic weight (both constructed based on CPIH-consistent expenditure). These divisions are: food and non-alcoholic beverages; alcoholic beverages and tobacco; communication; and housing and housing-related services. While the average is presented in Table 2, this pattern remains consistent across all years of the analysis.
It is intuitive that these divisions would have a larger weight in a democratic index. For example, households with low expenditure will typically spend a larger share of their total expenditure on food than high-expenditure households, as food and non-alcoholic beverages are considered essential (goods and services that households could not live without). As each household has an equal weight within a democratic index, “essential” items will receive a greater weight than they would in a plutocratic index, where each household’s contribution to the weights is proportional to their expenditure.
The largest difference between weights occurs in the education division, where the average plutocratic weight is double the average democratic weight between 2005 and 2016. Low expenditure households spend a smaller proportion of their total expenditure on education, therefore when we take the average expenditure share across households we would expect the democratic weight to be lower. However, when we consider the total expenditure on education, we would expect it to be a large proportion of total expenditure, hence the greater plutocratic weight. Table 2 supports this assertion.
The aggregation in Table 2 obscures some of the differences between the plutocratic and democratic weights at a lower level. For example, passenger transport by air receives a weight 33% larger, on average, when we weight using the plutocratic method. This reflects that high-expenditure households spend a larger proportion of their budget on travel abroad (which may be considered a non-essential item). Recreation also receives a larger weight when weighted using the plutocratic method, but households with lower expenditure spend a larger proportion of their household budget on pets and pet-related products and services, and newspapers and periodicals, therefore these classes have a higher weight when using democratic weighting.
Figures 5a and 5b show the impact that using democratic weighting has on the CPIH index and the CPIH 12-month growth rate (per cent) respectively.
Figure 5a: Plutocratically weighted CPIH (as published) and democratically weighted CPIH, cumulative price changes
UK, January 2005 to December 2016
Source: Office for National Statistics
Download this chart Figure 5a: Plutocratically weighted CPIH (as published) and democratically weighted CPIH, cumulative price changes
Image .csv .xls
Figure 5b: Plutocratically weighted CPIH (as published) and democratically weighted CPIH, 12-month growth rates
UK, January 2006 to December 2016
Source: Office for National Statistics
Download this chart Figure 5b: Plutocratically weighted CPIH (as published) and democratically weighted CPIH, 12-month growth rates
Image .csv .xlsHistorically, the democratically-weighted CPIH typically grows at a faster rate than the plutocratic-weighted CPIH (as published). This difference is greatest in earlier years of the analysis (2006 to 2007), however, it has converged over recent years (2014 to 2016). On average, the plutocratically-weighted CPIH growth rate (as published) is around 0.1% lower than the democratically-weighted CPIH growth rate between 2006 and 2016.
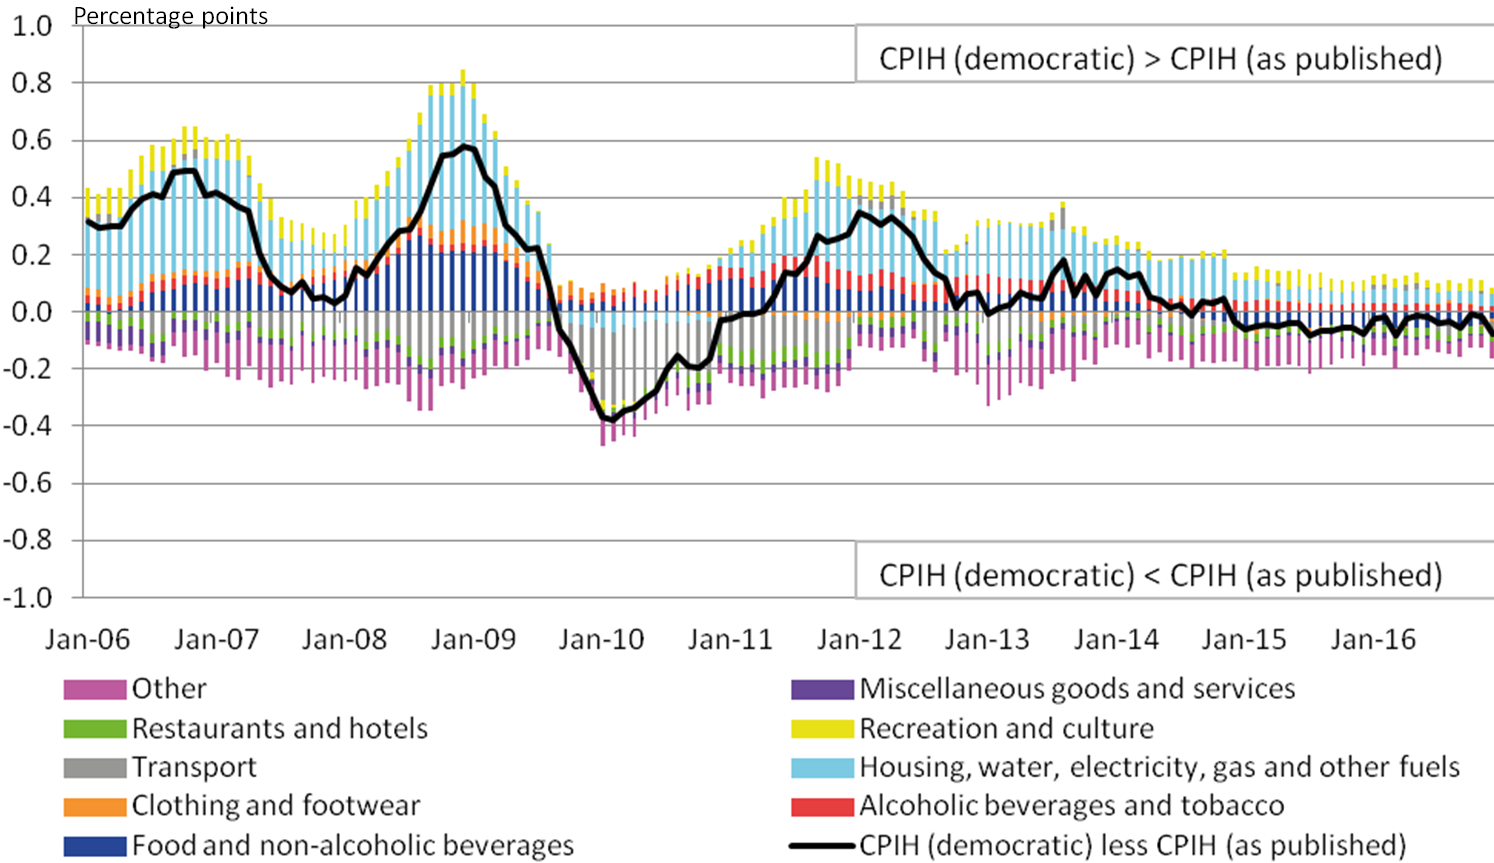
To explore these trends further, Figure 6 shows the differences in the contributions between the democratically-weighted CPIH and plutocratically-weighted CPIH (as published). This shows the main drivers of the differences between the 12-month growth rates for the two indices.
Figure 6: Contributions to the difference between 12-month growth rates for plutocratically weighted CPIH (as published) and democratically weighted CPIH, percentage points
UK, January 2006 to December 2016
Source: Office for National Statistics
Notes:
- Stacked bar charts reflect the difference in percentage point contributions of each of the 87 class level items (defined using COICOP categorisation) to the 12-month growth rate between plutocratically weighted CPIH (as published) and democratically weighted CPIH. The contribution of each of the 87 class level items is estimated separately, before being aggregated to the categories above. Note that a reduction in the contribution to the 12-month growth rate need not imply falling prices; it could also reflect a lower rate of growth than observed in the previous year.
- Other is comprised of the following divisions (as defined using COICOP categorisation): furniture, household equipment and maintenance; health; communication; and education. All other divisions are presented in their own right.
- Contributions may not sum due to rounding.
Download this image Figure 6: Contributions to the difference between 12-month growth rates for plutocratically weighted CPIH (as published) and democratically weighted CPIH, percentage points
.png (347.1 kB) .xls (46.6 kB)
When the democratically-weighted CPIH is growing at a faster rate to the plutocratically-weighted CPIH (as published), the main contributions are from housing and housing services, and food and drink. These categories of item receive a larger weight in the democratic index than the plutocratic index, so when prices increase for these items, the increases naturally contribute more to the democratically-weighed rate of inflation. These are partially offset by higher contributions to the plutocratic CPIH (as published) from transport, restaurants and hotels, and other items, which have a higher weight in the plutocratically-weighted CPIH than the democratically-weighted CPIH.
The differences in contributions since 2014 have converged and the contributions that would typically cause the democratically-weighted CPIH to experience stronger growth (from housing and housing-related services) have declined and are offset by contributions that would typically cause the plutocratic index to experience stronger growth (from restaurants, hotels and other items). This results in the difference between the indices in this period being almost negligible.
The results of using the RPI trimming methodology (excluding the top 4% of high earners from the underlying LCF data and those who receive at least 75% of their income from State Pensions and benefit) are presented alongside equal trimming of the income distribution in Figure 7. Equal trimming refers to a method where the households in the top and bottom 10% of the income distribution are removed from the LCF dataset and plutocratic weights are calculated based on this data. The democratically-weighted CPIH and plutocratically-weighted CPIH (as published) are presented for comparison.
Figure 7: Trimmed expenditure CPIH (equal trimming and RPI trimming) compared with democratically weighted CPIH and plutocratically weighted CPIH (as published)
UK, January 2005 to December 2016
Source: Office for National Statistics
Download this chart Figure 7: Trimmed expenditure CPIH (equal trimming and RPI trimming) compared with democratically weighted CPIH and plutocratically weighted CPIH (as published)
Image .csv .xlsWhen trimming the tails of the income distribution (using either the RPI method or equal 10% trimming) the resulting indices are extremely similar to the plutocratically-weighted CPIH (as published).
This is demonstrated further in Figure 8, where the 12-month growth rates for each index are provided.
Figure 8: Trimmed expenditure CPIH (equal trimming and RPI trimming) compared with democratically weighted CPIH and plutocratically weighted CPIH (as published), 12-month growth rates
UK, January 2006 to December 2016
Source: Office for National Statistics
Download this chart Figure 8: Trimmed expenditure CPIH (equal trimming and RPI trimming) compared with democratically weighted CPIH and plutocratically weighted CPIH (as published), 12-month growth rates
Image .csv .xlsDuring periods where there are greater differences between the plutocratically-weighted CPIH (as published) and the democratically-weighted CPIH, the indices with households trimmed at the top and bottom tails of the income distribution are broadly in line with the plutocratically-weighted CPIH. Differences between growth rates in the remaining periods are minimal for all indices.
As democratic weighting aims to estimate the average expenditure shares of households, it may be more appropriate to approximate a democratic index using trimming methods on the expenditure distribution, as opposed to the income distribution. Figure 9 shows the resulting index when the bottom and top 10% of households in the expenditure distribution are removed from the analysis.
Figure 9: Trimmed expenditure CPIH (on income and expenditure distributions), compared with democratically weighted CPIH and plutocratically weighted CPIH (as published)
UK, January 2005 to December 2016
Source: Office for National Statistics
Download this chart Figure 9: Trimmed expenditure CPIH (on income and expenditure distributions), compared with democratically weighted CPIH and plutocratically weighted CPIH (as published)
Image .csv .xlsTrimming equal tails of the expenditure distribution does not appear to provide a better approximation of a democratic index. Again, this method results in an index that is typically consistent with the plutocratically-weighted CPIH (as published).
Equally trimming household expenditure from both the income and expenditure distributions assumes that both these distributions are symmetrical, meaning that there are an equal number of households above and below the mean household income, or the mean household expenditure. This is unlikely to be the case as these distributions are typically positively skewed due to extremely high-spending or high-income households. Therefore the impact of unequal trimming is investigated. This is where 5% of households at the bottom tail of the expenditure distribution have been removed and 15% of households from the top tail of the expenditure distribution have been removed. The resulting 12-month growth rates are presented in Figure 10.
Figure 10: Trimmed expenditure CPIH (equal and unequal trimming) compared to democratically weighted CPIH and plutocratically weighted CPIH (as published), 12-month growth rates
UK, January 2006 to December 2016
Source: Office for National Statistics
Download this chart Figure 10: Trimmed expenditure CPIH (equal and unequal trimming) compared to democratically weighted CPIH and plutocratically weighted CPIH (as published), 12-month growth rates
Image .csv .xlsThe 12-month growth rate based on unequal trimming on the expenditure distribution is more in line with the democratically-weighted inflation rate suggesting that this would be the most appropriate method of trimming to use, were you trying to use this method to approximate the democratic method of weighting.
Nôl i'r tabl cynnwys4. Conclusion
This article presents analysis of the impact of using different data sources and different weighting methods on the Consumer Prices Index including owner occupiers’ housing costs (CPIH).
The data sources that are currently used to construct weights for different price indices have been explored and it has been demonstrated that using different sources to construct weights result in large differences between the 12-month growth rates. The 12-month growth rate is typically higher using Living Costs and Food (LCF) as the primary source of expenditure to construct the weights; however, in more recent periods this index shows negative growth, while the CPIH (as published) shows slow yet positive growth.
The democratically-weighted index displayed a higher 12-month growth rate on average than the plutocratically-weighted CPIH (as published); however, in recent years the difference between the two indices has converged and the democratic index grows at a slower rate to the plutocratic CPIH (as published) in some months.
Many of the differences in the expenditure weights between the democratically-weighted CPIH and plutocratically-weighted CPIH (as published) can be explained by the notion that low expenditure households spend a larger proportion of their household budget on “essential” goods and services, and therefore these items have a greater influence on the democratically-weighted rate of inflation.
The analysis on “trimming” households before producing weights also presents some interesting findings. The main finding that can be drawn from this research is that most trimming methods do not approximate a democratically-weighted index. When unequal trimming is used on the tails of the expenditure distribution, the 12-month growth rate moves closer to the democratic inflation rate, as a result of the skewed nature of the expenditure distribution; however, the differences between all growth rates using different methods of weighting are relatively minor.
There are smaller differences between indices constructed using different weighting methods than between indices based on weights constructed from different data sources. The benefits and limitations of each underlying data source should therefore be carefully considered when developing new price indices.
Nôl i'r tabl cynnwys6. Annex A
Differences between weighting methods using LCF data to construct weights
Plutocratically- and democratically-weighted indices are presented in Figure 11 that have been calculated using just Living Costs and Food (LCF) expenditure data to construct the weights. All other methods are consistent with the Consumer Prices Index including owner occupiers’ housing costs (CPIH).
Figure 11: Plutocratic and democratic indices, using LCF expenditure data to construct weights
UK, January 2005 to December 2016
Source: Office for National Statistics
Download this chart Figure 11: Plutocratic and democratic indices, using LCF expenditure data to construct weights
Image .csv .xlsThe democratic index, using LCF data to construct the weights, is greater than the comparable plutocractic index by around 1.2 percentage points between the periods 2005 and 2016.
Figure 12: Plutocratic and democratic 12-month growth rates (%) using LCF expenditure data to construct weights
UK, January 2006 to December 2016
Source: Office for National Statistics
Download this chart Figure 12: Plutocratic and democratic 12-month growth rates (%) using LCF expenditure data to construct weights
Image .csv .xlsThe 12-month growth rates based on LCF data follow the same pattern as the CPIH- consistent data. Democratic weighting results in a higher growth rate in earlier periods; however, since 2014 the difference between rates using the two different methods has converged.
Figure 13: Trimmed indices (using the income and expenditure distributions) compared to plutocratic and democratic indices, using LCF data to construct weights
UK, January 2005 to December 2016
Source: Office for National Statistics
Download this chart Figure 13: Trimmed indices (using the income and expenditure distributions) compared to plutocratic and democratic indices, using LCF data to construct weights
Image .csv .xlsWhen the income distribution is trimmed using the LCF data, the resulting index tracks the plutocratic index very closely. When we trim the tails of the expenditure distribution, the resulting index still tracks the plutocratic index very closely, but exhibits a slight shift in the direction of the democratic index. These results are comparable with those found when looking at CPIH-consistent expenditure data (for example, Figure 9).
Figure 14: Trimmed indices (using the income and expenditure distributions) compared to plutocratic and democratic indices, using LCF data to construct weights, 12-month growth rate
UK, January 2006 to December 2016
Source: Office for National Statistics
Download this chart Figure 14: Trimmed indices (using the income and expenditure distributions) compared to plutocratic and democratic indices, using LCF data to construct weights, 12-month growth rate
Image .csv .xlsThe 12-month growth rates tell a similar story, with all methods of weighting resulting in similar trends in the 12-month growth rate. The differences between the indices in most recent years (2014 onwards) are negligible.
Figure 15: Trimmed indices (using equal trimming and the RPI method) compared to plutocratic and democratic indices using LCF data to construct weights, 12-month growth rate
UK, January 2006 to December 2016
Source: Office for National Statistics
Download this chart Figure 15: Trimmed indices (using equal trimming and the RPI method) compared to plutocratic and democratic indices using LCF data to construct weights, 12-month growth rate
Image .csv .xlsRPI trimming using the LCF data was also compared with the plutocratic and democratic indices using the same source. This produces inflation rates similar to those when we trim on income, which is an intuitive result and is similar to what occurs with CPIH-consistent data (Figure 8).
Nôl i'r tabl cynnwys