Cynnwys
- Main points
- Changes to publication schedule for economic statistics
- What is the Producer Price Index (PPI)?
- Output prices: summary
- Supplementary analysis: output prices
- Output prices: detailed commentary
- Output Producer Price Index range of movements
- Input prices: summary
- Supplementary analysis: input prices
- Input prices: detailed commentary
- Input PPI indices range of movements
- Economic context
- Revisions
- Quality and methodology
- Planned changes to methods for Producer Prices Index and Services Producer Prices Index
- Background notes
1. Main points
The price of goods bought and sold by UK manufacturers, as estimated by the Producer Price Index, rose again in the year to November 2016. This is the fifth consecutive increase following 2 years of falls and the largest increase since April 2012. Between October and November, total output prices showed no movement, compared with an increase of 0.7% the previous month.
Factory gate prices (output prices) for goods produced by UK manufacturers rose 2.3% in the year to November 2016, compared with an increase of 2.1% in the year to October 2016.
Core factory gate prices, which exclude the more volatile food, beverage, tobacco and petroleum products, rose 2.2% in the year to November 2016, the largest increase since February 2012.
The overall price of materials and fuels bought by UK manufacturers for processing (total input prices) rose 12.9% in the year to November 2016, compared with a rise of 12.4% in the year to October 2016. Between October and November, total input prices fell by 1.1%, compared with a record increase of 4.5% the previous month.
Core input prices, which exclude purchases from the more volatile food, beverage, tobacco and petroleum industries, rose 11.5% in the year to November 2016, compared with a rise of 10.3% in the year to October 2016.
Nôl i'r tabl cynnwys2. Changes to publication schedule for economic statistics
From January 2017 we are improving the way we publish economic statistics, with related data grouped together under new "theme" days. This will increase the coherence of our data releases and involve minor changes to the timing of certain publications. For more information see Changes to publication schedule for economic statistics.
Nôl i'r tabl cynnwys3. What is the Producer Price Index (PPI)?
The Producer Price Index (PPI) is a monthly survey that measures the price changes of goods bought and sold by UK manufacturers and provides an important measure of inflation, alongside other indicators such as Consumer Prices Index (CPI) and Services Producer Price Index (SPPI). This statistical bulletin contains a comprehensive selection of data on input and output index series. It contains producer price indices of materials and fuels purchased, and output of manufacturing industry by broad sector.
The factory gate price (the output price) is the price of goods sold by UK manufacturers. It includes costs such as labour, raw materials and energy, as well as interest on loans, site or building maintenance, or rent and excludes taxes.
Core factory gate inflation excludes price movements from food, beverage, petroleum, and tobacco and alcohol products, which tend to have volatile price movements. It should give a better indication of the underlying output inflation rates.
The input price indices measure change in the prices of materials and fuels bought by UK manufacturers for processing. These are not limited to just those materials used in the final product, but also include what is required by the company in its normal day-to-day running.
Core input inflation strips out purchases from the volatile food, beverage, tobacco and petroleum industries to give an indication of the underlying input inflation pressures facing the UK manufacturing sector.
Nôl i'r tabl cynnwys4. Output prices: summary
Factory gate inflation rose 2.3% in the year to November 2016, compared with a rise of 2.1% in the year to October 2016. This is the fifth consecutive increase following 2 years of falling prices and the largest increase since April 2012, when prices also rose by 2.3%.
Between 2014 and 2015, total output inflation remained consistently below core output price inflation. However, in 2016, although both total and core output inflation have been showing an upwards trend, total output inflation has been growing strongly and is now at a higher level than core factory gate inflation (Figure 1).
Looking at the latest estimates (Table 1), movements in factory gate prices on the year to November 2016 were as follows:
factory gate prices rose 2.3%, compared with a rise of 2.1% in the year to October 2016
core factory gate prices rose 2.2%, compared with a rise of 2.0% in the year to October 2016
factory gate inflation excluding excise duty rose 2.3%, compared with a rise of 2.2% in the year to October 2016
Between October and November 2016:
factory gate prices showed no movement, compared with an increase of 0.7% in October 2016
core factory gate prices showed no movement, compared with an increase of 0.5% last month
Table 1: Output prices, June 2016 to November 2016, UK
| Percentage change | |||||||
| All manufactured products | Excluding food, beverage, tobacco and petroleum | All manufactured products excluding duty | |||||
| 1 month | 12 months | 1 month | 12 months | 1 month | 12 months | ||
| 2016 | Jun | 0.3 | -0.2 | 0.1 | 0.7 | 0.3 | -0.1 |
| Jul | 0.2 | 0.2 | 0.6 | 1.2 | 0.2 | 0.2 | |
| Aug | 0.2 | 0.8 | 0.2 | 1.5 | 0.2 | 0.8 | |
| Sep | 0.3 | 1.2 | 0.0 | 1.4 | 0.3 | 1.2 | |
| Oct | 0.7 | 2.1 | 0.5 | 2.0 | 0.7 | 2.2 | |
| Nov | 0.0 | 2.3 | 0.0 | 2.2 | -0.1 | 2.3 | |
| Source: Office for National Statistics | |||||||
Download this table Table 1: Output prices, June 2016 to November 2016, UK
.xls (25.6 kB)
Figure 1: Output prices
UK, November 2012 to November 2016
Source: Office for National Statistics
Download this chart Figure 1: Output prices
Image .csv .xls5. Supplementary analysis: output prices
Table 2 shows the annual percentage change in price across all product groups and Figure 2 shows their contribution to the annual factory gate inflation rate.
Table 2: Output prices, 12-months change, November 2016, UK
| Product group | Percentage change |
| Food products | 0.9 |
| Tobacco and alcohol (incl. duty) | 2.3 |
| Clothing, textile and leather | 1.3 |
| Paper and printing | 0.9 |
| Petroleum products (incl. duty) | 8.3 |
| Chemical and pharmaceutical | 2.9 |
| Metal, machinery and equipment | 2.2 |
| Computer, electrical and optical | 1.4 |
| Transport equipment | 3.2 |
| Other manufactured products | 1.9 |
| All manufacturing | 2.3 |
| Source: Office for National Statistics |
Download this table Table 2: Output prices, 12-months change, November 2016, UK
.xls (26.6 kB)
Figure 2: Output prices, contribution to 12 months' growth rate
UK, November 2016
Source: Office for National Statistics
Download this chart Figure 2: Output prices, contribution to 12 months' growth rate
Image .csv .xlsTable 3 shows the monthly percentage change in price across all product groups and Figure 3 shows their contribution to the 1- month factory gate inflation rate.
Table 3: Output prices, 1-month change, November 2016, UK
| Product group | Percentage change |
| Food products | 0.2 |
| Tobacco and alcohol (incl. duty) | 0.4 |
| Clothing, textile and leather | 0.1 |
| Paper and printing | 0.1 |
| Petroleum products (incl. duty) | -1.1 |
| Chemical and pharmaceutical | 0.2 |
| Metal, machinery and equipment | -0.1 |
| Computer, electrical and optical | 0.0 |
| Transport equipment | -0.4 |
| Other manufactured products | -0.1 |
| All manufacturing | 0.0 |
| Source: Office for National Statistics | |
Download this table Table 3: Output prices, 1-month change, November 2016, UK
.xls (26.6 kB)
Figure 3: Output prices, contribution to 1-month growth rate
UK, November 2016
Source: Office for National Statistics
Download this chart Figure 3: Output prices, contribution to 1-month growth rate
Image .csv .xls6. Output prices: detailed commentary
Factory gate prices rose 2.3% in the year to November 2016, compared with a rise of 2.1% in the year to October 2016. This is now the fifth annual increase in a row. All product groups showed increases in the year to November 2016 with the main contribution to the increase coming from petroleum products. An increase in the price of transport equipment and other manufactured products also contributed towards the rise in the output price of manufactured products (Figure 2).
Petroleum products rose 8.3% in the year to November 2016, compared with a rise of 8.0% in the year to October 2016. This is the third increase in a row following 3 years of consecutive falls and the largest upwards movement in the index since December 2011. The main contributions to this rise came from diesel and gas oil, motor spirit and aviation turbine fuel (avtur), with prices rising by 6.8%, 8.1% and 20.9% respectively in the year.
Transport equipment prices increased 3.2% in the year to November 2016, compared with an increase of 3.3% in the year to October 2016. All sections within transport equipment showed increases in the annual rate with the largest upward contribution from motor vehicles, trailers and semi-trailers, which rose 2.9%.
Other manufactured product prices rose 1.9% in the year to November 2016, compared with a rise of 2.1% in the year to October 2016. The main contributors to this increase were from other manufactured goods, and repair and installation of service machinery, which increased 2.4% and 7.2% respectively in the year to November 2016.
The monthly output price showed no movement between October and November 2016, compared with an increase of 0.7% between September and October 2016. Most sectors showed small monthly movements with petroleum products and transport equipment providing the largest downward contributions. Offset by tobacco and alcohol, which provided the largest upward contribution to the monthly rate (Figure 3).
Petroleum products prices fell 1.1% between October and November 2016, compared with an increase of 5.0% between September and October 2016. The main contributor to the fall came from diesel and gas oil, which decreased 3.2%.
Transport equipment prices decreased by 0.4% between October and November 2016, compared with an increase of 0.7% between September and October 2016. A decrease of 0.6% in the price for motor vehicles, trailers and semi-trailers was the only contributor to this downward movement.
Tobacco and alcohol prices provided the largest upwards contribution, increasing 0.4% between October and November 2016 compared with no movement between September and October 2016. Tobacco products provided the largest contribution to this increase, with prices rising 0.8%.
Core factory gate inflation
Core factory gate prices, which exclude the more volatile food, beverage, tobacco and petroleum product prices, giving a measure of underlying factory gate inflation, rose 2.2% in the year to November 2016, compared with an increase of 2.0% in the year to October. This increase of 2.2% is the largest annual movement seen in core factory gate prices in over 4 years. The largest contributors to this rise were transport equipment and other manufactured products.
The monthly core factory gate price index showed no movement between October and November, compared with an increase of 0.5% last month.
Output Producer Price Index contribution to change in rate
The annual percentage rate for the output Producer Price Index (PPI) in November 2016 increased 2.3%, compared with a rise of 2.1% the previous month resulting in an increase in the annual rate of 0.2 percentage points. Food products; clothing, textiles and leather; alcohol and tobacco; and chemicals and pharmaceuticals were the main contributors to the change in the 12-month rate.
Figure 4: Output PPI 12-month contribution to change in annual rate between October and November 2016
UK
Source: Office for National Statistics
Notes:
- The components may not sum exactly to the overall change in the rate due to rounding.
Download this chart Figure 4: Output PPI 12-month contribution to change in annual rate between October and November 2016
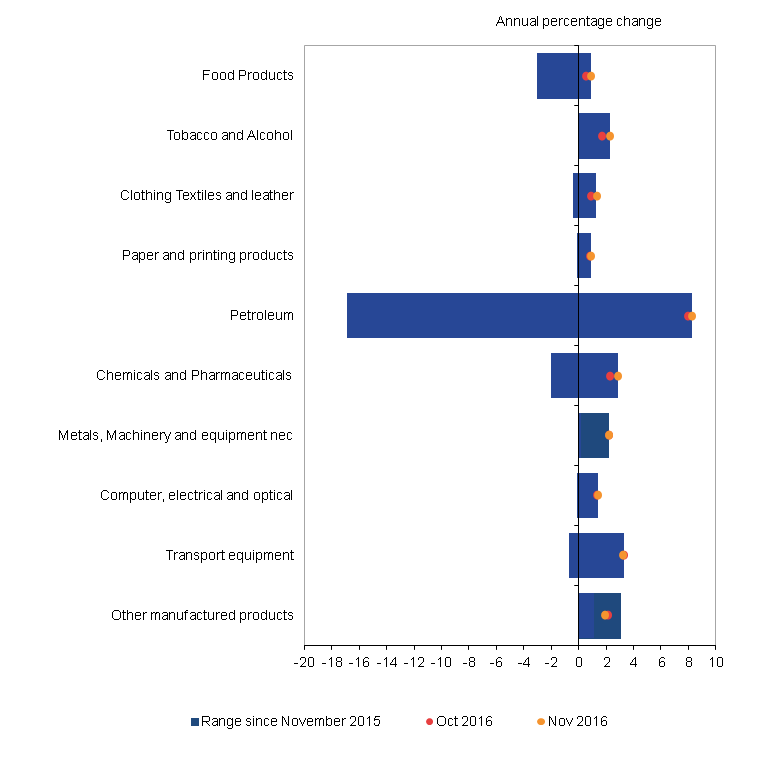
Image .csv .xls7. Output Producer Price Index range of movements
Figure 5 shows the year-on-year growth in output Producer Price Index (PPI) by grouping for the latest 2 months and the range of the price changes that have been seen in these sections since November 2015. It can be seen that the majority of output PPI indices have experienced little variance in inflation in the past 12 months. Petroleum shows the biggest decrease and increase, as well as the largest range of movements; ranging from a fall of 16.9% on the year in November 2015 to an increase of 8.3% in November 2016.
Figure 5: Output PPI range of movements
UK, November 2015 to November 2016
Source: Office for National Statistics
Notes:
- nec = not elsewhere classified
Download this image Figure 5: Output PPI range of movements
.png (31.1 kB) .xls (28.7 kB)
8. Input prices: summary
Between 2014 and 2015, the annual movements in total input prices (including materials and fuels) remained below core input prices (excluding purchases from food, beverage, tobacco and petroleum industries). However, in 2016 although both total and core input inflation have been showing an upwards trend, total input inflation has been growing strongly and is now at a higher level than core input inflation (Figure 6).
The price of imported materials as a whole (including crude oil) rose 14.6%, compared with an increase of 14.0% in the year to October 2016; this index has now been rising, consistently since July 2016 and this is the largest increase on the year since September 2011.
Looking at the latest data (Table 4), the main movements in the year to November 2016 were as follows:
the total input price index rose 12.9%, compared with a rise of 12.4% in the year to October 2016
the core input price index saw a rise of 11.5%, compared with a rise of 10.3% in the year to October 2016
Between October and November 2016:
the total input price index decreased 1.1% compared with a rise of 4.5% between September and October
the seasonally adjusted input price index for the manufacturing industry excluding the food, beverage, tobacco and petroleum industries (Table 4) fell 0.6%, compared with an increase of 3.4% between September and October
Table 4: Input prices, June 2016 to November 2016, UK
| Percentage change | ||||||
| Materials and fuels purchased | Excluding purchases from food, beverage, tobacco and petroleum industries | |||||
| 1 month | 12 months | 1 month | 12 months | 1 month | ||
| (NSA)1 | (NSA)1 | (NSA)1 | (NSA)1 | (SA)2 | ||
| 2016 | Jun | 1.7 | -0.5 | 0.7 | -0.3 | 1.0 |
| Jul | 3.2 | 4.2 | 4.3 | 5.1 | 4.4 | |
| Aug | 0.4 | 7.9 | 0.3 | 6.4 | 0.0 | |
| Sep | 0.2 | 7.5 | -0.4 | 5.2 | -0.5 | |
| Oct | 4.5 | 12.4 | 4.1 | 10.3 | 3.4 | |
| Nov | -1.1 | 12.9 | -0.3 | 11.5 | -0.6 | |
| Source: Office for National Statistics | ||||||
| Notes: | ||||||
| 1. NSA: Not Seasonally Adjusted | ||||||
| 2. SA: Seasonally Adjusted | ||||||
Download this table Table 4: Input prices, June 2016 to November 2016, UK
.xls (25.6 kB)
Figure 6: Input prices (materials and fuel)
UK, November 2012 to November 2016
Source: Office for National Statistics
Download this chart Figure 6: Input prices (materials and fuel)
Image .csv .xlsNotes for input prices: summary
Input price indices include the Climate Change Levy which was introduced in April 2001.
Input price indices include the Aggregate Levy which was introduced in April 2002.
9. Supplementary analysis: input prices
Table 5 and Figure 7 show the percentage change in the price of the main commodities groups over the year and their contributions to the total input index.
Table 5: Input prices, 12-months change, November 2016, UK
| Product group | Percentage change |
| Fuel including Climate Change Levy | 2.1 |
| Crude oil | 22.3 |
| Home food materials | 13.4 |
| Imported food materials | 11.5 |
| Other home-produced materials | -0.3 |
| Imported metals | 35.3 |
| Imported chemicals | 9.7 |
| Imported parts and equipment | 10.5 |
| Other imported materials | 12.8 |
| All manufacturing | 12.9 |
| Source: Office for National Statistics |
Download this table Table 5: Input prices, 12-months change, November 2016, UK
.xls (26.6 kB)
Figure 7: Input prices, contribution to 12-months' growth rate
UK, November 2016
Source: Office for National Statistics
Download this chart Figure 7: Input prices, contribution to 12-months' growth rate
Image .csv .xlsTable 6 and Figure 8 show the percentage change in the price of the main commodities groups over the month and their contributions to the total input index.
Table 6: Input prices, 1-month change, November 2016, UK
| Product group | Percentage change |
| Fuel including Climate Change Levy | 1.9 |
| Crude oil | -7.9 |
| Home food materials | 1.2 |
| Imported food materials | -0.1 |
| Other home-produced materials | -0.1 |
| Imported metals | 3.3 |
| Imported chemicals | -0.7 |
| Imported parts and equipment | -1.6 |
| Other imported materials | -1.1 |
| All manufacturing | -1.1 |
| Source: Office for National Statistics | |
Download this table Table 6: Input prices, 1-month change, November 2016, UK
.xls (26.1 kB)
Figure 8: Input prices, contribution to 1-month growth rate
UK, November 2016
Source: Office for National Statistics
Download this chart Figure 8: Input prices, contribution to 1-month growth rate
Image .csv .xls10. Input prices: detailed commentary
The overall input index for all manufacturing, which measures changes in the price of materials and fuels purchased by manufacturers, rose 12.9% in the year to November 2016, compared with a rise of 12.4% in the year to October 2016. The main upwards contributions to the index came from crude oil, imported metals, and imported parts and equipment.
The monthly input index decreased 1.1% between October and November 2016, compared with an increase of 4.5% between September and October 2016 (see Table 6 and Figure 8).
Crude oil rose 22.3% in the year to November 2016, compared with an increase of 24.2% in the year to October 2016. This is the fourth increase in the annual rate of crude oil prices following 34 months of falling prices. Imported crude petroleum and natural gas was the main contributor to this rise, with an increase of 20.8% compared with an increase of 22.6% in the year to October 2016. This is the fourth increase we have seen in this index in a row.
Imported metals prices rose 35.3% in the year to November 2016, compared with a rise of 26.2% in the year to October 2016; this is the largest increase on the year since recent records began. The main contribution came from imported products used in the manufacture of other basic metals and casting, which rose 35.1%, compared with an increase of 26.3% in the year to October 2016. This increase of 35.1% is the largest increase on the year since recent records began.
Home-produced food prices increased 13.4% in the year to November 2016, compared with a rise of 12.5% in the year to October 2016. This is the largest upward movement seen in this index since July 2011. The main contribution to the rise came from crop and animal production; hunting and related services, which rose 13.2% compared with an increase of 12.1% in the year to October 2016.
Core input price index (excluding purchases from the food, beverage, tobacco and petroleum industries)
The seasonally adjusted core input price index rose 11.3% in the year to November 2016, compared with a rise of 10.2% in the year to October 2016, the largest upwards movement on the year since January 2009. Between October and November 2016, the index fell 0.6%, compared with a rise of 3.4% between September and October 2016.
The unadjusted core input price index rose 11.5% in the year to November 2016, compared with a rise of 10.3% in the year to October 2016. This is the fifth month of rising prices in this index following almost 3 years of falling prices. The monthly index fell 0.3% between October and November 2016, compared with an increase of 4.1% between September and October 2016.
Input Producer Price Index contribution to change in rate
The annual percentage rate for the input Producer Price Index (PPI) in November 2016 rose 12.9% compared with a rise of 12.4% last month, resulting in a change to the annual rate of 0.5 percentage points. The largest contributions to this increase came from imported metals, imported chemicals and fuel (Figure 9).
Figure 9: Input PPI 12-month contribution to change in annual rate between October and November 2016
UK
Source: Office for National Statistics
Notes:
- The components may not sum exactly to the overall change in the rate due to rounding.
Download this chart Figure 9: Input PPI 12-month contribution to change in annual rate between October and November 2016
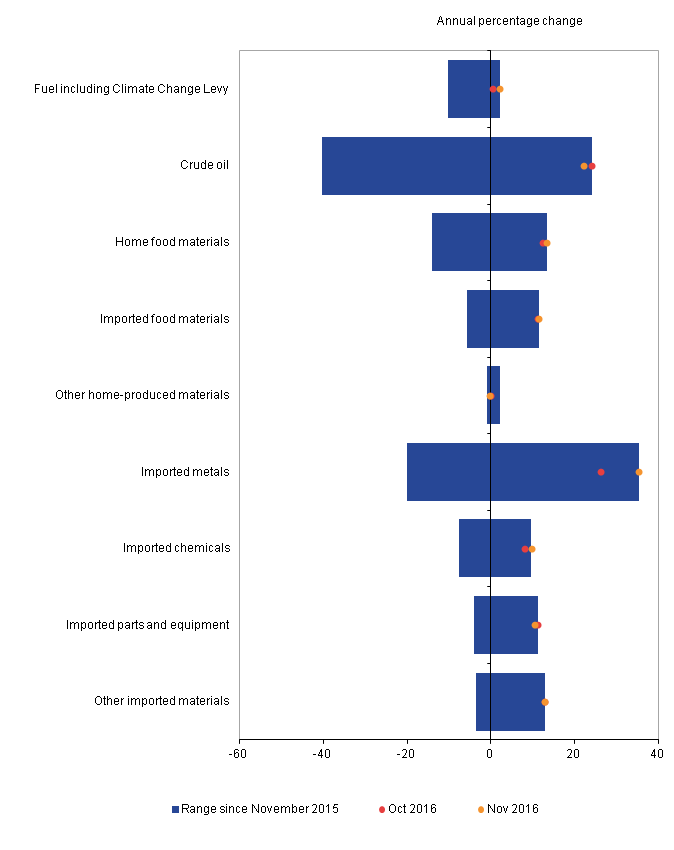
Image .csv .xls11. Input PPI indices range of movements
Figure 10 shows the year-on-year growth in input Producer Price Index (PPI) by grouping for the latest 2 months and the range of the price changes that have been seen in these groupings since November 2015. Crude oil shows the biggest decrease in the 12-month period and also the largest range of movements, from a fall of 40.4% in November 2015 to a rise of 24.2% in October 2016.
Figure 10: Input PPI range of movements
UK, November 2015 to November 2016
Source: Office for National Statistics
Download this image Figure 10: Input PPI range of movements
.png (30.3 kB) .xls (28.7 kB)
12. Economic context
Input producer prices increased by 12.9% in the year to November 2016, compared to a 12.4% increase in the year to October 2016. Output producer prices increased by 2.3% in the year to November 2016, compared to a 2.1% increase in the year to October 2016. This month is the fifth in a period of consecutive increases in both input and output producer prices since July 2016.
Figure 11:Contributions to Input PPI by component
UK, November 2013 to November 2016
Source: Office for National Statistics
Download this chart Figure 11:Contributions to Input PPI by component
Image .csv .xlsFigure 11 shows that imported products and crude oil are continuing to drive contributions to growth in input producer prices in the year to November 2016. The largest single contributor was crude oil, comprising 2.9 percentage points of the growth in input producer prices, while all imported goods contributed 7.8 percentage points to the overall growth of 12.9%
These changes can be related to a changing oil price and recent sterling depreciation.
Figure 12: 12 month change in United States Dollar(USD) crude oil price and Pound Sterling to USD exchange rate
UK, November 2013 to November 2016
Source: Financial Times, Bank of England
Notes:
- For the £ and $ exchange rate series bars which are above the x axis represent a depreciation of the value of the sterling compared with the dollar over that past 12 months.
Download this chart Figure 12: 12 month change in United States Dollar(USD) crude oil price and Pound Sterling to USD exchange rate
Image .csv .xlsFigure 12 shows recent changes in the oil price and sterling to dollar exchange rate. From August 2016 $ Brent crude price deflation has moderated and from October 2016 growth has turned positive. Alongside this, in the year to November 2016 sterling became 22.2% weaker compared with the dollar. A combination of these changes has started to put upwards pressure on input producer prices.
Although weakness in sterling continues to put upward pressure on most imported Producer Price Index (PPI ) components, this eased somewhat during November. However, costs continued to increase for UK manufacturers buying imported metals. This component was the second largest contributor to growth in input producer prices at 2.4 percentage points of the total.
In November 2016 the largest contribution to output PPI growth came from refined petroleum products which contributed 0.6 percentage points to the 2.3% annual growth. This is a slight increase from the 0.5 percentage point contribution in the year to October 2016, which reflects the rising pressure from the crude oil input PPI component.
Further analysis of PPI alongside Consumer Prices Index (CPI) analysis is published in our Additional Analysis of the CPI and PPI article.
Nôl i'r tabl cynnwys13. Revisions
For this bulletin, Producer price index dataset Tables 8R and 9R highlight revisions to movements in price indices previously published in last month’s statistical bulletin. These are mainly caused by changes to the most recent estimates as more price quotes are received, and revisions to seasonal adjustment factors, which are re-estimated every month.
For more information about our revisions policy, see our website.
Table 7: Revisions between first publication and estimates 12-months later, UK
| % | |||
| Value in latest period | Revisions between first publication and estimates 12 months later | ||
| Average over the last 5 years | Average over the last 5 years without regard to sign (average absolute revision) | ||
| Total output (JVZ7) - 12 months | 2.3 | -0.08 | 0.13 |
| Total output (JVZ7) - 1 month | 0.0 | -0.01 | 0.07 |
| Total input (K646) - 12 months | 12.9 | 0.02 | 0.33 |
| Total input (K646) - 1 month | -1.1 | 0.02 | 0.28 |
| Source: Office for National Statistics | |||
| Notes: | |||
| 1. *Statistically significant | |||
Download this table Table 7: Revisions between first publication and estimates 12-months later, UK
.xls (25.1 kB)Revisions to data provide one indication of the reliability of main indicators. Table 7 shows summary information on the size and direction of the revisions which have been made to the data covering a 5-year period. A statistical test has been applied to the average revision to find out if it is statistically significantly different from zero. The inclusion of an asterisk (*) would show the test is significant.
Table 7 presents a summary of the differences between the first estimates published between 2011 and 2015 and the estimates published 12 months later. These numbers include the effect of the reclassification onto Standard Industrial Classification (SIC) 2007.
Spreadsheets giving revisions triangles of estimates for all months from February 1998 through to November 2016 and the calculations behind the averages in the table are available in the producer price inflation datasets.
Revision triangle for total output (12 months)
Revision triangle for total output (1 month)
Revision triangle for total input (12 months)
Revision triangle for total input (1 month)
Nôl i'r tabl cynnwys14. Quality and methodology
The PPI Quality and Methodology Information document contains important information on:
the strengths and limitations of the data and how it compares with related data
users and uses of the data
how the output was created
the quality of the output including the accuracy of the data
15. Planned changes to methods for Producer Prices Index and Services Producer Prices Index
An article has been published alongside this Producer Prices Index (PPI) release, outlining upcoming changes and improvements due to be delivered to Services Producer Prices Index (SPPI) and PPI (in particular exported outputs and imported inputs) throughout 2017 to 2018.
Firstly, the Short Term Statistics (STS) regulation, under which the aforementioned statistics are currently published, will be replaced by the Framework Regulation Integrating Business Statistics (FRIBS). This is a European regulation aimed at ensuring EU member states report data on a common basis, but will also include important improvements which are vital for improving the UK National Accounts' (NA) ability to calculate economic measures; such as Gross Domestic Product (GDP). It will provide more complete measures of price change in the service sector, primarily by broadening the coverage from “'Business to Business”' transactions to “'Business to All”' , and assist users, such as the Bank of England (BoE), in making assessments of and monitoring the UK economy which is essential for policy making. This change in regulation will come into force in 2019.
The second change will relate to the sample size of SPPI, exported output and imported inputs within PPI and selection methods of SPPI. The number of prices collected will be increased to 6,000 in each survey and the Services Turnover Survey will be used as a sampling frame for the SPPI. Furthermore, new methodology will be used to ensure efficient use of resource and optimum quality for the resources available.
The paper will detail the scheduled dates the changes will take place, as well as the providing details on the nature of the changes. Users will also be invited to provide feedback and ask any questions regarding the changes.
Nôl i'r tabl cynnwys