Cynnwys
- Main points
- What is the Producer Price Index (PPI)?
- Output prices: summary
- Supplementary analysis: output prices
- Output prices: detailed commentary
- Output PPI range of movements
- Input prices: summary
- Supplementary analysis: input prices
- Input prices: detailed commentary
- Input PPI indices range of movements
- Economic context
- Revisions
- Changes to publication schedule for economic statistics
- Quality and methodology
- Background notes
1. Main points
The price of goods bought and sold by UK manufacturers, as estimated by the Producer Price Index, rose in the year to August 2016. This is the second increase in a row following 2 years of falls.
Factory gate prices (output prices) for goods produced by UK manufacturers rose 0.8% in the year to August 2016, compared with a rise of 0.3% in the year to July 2016.
The index has been following an upward trend since August 2015. The increase of 0.8% in the year to August 2016 is a continuation of the trend over the past year.
Core factory gate prices, which exclude the more volatile food, beverage, tobacco and petroleum products, rose 1.3% in the year to August 2016, compared with a rise of 1.0% in the year to July 2016.
The overall price of materials and fuels bought by UK manufacturers for processing (total input prices) rose 7.6% in the year to August 2016, compared with a rise of 4.1% in the year to July 2016. The large rise in the August 12-month rate was mainly as a result of a large fall in the index in August 2015 which was driven by falling prices for crude oil.
Similar to factory gate prices, total input prices have also been following an upward trend in recent months. With the exception of April 2016, the annual rate has been trending upwards since November 2015.
Core input prices, which exclude purchases from the more volatile food, beverage, tobacco and petroleum industries, rose 6.2% in the year to August 2016, compared with a rise of 5.0% in the year to July 2016.
Nôl i'r tabl cynnwys2. What is the Producer Price Index (PPI)?
The Producer Price Index (PPI) is a monthly survey that measures the price changes of goods bought and sold by UK manufacturers and provides an important measure of inflation, alongside other indicators such as Consumer Price Index (CPI) and Services Producer Price Index (SPPI). This statistical bulletin contains a comprehensive selection of data on input and output index series. It contains producer price indices of materials and fuels purchased, and output of manufacturing industry by broad sector.
The output price indices measure change in the prices of goods produced by UK manufacturers (these are often called “factory gate prices”).
The factory gate price (the output price) is the price of goods sold by UK manufacturers and is the actual cost of manufacturing goods before any additional charges are added, which would give a profit. It includes costs such as labour, raw materials and energy, as well as interest on loans, site or building maintenance, or rent.
Core factory gate inflation excludes price movements from food, beverage, petroleum, and tobacco and alcohol products, which tend to have volatile price movements. It should give a better indication of the underlying output inflation rates.
The input price indices measure change in the prices of materials and fuels bought by UK manufacturers for processing. These are not limited to just those materials used in the final product, but also include what is required by the company in its normal day-to-day running.
The input price is the cost of goods bought by UK manufacturers for use in manufacturing, such as the actual cost of materials and fuels bought for processing.
Core input inflation strips out purchases from the volatile food, beverage, tobacco and petroleum industries to give an indication of the underlying input inflation pressures facing the UK manufacturing sector.
Nôl i'r tabl cynnwys3. Output prices: summary
Factory gate inflation rose 0.8% in the year to August 2016, compared with a rise of 0.3% in the year to July 2016. This is the second annual increase since June 2014.
During 2012 and 2013, core factory gate inflation tended to run at a lower rate than total output inflation and showed a smaller degree of volatility. This trend changed in 2014, as total output fell into negative inflation: a result of the downward pressures from petroleum, which is excluded from the core measure of inflation. In 2015, total output inflation has remained consistently below core output price inflation, with total output averaging a fall of 1.7% during 2015 and core output averaging growth of 0.2% in the same period (Figure A).
Looking at the latest estimates (Table A), movements in factory gate prices over the 12 months to August 2016 were as follows:
- factory gate prices rose 0.8%, compared with a rise of 0.3% in the year to July 2016
- core factory gate prices rose 1.3%, compared with a rise of 1.0% in the year to July 2016
- factory gate inflation excluding excise duty rose 0.8%, compared with a rise of 0.3% in the year to July 2016
Between July and August 2016:
- factory gate prices increased 0.1%, compared with an increase of 0.3% in July 2016
- core factory gate prices increased 0.2%, compared with an increase of 0.4% in July 2016
Table A: Output prices (home sales), UK, March 2016 to August 2016
| Percentage change | |||||||
| All manufactured products | Excluding food, beverage, tobacco and petroleum | All manufactured products excluding duty | |||||
| 1 month | 12 months | 1 month | 12 months | 1 month | 12 months | ||
| 2016 | Mar | 0.5 | -0.7 | 0.1 | 0.3 | 0.4 | -0.7 |
| Apr | 0.4 | -0.5 | 0.2 | 0.5 | 0.4 | -0.4 | |
| May | 0.1 | -0.5 | 0.1 | 0.6 | 0.0 | -0.4 | |
| Jun | 0.3 | -0.2 | 0.1 | 0.7 | 0.3 | -0.1 | |
| Jul | 0.3 | 0.3 | 0.4 | 1.0 | 0.3 | 0.3 | |
| Aug | 0.1 | 0.8 | 0.2 | 1.3 | 0.1 | 0.8 | |
| Source: Office for National Statistics | |||||||
Download this table Table A: Output prices (home sales), UK, March 2016 to August 2016
.xls (25.6 kB)
Figure A: Output prices
UK, August 2012 to August 2016
Source: Office for National Statistics
Download this chart Figure A: Output prices
Image .csv .xls4. Supplementary analysis: output prices
Table B shows the annual percentage change in price across all product groups and Figure B shows their contribution to the annual factory gate inflation rate.
Table B: Output prices, 12 months change, UK, August 2016
| Product group | Percentage change |
| Food products | -1.9 |
| Tobacco and alcohol (incl. duty) | 1.8 |
| Clothing, textile and leather | 0.4 |
| Paper and printing | 0.3 |
| Petroleum products (incl. duty) | -2.0 |
| Chemical and pharmaceutical | -0.5 |
| Metal, machinery and equipment | 1.9 |
| Computer, electrical and optical | 0.8 |
| Transport equipment | 3.0 |
| Other manufactured products | 2.9 |
| All manufacturing | 0.8 |
| Source: Office for National Statistics |
Download this table Table B: Output prices, 12 months change, UK, August 2016
.xls (26.6 kB)
Figure B: Output prices, contribution to 12 months growth rate
UK, August 2016
Source: Office for National Statistics
Download this chart Figure B: Output prices, contribution to 12 months growth rate
Image .csv .xlsTable C shows the monthly percentage change in price across all product groups and Figure C shows their contribution to the month factory gate inflation rate.
Table C: Output prices, 1 month change, UK, August 2016
| Product group | Percentage change |
| Food products | 0.2 |
| Tobacco and alcohol (incl. duty) | 0.4 |
| Clothing, textile and leather | 0.4 |
| Paper and printing | -0.1 |
| Petroleum products (incl. duty) | -1.9 |
| Chemical and pharmaceutical | 0.1 |
| Metal, machinery and equipment | 0.3 |
| Computer, electrical and optical | 0.0 |
| Transport equipment | 0.2 |
| Other manufactured products | 0.2 |
| All manufacturing | 0.1 |
| Source: Office for National Statistics |
Download this table Table C: Output prices, 1 month change, UK, August 2016
.xls (26.6 kB)
Figure C: Output prices, contribution to 1 month growth rate
UK, August 2016
Source: Office for National Statistics
Download this chart Figure C: Output prices, contribution to 1 month growth rate
Image .csv .xls5. Output prices: detailed commentary
Factory gate prices rose 0.8% in the year to August 2016, compared with a rise of 0.3% in the year to July 2016. This is the second annual increase since June 2014. The main contribution to the increase in the annual rate for August 2016 came from other manufactured products. An increase in the price of transport equipment also contributed towards the rise in the output price of manufactured products. These increases were offset by decreases in the prices of food products, and petroleum (Figure B).
Other manufactured products rose 2.9% in the year to August 2016, compared with a rise of 2.5% in the year to July 2016. The majority of other manufactured products showed increases, however, the main contributions to this rise came from soft drinks, mineral water and other bottled waters, and other manufactured goods, with prices rising by 12.1% and 2.7% respectively in the year.
Transport equipment prices rose 3.0% in the year to August 2016, compared with a rise of 2.8% in the year to July 2016. This index has now seen increases on the year since January 2016.
The increases were offset slightly by food products, which decreased 1.9% in the year to August 2016, compared with a fall of 2.6% in the year to July 2016. Decreases in other food products, dairy products and preserved meat and meat products were the largest contributors.
Most petroleum products showed decreases, however, the main contributions to the latest fall in the annual rate came from motor spirit and lubricating oils and gases.
The monthly price index saw a rise of 0.1% between July and August 2016, compared with a rise of 0.3% last month. Most product groups showed small monthly movements. Tobacco and alcohol, and food products provided the largest upward contributions, and petroleum provided the largest downward contribution to the monthly rate (Figure C).
Tobacco and alcohol prices increased 0.4% between July and August 2016 compared with no change between June and July 2016. The main contribution to the increase came from tobacco products.
Between July and August 2016, food product prices rose by 0.2%, compared with no change between June and July 2016. Increases in the price of preserved meat and meat products was the main contributor towards this upwards movement.
Petroleum prices fell by 1.9% between July and August 2016 compared with a rise of 0.2% between June and July 2016. This is the first fall seen in the monthly index since January 2016. The main contribution to this fall came from diesel and gas oil.
Core factory gate inflation
Core factory gate prices, which exclude the more volatile food, beverage, tobacco and petroleum product prices, giving a measure of the underlying factory gate inflation, rose 1.3% in the year to August 2016, compared with a rise of 1.0% in the year to July 2016. The largest contributors to this rise were other manufactured products, transport equipment, and metals, machinery and equipment.
The index showed a rise of 0.2% between July and August 2016.
Output producer price index contribution to change in rate
The annual percentage rate for the output PPI in August 2016 rose 0.8%, compared with a rise of 0.3% last month resulting in an increase in the annual rate of 0.5 percentage points. Petroleum products was the main contributor to the change in the 12 month rate.
Figure D: Output PPI 12 month contribution to change in annual rate between July and August 2016
UK
Source: Office for National Statistics
Notes:
- The components may not sum exactly to the overall change in the rate due to rounding.
Download this chart Figure D: Output PPI 12 month contribution to change in annual rate between July and August 2016
Image .csv .xls6. Output PPI range of movements
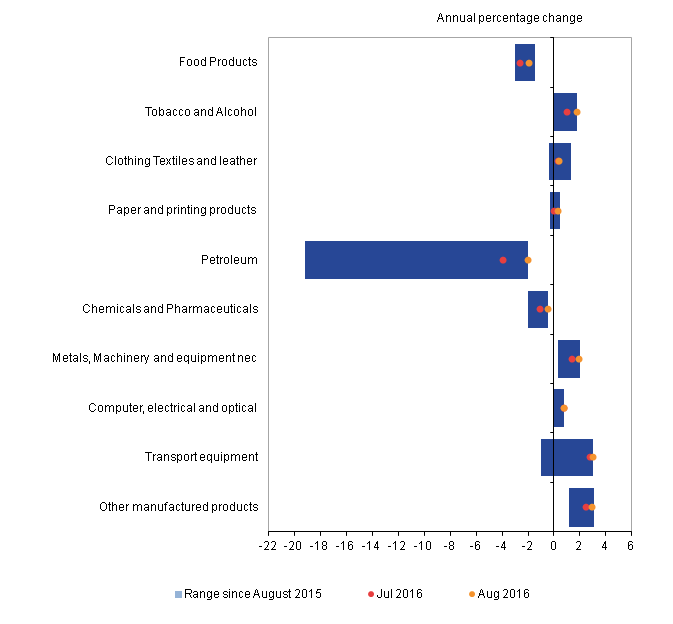
Figure E shows the year-on-year growth in output PPI by grouping for the latest 2 months and the range of the price changes that have been seen in these sections since August 2015. It can be seen that the majority of output PPI indices have experienced little variance in inflation in the past 12 months. Petroleum shows the biggest decrease, as well as the biggest range of movements; ranging from a fall of 19.2% in September 2015 to a fall of 2.0% in August 2016. Transport equipment shows the biggest increase, ranging from a fall of 1.0% in August 2015 to a rise of 3.0% in August 2016.
Figure E: Output PPI range of movements
UK, August 2015 to August 2016
Source: Office for National Statistics
Notes:
- nec = not elsewhere classified
Download this image Figure E: Output PPI range of movements
.png (23.9 kB) .xls (28.7 kB)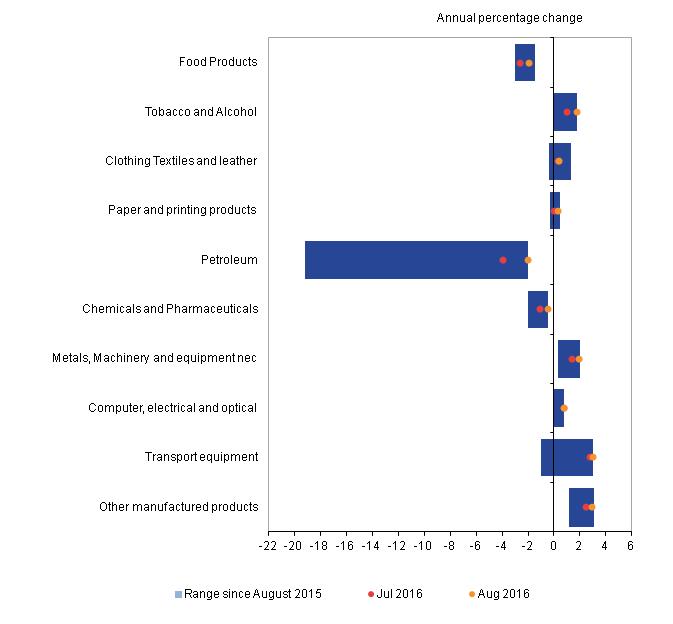
7. Input prices: summary
Figure F shows the annual movements in total input prices (including materials and fuels) and core input prices (excluding purchases from food, beverage, tobacco and petroleum industries) of materials and fuels purchased by the UK manufacturing industry. Between August 2012 and June 2014, both series showed relatively similar movements. From November 2013, both series have been showing a downward trend, with total input prices falling more rapidly. There has been a significant gap in the price movements of total input prices and core input prices since July 2014, however, this gap has closed in recent months. Both series have shown increases in the year to August 2016. Currently there is a difference of 1.4 percentage points, compared with a maximum of 10.9 percentage points in January 2015.
Looking at the latest data (Table D), the main movements in the year to August 2016 were as follows:
the total input price index rose 7.6%, compared with a rise of 4.1% in the year to July 2016
the core input price index saw a rise of 6.2%, compared with a rise of 5.0% in the year to July 2016
The price of imported materials as a whole (including crude oil) rose 9.3%, compared with an increase of 6.2% in the year to July 2016; this is the third rise seen in this index since September 2013.
Between July and August 2016:
the total input price index rose 0.2%, compared with a rise of 3.1% last month (Table D)
the seasonally adjusted input price index for the manufacturing industry excluding the food, beverage, tobacco and petroleum industries (Table D) showed no change, compared with a rise of 4.3% last month
Table D: Input prices UK, March 2016 to August 2016
| Percentage change | ||||||
| Materials and fuels purchased | Excluding purchases from food, beverage, tobacco and petroleum industries | |||||
| 1 month | 12 months | 1 month | 12 months | 1 month | ||
| (NSA)1 | (NSA)1 | (NSA)1 | (NSA)1 | (SA)2 | ||
| 2016 | Mar | 1.7 | -6.6 | 0.5 | -2.8 | 0.3 |
| Apr | 0.8 | -7.1 | 0.3 | -2.2 | 0.7 | |
| May | 2.3 | -4.3 | -0.4 | -1.9 | 0.0 | |
| Jun | 1.7 | -0.5 | 0.7 | -0.3 | 1.0 | |
| Jul | 3.1 | 4.1 | 4.2 | 5.0 | 4.3 | |
| Aug | 0.2 | 7.6 | 0.2 | 6.2 | 0.0 | |
| Source: Office for National Statistics | ||||||
| 1. NSA: Not Seasonally Adjusted | ||||||
| 2. SA: Seasonally Adjusted | ||||||
Download this table Table D: Input prices UK, March 2016 to August 2016
.xls (25.6 kB)
Figure F: Input prices (materials and fuel) manufacturing industry
UK, August 2012 to August 2016
Source: Office for National Statistics
Download this chart Figure F: Input prices (materials and fuel) manufacturing industry
Image .csv .xlsNotes for Input prices: summary
These indices include the Climate Change Levy which was introduced in April 2001.
These indices include the Aggregates Levy which was introduced in April 2002.
8. Supplementary analysis: input prices
Table E and Figure G show the percentage change in the price of the main commodities groups over the year and their contributions to the total input index.
Table E: Input prices, 12 months change, UK, August 2016
| Product group | Percentage change |
| Fuel including Climate Change Levy | -4.8 |
| Crude oil | 11.4 |
| Home food materials | 9.1 |
| Imported food materials | 12.7 |
| Other home-produced materials | -0.1 |
| Imported metals | 18.9 |
| Imported chemicals | 4.7 |
| Imported parts and equipment | 7.7 |
| Other imported materials | 10.9 |
| All manufacturing | 7.6 |
| Source: Office for National Statistics |
Download this table Table E: Input prices, 12 months change, UK, August 2016
.xls (26.6 kB)
Figure G: Input prices, contribution to 12 months’ growth rate
UK, August 2016
Source: Office for National Statistics
Download this chart Figure G: Input prices, contribution to 12 months’ growth rate
Image .csv .xlsTable F and Figure H show the percentage change in the price of the main commodities groups over the month and their contributions to the total input index.
Table F: Input prices, 1 month change, UK, August 2016
| Product group | Percentage change |
| Fuel including Climate Change Levy | -1.3 |
| Crude oil | 0.7 |
| Home food materials | 0.6 |
| Imported food materials | -0.5 |
| Other home-produced materials | -0.3 |
| Imported metals | 2.3 |
| Imported chemicals | 0.4 |
| Imported parts and equipment | -0.1 |
| Other imported materials | 0.9 |
| All manufacturing | 0.2 |
| Source: Office for National Statistics |
Download this table Table F: Input prices, 1 month change, UK, August 2016
.xls (26.1 kB)
Figure H: Input prices, contribution to 1 month growth rate
UK, August 2016
Source: Office for National Statistics
Download this chart Figure H: Input prices, contribution to 1 month growth rate
Image .csv .xls9. Input prices: detailed commentary
The overall input index for all manufacturing, which measures changes in the price of materials and fuels purchased by manufacturers, rose 7.6% in the year to August 2016, compared with a rise of 4.1% in the year to July 2016. The main upwards contributions to the index came from crude oil, other imported parts and equipment and imported metals.
The monthly input index rose 0.2% between July and August 2016, compared with an increase of 3.1% between June and July 2016. (see Table F and Figure H).
Crude oil rose 11.4% in the year to August 2016 compared with a fall of 6.3% in the year to July 2016. This is the first time the annual rate for crude oil has been positive since September 2013. Imported crude petroleum and natural gas provided the main contribution to this rise with an increase of 8.3% compared with a fall of 6.0% in the year to July 2016.
Imported parts and equipment prices rose 7.7% in the year to August 2016, compared with a rise of 8.9% in the year to July 2016. The main contribution came from imported products used in the manufacture of machinery and equipment, which rose 14.0%, compared with a rise of 13.4% in the year to July 2016.
Imported metals rose 18.9% in the year to August 2016 compared with a rise of 12.7% in the year to July 2016. The main contribution to the rise came from imported products used in the manufacturing of other basic metals and casting which rose 20.8% compared with 13.7% in the year to July 2016.
Core input price index (excluding purchases from the food, beverage, tobacco and petroleum industries)
The seasonally adjusted core input price index rose 6.2% in the year to August 2016, compared with a rise of 4.7% in the year to July 2016. Between July and August 2016, the index remained the same, compared with a rise of 4.3% between June and July 2016.
The unadjusted core input price index rose 6.2% in the year to August 2016, compared with a rise of 5.0% in the year to July 2016. This is the second rise seen in this index since September 2013. The monthly index increased 0.2% between July and August 2016, compared with an increase of 4.2% between June and July 2016.
Input producer price index contribution to change in rate
The annual percentage rate for the input PPI in August 2016 rose 7.6% compared with a rise of 4.1% last month, resulting in an increase in the annual rate of 3.5 percentage points. The main upward contribution came from crude oil with smaller contributions from imported metals and fuel (Figure I).
Figure I: Input PPI 12 month contribution to change in annual rate between July and August 2016
UK
Source: Office for National Statistics
Notes:
- The components may not sum exactly to the overall change in the rate due to rounding.
Download this chart Figure I: Input PPI 12 month contribution to change in annual rate between July and August 2016
Image .csv .xls10. Input PPI indices range of movements
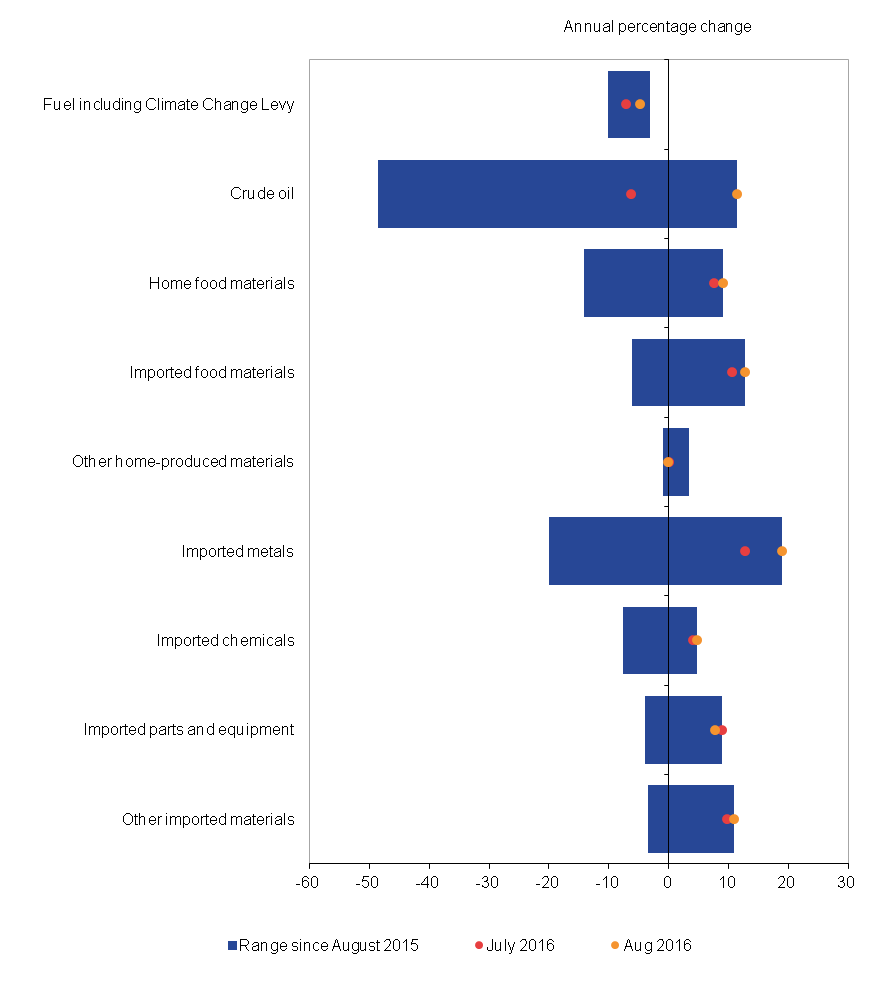
Figure J shows the year-on-year growth in input PPI by grouping for the latest 2 months and the range of the price changes that have been seen in these groupings since August 2015. Crude oil shows the biggest decrease in the 12-month period and also the largest range of movements, from a fall of 48.6% in August 2015 to a rise of 11.4% in August 2016. This is the first increase for crude oil since September 2013.
Imported metals shows the biggest increase, ranging from a fall of 20.0% in December 2015 to a rise of 18.9% in August 2016.
Figure J: Input PPI range of movements
UK, August 2015 to August 2016
Source: Office for National Statistics
Download this image Figure J: Input PPI range of movements
.png (42.0 kB)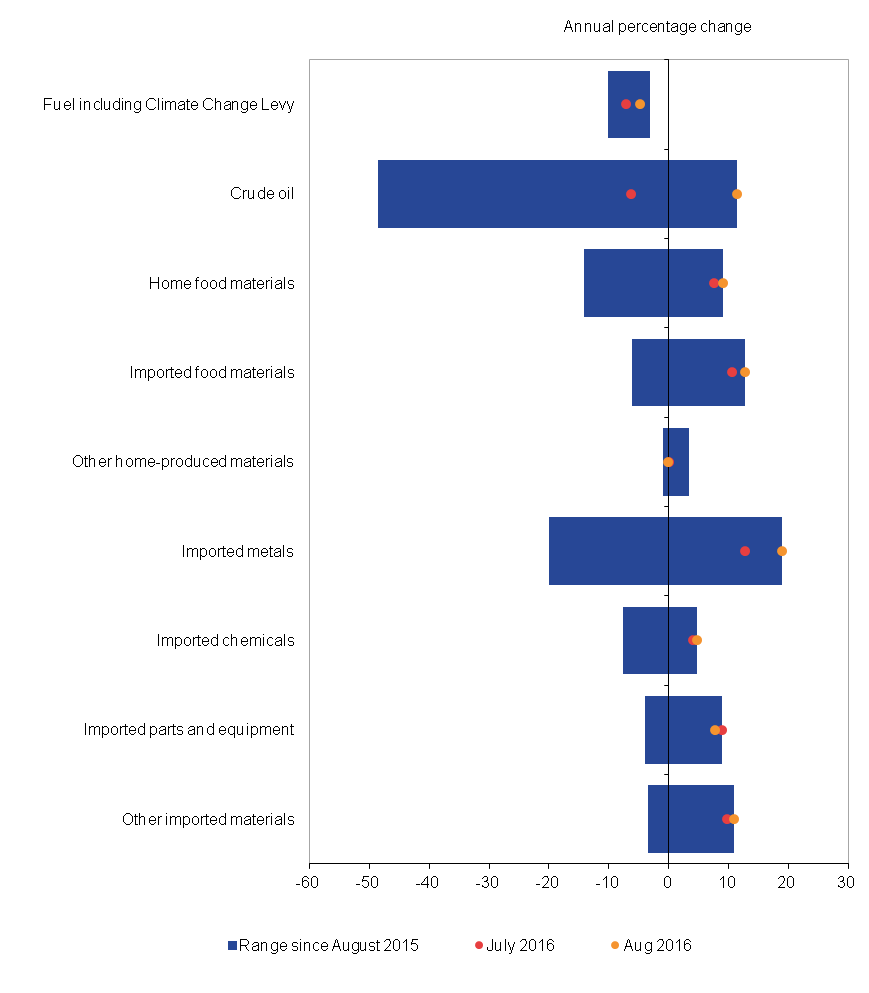
11. Economic context
Input producer prices increased by 7.6% in the year to August 2016, compared with a 4.1% increase in the year to July 2016, the second consecutive month of positive input price inflation. Output producer prices also increased in the year to August 2016 (0.8%) which would suggest higher input costs are feeding into the output prices of manufacturing goods.
Figure K: ONS producer price index for input prices
UK, August 2014 to August 2016
Source: Office for National Statistics
Download this chart Figure K: ONS producer price index for input prices
Image .csv .xlsFigure K shows the 12-month percentage change and percentage point contributions of the components to input PPI inflation for the past 2 years. Over the last year, input PPI deflation was mainly driven by low crude oil prices, which was partly attributed to the supply of crude oil outstripping demand in developed and developing markets. However, in recent months, the impact of crude oil prices has waned as the initial sharp falls in crude oil prices have started to unwind out of the annual comparison. Month-on-month, crude oil prices increased by 0.7% in August 2016, compared with a 1.0% increase in the previous month, which could be partly explained by the depreciation of the sterling exchange rate following the EU referendum.
Alongside recent changes in crude oil prices, changes in the exchange rate may also have an impact on other imported goods. Imported parts and equipment (7.7%), other imported materials (10.9%) and imported food (12.7%) have also seen a sharp increase in prices in the year to August 2016.
Figure L: ONS producer price index for output prices
UK, August 2014 to August 2016
Source: Office for National Statistics
Download this chart Figure L: ONS producer price index for output prices
Image .csv .xlsFigure L shows the 12-month percentage change and percentage point contributions of the components to output PPI inflation for the past 2 years. In this period, there has been a continued downward pressure from food products, refined petroleum products (including duty), and chemicals and pharmaceuticals. However, the increase in crude oil prices has yet to feed into refined petroleum products (including duty). On a monthly basis, crude oil (input) prices increased by 0.7% in August 2016, while refined fuel and petroleum (output) product prices fell by 1.9%.
While commodity prices and the exchange rate are likely to have an effect on producer prices, the strengthening of the UK labour market may also have produced upward pressure on output prices of manufactures. The unemployment rate amongst those aged 16 and over remained stable at 4.9% in the 3 months to June 2016, while the employment rate amongst those aged 16 to 64 rose slightly to 74.5% during the same period – which is the highest employment rate since records began. Unit labour costs in the manufacturing sector – which measures the labour cost per unit of output produced – increased by 1.0% in Quarter 1 (January to March) 2016 compared with a 0.6% increase in the previous quarter (October to December) 2015.
Output across the economy increased by 0.6% in Quarter 2 (April to June) 2016, compared with a 0.4% increase for the previous quarter (January to March). Output in the manufacturing sector also grew by 0.8% in the year to July 2016 compared with a 0.6% increase in the previous month. The growth in the manufacturing sector may have made it easier for firms to pass on higher costs, raising manufacturers’ margins.
Nôl i'r tabl cynnwys12. Revisions
For this bulletin, Producer price index dataset Tables 8R and 9R highlight revisions to movements in price indices previously published in last month’s statistical bulletin. These are mainly caused by changes to the most recent estimates as more price quotes are received, and revisions to seasonal adjustment factors, which are re-estimated every month.
For more information about our revisions policy, see our website.
Table G: Revisions between first publication and estimates 12 months later
| Percentages | |||
| Value in latest period | Revisions between first publication and estimates 12 months later | ||
| Average over the last 5 years | Average over the last 5 years without regard to sign (average absolute revision) | ||
| Total output (JVZ7) - 12 months | 0.8 | -0.08 | 0.14 |
| Total output (JVZ7) - 1 month | 0.1 | -0.01 | 0.07 |
| Total input (K646) - 12 months | 7.6 | 0.03 | 0.35 |
| Total input (K646) - 1 month | 0.2 | 0.03 | 0.28 |
| Source: Office for National Statistics | |||
| 1. *Statistically significant | |||
Download this table Table G: Revisions between first publication and estimates 12 months later
.xls (25.1 kB)Revisions to data provide one indication of the reliability of main indicators. Table G shows summary information on the size and direction of the revisions which have been made to the data covering a 5-year period. A statistical test has been applied to the average revision to find out if it is statistically significantly different from zero. The inclusion of an asterisk (*) would show the test is significant.
Table G presents a summary of the differences between the first estimates published between 2011 and 2015 and the estimates published 12 months later. These numbers include the effect of the reclassification onto Standard Industrial Classification (SIC) 2007.
Spreadsheets giving revisions triangles of estimates for all months from February 1998 through to December 2015 and the calculations behind the averages in the table are available in the producer price inflation datasets.
Revision triangle for total output (12 months)
Revision triangle for total output (1 month)
Revision triangle for total input (12 months)
Revision triangle for total input (1 month)
Nôl i'r tabl cynnwys13. Changes to publication schedule for economic statistics
From January 2017 we are improving the way we publish economic statistics, with related data grouped together under new "theme" days. This will increase the coherence of our data releases and involve minor changes to the timing of certain publications. For more information see Changes to publication schedule for economic statistics.
Nôl i'r tabl cynnwys14. Quality and methodology
The PPI Quality and Methodology Information document contains important information on:
the strengths and limitations of the data and how it compares with related data
users and uses of the data
how the output was created
the quality of the output including the accuracy of the data