1. Main findings
Private rental prices paid by tenants in Great Britain rose by 2.3% in the 12 months to September 2016; this is unchanged compared with the year to August 2016.
Private rental prices grew by 2.5% in England, fell by 0.1% in Scotland and grew by 0.1% in Wales in the 12 months to September 2016.
Rental prices increased in all the English regions over the year to September 2016, with rental prices increasing the most in the South East (3.5%).
Nôl i'r tabl cynnwys2. Changes to publication schedule
From January 2017 we are improving the way we publish economic statistics, with related data grouped together under new "theme" days. This will increase the coherence of our data releases and involve minor changes to the timing of certain publications. The impact of this on IPHRP is to bring the release forward to the second or third Tuesday of each month. For more information see Changes to publication schedule for economic statistics.
Nôl i'r tabl cynnwys3. About this statistical bulletin
The Index of Private Housing Rental Prices (IPHRP) measures the change in price of renting residential property from private landlords. The index is published as a series of price indices covering Great Britain, its constituent countries and the English regions.
IPHRP measures the change in price tenants face when renting residential property from private landlords, thereby allowing a comparison between the prices tenants are charged in the current month as opposed to the same month in the previous year. The index does not measure the change in newly advertised rental prices only, but reflects price changes for all private rental properties.
IPHRP is released as an Experimental Statistic. This is a new official statistic undergoing evaluation and therefore it is recommended that caution is exercised when drawing conclusions from the published data, as the index is likely to be further developed. Once the methodology is tested and assessed, and the publication meets user needs, the IPHRP will be assessed against the Code of Practice for Official Statistics to achieve National Statistic status. A description of the methodology and the sources used is included in the article Index of Private Housing Rental Prices, Historical Series. Further details regarding improvements to the IPHRP price collection methodology can be found in the January 2015 article.
The IPHRP is constructed using administrative data. That is, the index makes use of data that are already collected for other purposes in order to estimate rental prices. The sources of private rental prices are Valuation Office Agency (VOA), Scottish government (SG) and Welsh government (WG). All 3 organisations deploy rental officers to collect the price paid for privately rented properties. The sources of expenditure weights are Department for Communities and Local Government (DCLG), Scottish government, Welsh government and VOA.
DCLG produces estimates of the private rental dwelling stock for England and its regions. Scottish government and Welsh government produce estimates of private rental dwelling stock for Scotland and Wales.
Great Britain rental prices
The Great Britain private rental price series starts in January 2011. This is the date for which all the sources for constituting countries are available on a consistent basis. This index has seen small and gradual increases since January 2011 (Figure 1).
Figure 1: IPHRP indices, Great Britain, January 2011 to September 2016
Source: Office for National Statistics
Notes:
- Not seasonally adjusted.
Download this chart Figure 1: IPHRP indices, Great Britain, January 2011 to September 2016
Image .csv .xlsBetween September 2015 and September 2016, Great Britain private rental prices grew by 2.3%. For example, a property that was rented for £500 a month in September 2015, which saw its rent increase by the Great Britain average rate, would be rented for £511.50 in September 2016. Rental prices for Great Britain excluding London grew by 2.1% in the same period (Figure 2).
Figure 2: IPHRP percentage change over 12 months, Great Britain, January 2012 to September 2016
12-month percentage change
Source: Office for National Statistics
Notes:
- Not seasonally adjusted.
Download this chart Figure 2: IPHRP percentage change over 12 months, Great Britain, January 2012 to September 2016
Image .csv .xls4. Rental prices for constituent countries of Great Britain
All the countries that constitute Great Britain have experienced rises in their private rental prices since 2011 (Figure 3). Since January 2011, England rental prices have increased more than those of Wales and Scotland.
Figure 3: IPHRP indices for Great Britain and its constituent countries, January 2011 to September 2016
Source: Office for National Statistics
Notes:
- Not seasonally adjusted.
Download this chart Figure 3: IPHRP indices for Great Britain and its constituent countries, January 2011 to September 2016
Image .csv .xlsThe annual rate of change in the IPHRP for Wales (0.1%) continues to be well below that of England and the Great Britain average (Figure 4). Rental growth in Scotland fell by 0.1% in the 12 months to September 2016 from a high of 2.1% in the year to June 2015.
Figure 4: IPHRP percentage change over 12 months for Great Britain and its constituent countries, January 2012 to September 2016
12-month percentage change
Source: Office for National Statistics
Notes:
- Not seasonally adjusted.
Download this chart Figure 4: IPHRP percentage change over 12 months for Great Britain and its constituent countries, January 2012 to September 2016
Image .csv .xlsBetween September 2015 and September 2016, rental prices grew by 2.5% in England, fell by 0.1% in Scotland and grew by 0.1% in Wales (Figure 5).
Figure 5: IPHRP percentage change over the 12 months to September 2016, Great Britain and its constituent countries
12-month percentage change
Source: Office for National Statistics
Notes:
- Not seasonally adjusted.
Download this chart Figure 5: IPHRP percentage change over the 12 months to September 2016, Great Britain and its constituent countries
Image .csv .xls5. Rental prices in England and its regions
The IPHRP series for England starts in 2005. Private rental prices in England show 3 distinct periods: rental price increases from January 2005 until February 2009, rental price decreases from July 2009 to February 2010 and increasing rental prices from June 2010 onwards (Figure 6). When London is excluded, England shows a similar pattern but with slower rental price increases from around the end of 2010.
Figure 6: IPHRP indices, England, January 2005 to September 2016
Source: Office for National Statistics
Notes:
- Not seasonally adjusted.
Download this chart Figure 6: IPHRP indices, England, January 2005 to September 2016
Image .csv .xlsFigure 7 shows the historical 12 month percentage growth rate in the rental prices of each of the English regions.
Figure 7: IPHRP percentage change over 12 months by English region, January 2006 to September 2016
12-month percentage change

Source: Office for National Statistics
Notes:
- Not seasonally adjusted.
- The dotted grey line shows the average England 12 month percentage change.
Download this image Figure 7: IPHRP percentage change over 12 months by English region, January 2006 to September 2016
.PNG (39.6 kB) .xls (57.9 kB)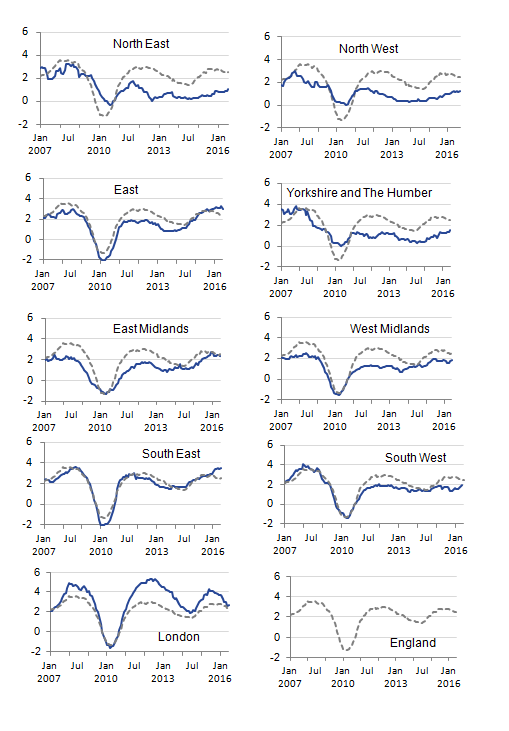
Since the beginning of 2012, English rental prices have shown annual increases ranging between 1.4% and 3.0% year-on-year, with September 2016 rental prices being 2.5% higher than September 2015 rental prices (Figure 8). Excluding London, England showed an increase of 2.4% for the same period.
Figure 8: IPHRP percentage change over 12 months for England, January 2006 to September 2016
12-month percentage change
Source: Office for National Statistics
Notes:
- Not seasonally adjusted.
Download this chart Figure 8: IPHRP percentage change over 12 months for England, January 2006 to September 2016
Image .csv .xlsIn the 12 months to September 2016, private rental prices increased in all the English regions (Figure 9). The largest annual rental price increases were in the South East (3.5%), up from 3.4% in August 2016, followed by the East of England (3.0%), down from 3.3% in August 2016 and London (2.7%), up from 2.6% in August 2016. Annual rental growth in the South East and East of England has surpassed that of London since May and June 2016 respectively.
The lowest annual rental price increases were in the North East (1.0%), up from 0.9% in August 2016, the North West (1.3%), up from 1.1% in August 2016 and Yorkshire and The Humber (1.5%), up from 1.3% in August 2016.
Figure 9: IPHRP percentage change over the 12 months to September 2016 by English region
12-month percentage change
Source: Office for National Statistics
Notes:
- Not seasonally adjusted.
Download this chart Figure 9: IPHRP percentage change over the 12 months to September 2016 by English region
Image .csv .xls6. Economic context
The rental market in Great Britain continued to show signs of strength in the year to September 2016, as prices grew by 2.3%, unchanged from the previous month and slightly above the average inflation rate experienced between 2012 and 2015 inclusive.
Although the headline rate was stable, there were movements in rental inflation rates across regions – for example, London rental inflation rose to 2.7% following 7 successive periods of either falling or stable inflation. By contrast, rental inflation in the South West has increased for 4 consecutive months, rising from 1.5% in May to 2.2% in September. Rental price inflation was strongest in the South East (3.5%) and the East of England (3.0%) and was weakest in Scotland (negative 0.1%) and Wales (0.1%).
Looking at data from the UK House Price Index over a longer period shows residential house price growth in Great Britain has typically been stronger than rental price growth, with an average 12-month rate of house price inflation between January 2014 and August 2016 of 7.3%, compared with 2.1% for rental prices.
Continued inflation in the rental market is likely to have been caused by demand in the market outpacing supply. The Royal Institute of Chartered Surveyors (RICS) Residential Market Survey reported strong growth in non-seasonally adjusted tenant demand in September, while the Association of Residential Letting Agents (ARLA) reported a rise in prospective tenants.
In terms of rental market supply (as measured by landlord instructions to sell), both RICS and ARLA reported only marginal movements in the number of properties available to tenants.
Nôl i'r tabl cynnwys7. Improvements to IPHRP
From January 2017 we are improving the way we publish economic statistics, with related data grouped together under new "theme" days. This will increase the coherence of our data releases and involve minor changes to the timing of certain publications. For more information see Changes to publication schedule for economic statistics. The impact of this on IPHRP is to bring the release forward to the second or third Tuesday of each month.
IPHRP is classified as an Experimental Statistic to allow for evaluation of the output against user needs. As part of the ongoing development, we are considering how to improve IPHRP ahead of potential assessment as a National Statistic.
In September 2015 we published an evaluation of our rental price indices against the growth in average private rental prices published by VOA, please see the article “Explaining private rental growth”. We have updated the series previously presented which is published alongside this release.
In addition to government sources, a number of private companies such as Countrywide, Homelet and LSL Property Services produce statistics on the private rental market. These are predominantly flow measures of private rents, whereas IPHRP is a stock measure. A comparison of these against IPHRP can be found within Tables 3 and 4 of the IPHRP dataset.
For further details, please contact hpi@ons.gov.uk
Nôl i'r tabl cynnwys8. How are we doing?
We welcome your views on the data presented in this statistical bulletin. Please contact the Housing Market Indices team using the email address below to discuss any aspect of the data, including your views on how we can improve the data.
For further details, please contact hpi@ons.gov.uk
Nôl i'r tabl cynnwys9. Data tables
The IPHRP dataset provides full historical series for the tables accompanying the IPHRP statistical bulletin. This month, the tables have been updated with the latest monthly estimates for September 2016.
The IPHRP weights summary provides aggregated weights for indicative purposes only. The IPHRP weights are updated annually in February of each year.
Nôl i'r tabl cynnwys10. Quality and methodology
Details of the methodology used to calculate the IPHRP can be found in the July 2013 IPHRP article but this article requires some updating. This article can also be supplemented by the January 2015 article which presents some recent methodological changes for IPHRP.
The IPHRP Quality and Methodology Information document contains important information on:
- the strengths and limitations of the data
- the quality of the output: including the accuracy of the data and how it compares with related data
- uses and users
- how the output was created