Cynnwys
- Main points
- Things you need to know about this release
- Private rental prices see steady growth in Great Britain
- England, Wales and Scotland see growth in private rental prices
- Growth in private rental prices in London continues to slow
- Links to related statistics
- What’s changed in this release?
- Quality and methodology
1. Main points
Private rental prices paid by tenants in Great Britain rose by 1.8% in the 12 months to June 2017; this is unchanged for the third consecutive month.
In England, private rental prices grew by 1.9%, Wales saw growth of 1.1% while Scotland saw rental prices increase by 0.2% in the 12 months to June 2017.
London private rental prices grew by 1.3% in the 12 months to June 2017, 0.5 percentage points below the Great Britain 12-month growth rate.
2. Things you need to know about this release
On 15 June 2017, the National Statistician announced that pre-release access to Office for National Statistics publications would stop with effect from 1 July 2017. This is therefore the first Index of Private Housing Rental Prices (IPHRP) release where ministers and other officials did not receive access to the information prior to publication.
IPHRP measures the change in price of renting residential property from private landlords. The index is published as a series of price indices covering Great Britain, its constituent countries and the English regions. All data presented are non-seasonally adjusted.
IPHRP measures the change in price tenants face when renting residential property from private landlords, thereby allowing a comparison between the prices tenants are charged in the current month as opposed to the same month in the previous year. The index does not measure the change in newly advertised rental prices only, but reflects price changes for all private rental properties.
The IPHRP is constructed using administrative data. That is, the index makes use of data that are already collected for other purposes in order to estimate rental prices. The sources of private rental prices are Valuation Office Agency (VOA), Scottish Government (SG) and Welsh Government (WG). All three organisations deploy rental officers to collect the price paid for privately rented properties. The sources of expenditure weights are the Department for Communities and Local Government (DCLG), Scottish Government, Welsh Government and the VOA.
IPHRP is released as an Experimental Statistic. While the methodology for IPHRP is final, Northern Ireland is currently excluded from the price index. We are working with Northern Ireland Housing Executive to secure private rental data for Northern Ireland. Once the coverage of IPHRP has been improved to that of the UK, the IPHRP will be assessed against the Code of Practice for Official Statistics to achieve National Statistics status.
Nôl i'r tabl cynnwys3. Private rental prices see steady growth in Great Britain
Between January 2011 and June 2017, private rental prices in Great Britain increased by 14.8%, strongly driven by the historical growth in private rental prices within London. When London is excluded, private rental prices increased by 10.8% over the same period.
Figure 1: Index of Private Housing Rental Prices indices, Great Britain
January 2011 to June 2017
Source: Office for National Statistics
Download this chart Figure 1: Index of Private Housing Rental Prices indices, Great Britain
Image .csv .xlsGrowth in private rental prices paid by tenants in Great Britain has seen signs of a slowdown since the end of 2015, increasing by 1.8% in the 12 months to June 2017. For example, a property that was rented for £500 per month in June 2016, which saw its rent increase by the average rate in Great Britain, would be rented for £509 in June 2017. This slowdown in the growth in private rental prices in Great Britain is mainly driven by a slowdown in London over the same period.
The 12-month growth rate of private rental prices paid by tenants in Great Britain was unchanged in June 2017 compared with May 2017, at 1.8%. Rental prices for Great Britain excluding London increased by 2.0% in the 12 months to June 2017, unchanged from May 2017 (Figure 2). The growth rate for London (1.3%) in the 12 months to June 2017 is 0.5 percentage points below that of Great Britain.
The Royal Institute of Chartered Surveyors (RICS) May 2017 Residential Market Survey reported that tenant demand rose only marginally (on a non-seasonally adjusted basis), with the pace of increase the most moderate since December 2016. The Association of Residential Letting Agents (ARLA) reported in their Private Rented Sector Report for May 2017 that the supply of rental stock had risen by 11% over the last 12 months.
Figure 2: Index of Private Housing Rental Prices percentage change over 12 months, Great Britain
January 2012 to June 2017
Source: Office for National Statistics
Download this chart Figure 2: Index of Private Housing Rental Prices percentage change over 12 months, Great Britain
Image .csv .xls4. England, Wales and Scotland see growth in private rental prices
All the countries that constitute Great Britain have experienced rises in their private rental prices since 2011 (Figure 3). Since January 2011, rental prices in England have increased more than those in Wales and Scotland.
Figure 3: Index of Private Housing Rental Prices indices for Great Britain and its constituent countries
January 2011 to June 2017
Source: Office for National Statistics
Download this chart Figure 3: Index of Private Housing Rental Prices indices for Great Britain and its constituent countries
Image .csv .xlsThe annual rate of change for Wales (1.1%) in June 2017 continues to be below that of England (1.9%) and Great Britain (1.8%). However, this is the first time the annual rate of change for Wales has been above 1.0% since February 2012. Wales has shown a broad increase in its annual growth rate since July 2016.
Rental growth in Scotland increased by 0.2% in the 12 months to June 2017 and has remained around zero since August 2016. This weaker growth may be due to stronger supply and weaker demand in Scotland as reported by the Association of Residential Letting Agents (ARLA).
Figure 4: Index of Private Housing Rental Prices percentage change over 12 months for Great Britain and its constituent countries
January 2012 to June 2017
Source: Office for National Statistics
Download this chart Figure 4: Index of Private Housing Rental Prices percentage change over 12 months for Great Britain and its constituent countries
Image .csv .xls5. Growth in private rental prices in London continues to slow
Growth in private rental prices in London was 1.3% in the 12 months to June 2017, unchanged from May 2017. The Royal Institute of Chartered Surveyors (RICS) report in their May 2017 Residential Market Survey that near term expectations are still negative in the capital, an ongoing trend stretching back to August 2016. The report notes that London rental projections are broadly flat and have not shown any improvements in recent months.
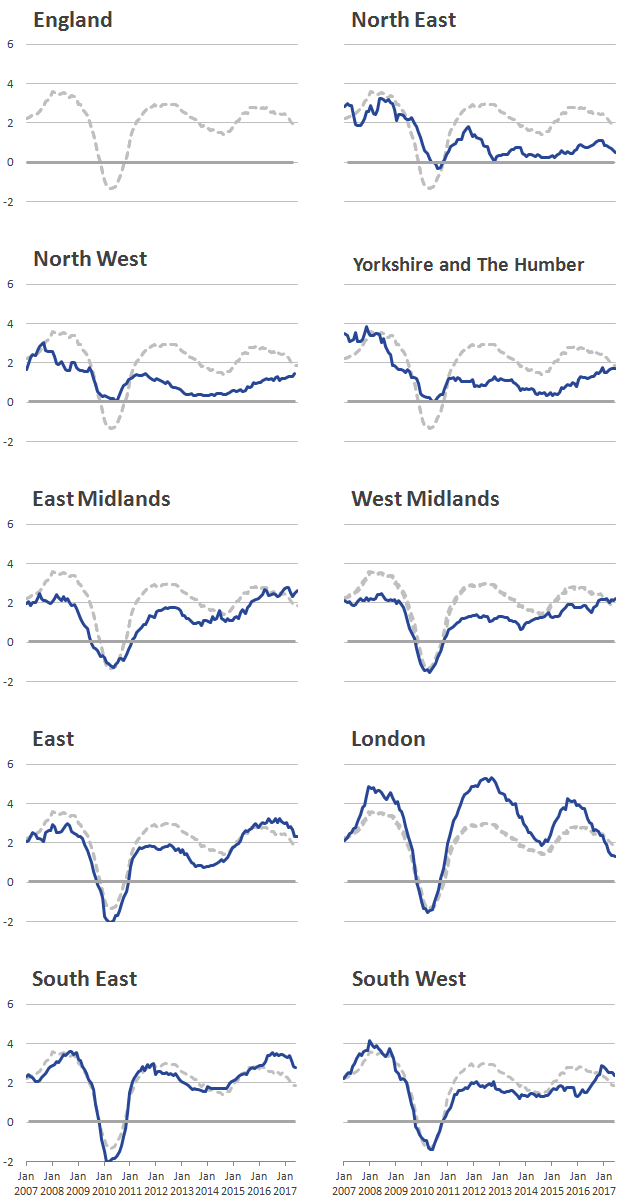
The largest annual rental price increases were in the South East (2.8%), unchanged from May 2017 (Figure 5). This was followed by the East Midlands (2.6%), up from 2.5% in May 2017, the South West (2.4%), down from 2.5% in May 2017 and the East of England (2.3%), unchanged from May 2017.
The lowest annual rental price increases were in the North East (0.5%), down from 0.6% in May 2017, London (1.3%), unchanged from May 2017, the North West (1.5%), up from 1.3% in May 2017 and Yorkshire and The Humber (1.7%), unchanged from May 2017.
Figure 5: Index of Private Housing Rental Prices percentage change over the 12 months to June 2017, by English region
Source: Office for National Statistics
Download this chart Figure 5: Index of Private Housing Rental Prices percentage change over the 12 months to June 2017, by English region
Image .csv .xlsFigure 6 shows the historical 12-month percentage growth rate in the rental prices of each of the English regions.
Figure 5: Index of Private Housing Rental Prices percentage change over 12 months by English region, January 2007 to June 2017
Source: Office for National Statistics
Notes:
- The dotted grey line shows the average England 12-month percentage change.
Download this image Figure 5: Index of Private Housing Rental Prices percentage change over 12 months by English region, January 2007 to June 2017
.PNG (58.9 kB) .xls (60.4 kB)
7. What’s changed in this release?
The Index of Private Housing Rental Prices (IPHRP) is now published on the second or third Tuesday of each month to bring it in line with other prices-related releases grouped under new “theme” days. This will increase the coherence of our data releases; for more information see Changes to publication schedule for economic statistics.
An update to the quarterly article Comparing measures of private rental growth in the UK was published alongside this release and compares growth in the IPHRP to other measures of private rental growth.
Nôl i'r tabl cynnwys8. Quality and methodology
Details of the methodology used to calculate the Index of Private Housing Rental Prices (IPHRP) can be found in the July 2013 IPHRP article but this article requires some updating. In March 2015, methodological improvements were implemented to improve the matching of properties over time; this ensures that we are comparing “like with like”. These methodological improvements were presented in the January 2015 article.
In September 2015, we published an evaluation of our rental price indices against the growth in average private rental prices published by Valuation Office Agency (VOA); please see the article Explaining private rental growth for more information. Comparisons of IPHRP against other private rent measures can be found in the article published alongside this release.
The IPHRP Quality and Methodology Information document contains important information on:
- the strengths and limitations of the data and how it compares with related data
- uses and users of the data
- how the output was created
- the quality of the output including the accuracy of the data