1. Main points
Private rental prices paid by tenants in the UK rose by 1.4% in the 12 months to February 2020, down from 1.5% in January 2020.
Private rental prices grew by 1.4% in England, 1.2% in Wales and 0.6% in Scotland in the 12 months to February 2020.
London private rental prices rose by 1.1% in the 12 months to February 2020.
The Office for National Statistics (ONS) has released a public statement on the coronavirus (COVID-19) and the production of statistics. Measuring the data describes the situation in relation to the Index of Private Housing Rental Prices (IPHRP).
2. UK private rental prices
Figure 1: The UK annual private rental growth has been on an upward trend since late 2018
Index of Private Housing Rental Prices percentage change over 12 months, UK and Great Britain, January 2012 to February 2020
Source: Office for National Statistics – Index of Private Housing Rental Prices
Notes:
- Data presented in this dataset are classified as Experimental Statistics and subject to revisions if improvements in the methodology are identified. Results should be interpreted with this in mind.
Download this chart Figure 1: The UK annual private rental growth has been on an upward trend since late 2018
Image .csv .xlsPrivate rental prices paid by tenants in the UK increased by 1.4% in the 12 months to February 2020, down from 1.5% in January 2020. For example, a property that was rented for £500 per month in January 2019 and had a rent increase of the average UK rate would be rented for £507.00 in February 2020.
Growth in private rental prices paid by tenants in the UK generally slowed since the beginning of 2016, caused mainly by a slowdown in London over the same period. Rental growth has started to pick up since the end of 2018, caused by strengthening growth in London.
In the 12 months to February 2020, rental prices for the UK excluding London increased by 1.5%, down from 1.6% in January 2020 (Figure 1). London private rental prices increased by 1.1% in the 12 months to February 2020.
The Royal Institution of Chartered Surveyors' (RICS's) February 2019 UK Residential Market Survey reported that tenant demand rose for a third consecutive month. Alongside this, landlord instructions fell once again.
The Association of Residential Letting Agents (ARLA) reported in their Private Rented Sector Report: January 2020 that demand from prospective tenants increased to the highest level on record, but supply of rental stock fell to the lowest seen in seven months.
These supply and demand pressures can take time to feed through to the Index of Private Housing Rental Prices (IPHRP), which reflects price changes for all private rental properties rather than only newly advertised rental properties.
Focusing on the long-term trend, between January 2015 and January 2020, private rental prices in the UK increased by 8.7% (Figure 2).
Figure 2: UK rental prices have increased by 8.7% since January 2015
Index of Private Housing Rental Prices indices, UK, January 2015 to February 2020
Source: Office for National Statistics – Index of Private Housing Rental Prices
Notes:
- Data presented in this dataset are classified as Experimental Statistics and subject to revisions if improvements in the methodology are identified. Results should be interpreted with this in mind.
Download this chart Figure 2: UK rental prices have increased by 8.7% since January 2015
Image .csv .xls3. UK private rental growth rates by country
In England, private rental prices grew by 1.4% in the 12 months to February 2020, down from 1.5% in January 2020. When London is excluded from England, privately rented properties increased by 1.6% in the 12 months to February 2020.
Private rental prices in Wales grew by 1.2% in the 12 months to February 2020, down from 1.3% in January 2020.
Rental growth in Scotland increased by 0.6% in the 12 months to February 2020, unchanged since December 2019. Scotland's rental growth has remained weaker than the rest of the UK's growth since August 2016.
The annual rate of change for Northern Ireland (1.6%) in February 2020 was higher than that of the other countries of the UK. The Northern Ireland annual growth rate has remained broadly consistent (around 2%) since 2018, with Quarter 4 (Oct to Dec) 2019 being the largest fall in the annual rental price growth since IPHRP began. Northern Ireland data have been copied forward since December 2019. The next update to Northern Ireland data will be in the June 2020 release.
Figure 3: The annual rental growth in Scotland has been lower than other countries of the UK since August 2016
Index of Private Housing Rental Prices percentage change over 12 months for countries of the UK, January 2012 to February 2020
Source: Office for National Statistics – Index of Private Housing Rental Prices
Notes:
- Data presented in this dataset are classified as Experimental Statistics and subject to revisions if improvements in the methodology are identified. Results should be interpreted with this in mind.
- Northern Ireland data are only available every three months. Northern Ireland data are copied forward until the next data are obtainable, which will be in the May 2020 bulletin released on 17 June 2020.
Download this chart Figure 3: The annual rental growth in Scotland has been lower than other countries of the UK since August 2016
Image .csv .xlsAll UK countries have experienced a rise in their private rental prices between January 2015 and February 2020 (Figure 4). Since January 2015, rental prices in England and Northern Ireland have increased more than those in Wales and Scotland.
Figure 4: Rental prices have increased more in England and Northern Ireland than in Wales and Scotland since 2015
Index of Private Housing Rental Prices indices for countries of the UK, January 2015 to February 2020
Source: Office for National Statistics – Index of Private Housing Rental Prices
Notes:
- Data presented in this dataset are classified as Experimental Statistics and subject to revisions if improvements in the methodology are identified. Results should be interpreted with this in mind.
- Northern Ireland data are only available every three months. Northern Ireland data are copied forward until the next data are obtainable, which will be in the May 2020 bulletin released on 17 June 2020.
Download this chart Figure 4: Rental prices have increased more in England and Northern Ireland than in Wales and Scotland since 2015
Image .csv .xls4. UK private rental growth by English regions
Focusing on the English regions, the largest annual rental price increase in the 12 months to February 2020 was in the South West (at 2.3%), unchanged since January 2020 (Figure 5). This was followed by the East Midlands, at 2.2%.
The lowest annual rental price growth was in the North East where rental prices increased by 0.7% in the 12 months to February 2020, followed by the North West, which increased by 1.0%.
Figure 5: Strongest annual rental price growth was in the South West
Index of Private Housing Rental Prices percentage change over the 12 months to February 2020, by English region
Source: Office for National Statistics – Index of Private Housing Rental Prices
Download this chart Figure 5: Strongest annual rental price growth was in the South West
Image .csv .xlsFigure 6 shows the historical 12-month percentage growth rate in the rental prices of each of the English regions.
Figure 6: London rental prices experienced higher increases and falls than other regions
Index of Private Housing Rental Prices percentage change over 12 months by English region, January 2007 to February 2020

Source: Office for National Statistics – Index of Private Housing Rental Prices
Notes:
- The grey line shows England’s 12-month average private rental price growth
Download this image Figure 6: London rental prices experienced higher increases and falls than other regions
.png (73.8 kB) .xls (84.0 kB)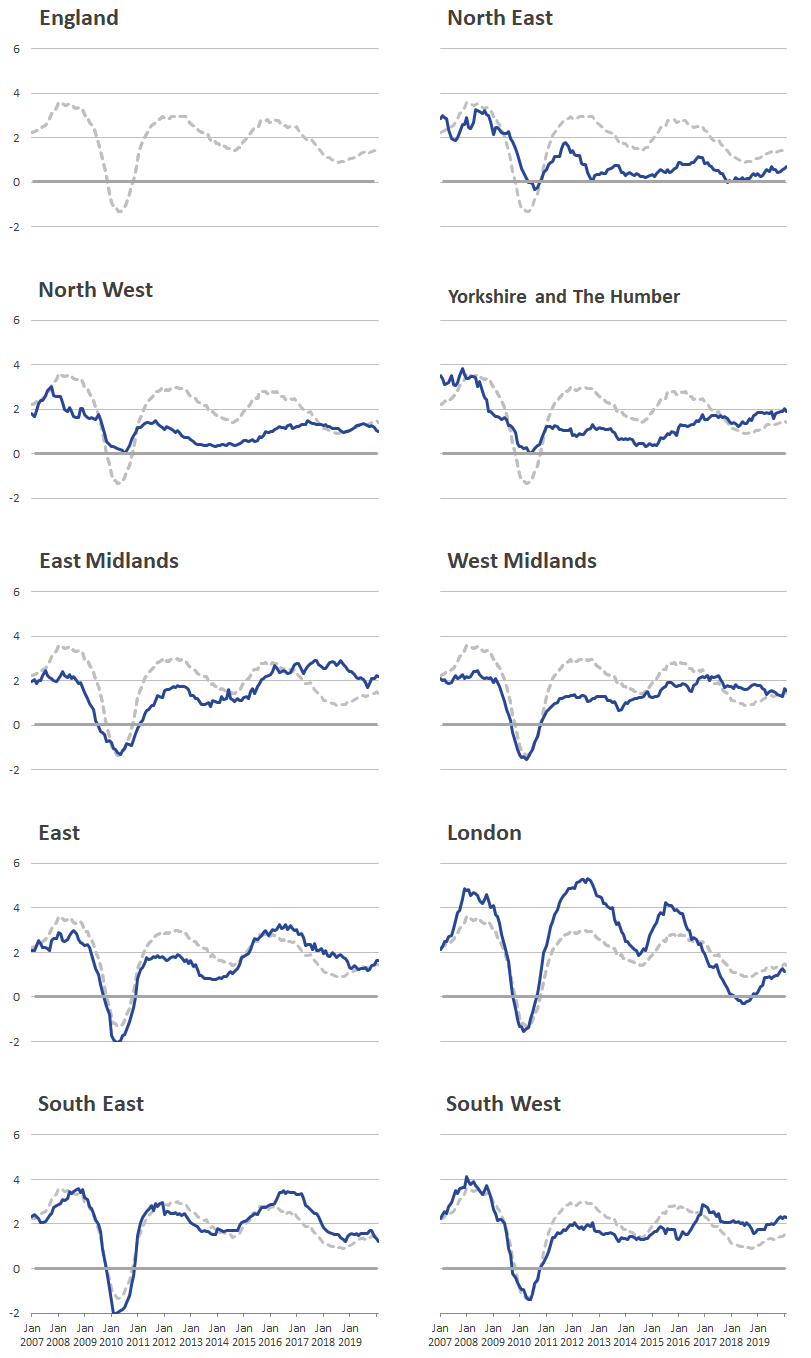
5. Private rental data
Index of Private Housing Rental Prices, UK: annual weights analysis
Dataset | Released 25 March 2020
Aggregate weights information used in the experimental Index of Private Housing Rental Prices (IPHRP).
Index of Private Housing Rental Prices, UK: monthly estimates
Dataset | Released 25 March 2020
Rental price index historical time series (index values and annual percentage change).
6. Glossary
Index of Private Housing Rental Prices (IPHRP)
The IPHRP measures the change in the price tenants face when renting residential property from private landlords.
Administrative data
Administrative data are data that people have already provided to government through day-to-day activities, for example, health records, social security payments or educational attainment information.
Nôl i'r tabl cynnwys7. Measuring the data
Coronavirus (COVID-19)
During the coronavirus (COVID-19) outbreak, we are working to ensure that we continue to publish the Index of Private Housing Rental Prices (IPHRP). The price collection for this publication has been largely unaffected. As this situation evolves, we are developing several solutions to meet potential scenarios depending on the amount of data that is able to be collected by our data suppliers to ensure we are still able to produce the publication over the coming months. These could involve incorporating minimal price updates to a previous month's collection. As the methodology gives a smoothed measure of rental prices, the impact of this approach is expected to be minimal. This process also applies for the rental equivalence measure used to measure owner occupiers' housing costs in the Consumer Prices Index including owner occupiers' housing costs (CPIH), which accounts for approximately 15% to 20% of the weight. Users will be informed of any changes to how the data are measured.
The Office for National Statistics (ONS) has released a public statement on COVID-19 and the production of statistics. Specific queries must be directed to the Media Relations Office.
After EU withdrawal
As the UK leaves the EU, it is important that our statistics continue to be of high quality and are internationally comparable. During the transition period, those UK statistics that align with EU practice and rules will continue to do so in the same way as before 31 January 2020.
After the transition period, we will continue to produce our inflation statistics in line with the UK Statistics Authority's Code of Practice for Statistics and in accordance with internationally agreed statistical guidance and standards.
Sources
The IPHRP is constructed using administrative data. This means that the index makes use of data that are already collected for other purposes to estimate rental prices. The sources of private rental prices are the Valuation Office Agency (VOA), Scottish Government, Welsh Government and Northern Ireland Housing Executive (NIHE). Data for Northern Ireland also include data provided by Propertynews.com. Estimates are based on a known sample rather than a census.
The sources of the annually updated expenditure weights are the Ministry of Housing, Communities and Local Government (MHCLG), Scottish Government, Welsh Government, Northern Ireland Housing Executive, and VOA.
The IPHRP's indices are updated on a monthly basis with the new monthly estimate. Data are indexed with January 2015 as a base year. Data for England are provided from January 2005, data for Wales from January 2009 and data for Scotland from January 2011. UK data are from January 2015.
Quality
More quality and methodology information on strengths, limitations, appropriate uses, and how the data were created is available in the IPHRP QMI.
Nôl i'r tabl cynnwys8. Strengths and limitations
Strengths
The Index of Private Housing Rental Prices (IPHRP) is constructed using large administrative sources, specified in Section 7: Measuring the data. Annually, over 450,000 private rents prices are collected in England, 30,000 in Wales, 25,000 in Scotland and 15,000 in Northern Ireland.
The index does not only measure the change in newly advertised rental prices but reflects price changes for all private rental properties.
Limitations
The IPHRP is published as price indices rather than average prices. It is also only published down to a country and regional level. While actual rental prices cannot currently be published in the IPHRP because of data access constraints, we are actively working to acquire the necessary data.
The IPHRP is released as an Experimental Statistic.
Nôl i'r tabl cynnwys