Cynnwys
- Main points
- Things you need to know about this release
- Summary of results
- Retired and non-retired households’ experience of changing prices and costs
- Low- and high-income households’ experience of changing prices and costs
- Experience of changing prices and costs for households with and without children
- Glossary
- Quality and methodology
- Annex A: Differences between HCIs and CPIH-consistent rates for UK household groups
1. Main points
This article presents the first preliminary estimates from the work completed to date on developing the Household Costs Indices; experimental indices are presented for UK household groups over the period January 2005 to June 2017, an all-households index is provided for reference.
The household group indices are compared with measures of nominal disposable income growth to demonstrate how these groups are faring in the economy between financial years ending 2006 and financial year ending 2016.
Retired households have experienced stronger rises in their prices and costs than non-retired households over the periods explored, with price rises for retired households averaging 2.6% per year, compared with 2.3% for non-retired households; however, the disposable income received by retired households has grown considerably more than the disposable income received by non-retired households.
Low-income households observe stronger rises in their prices and costs than high-income households, with poorer households (represented by the second income decile) seeing average annual price rises of 2.6%, while richer households (represented by the ninth income decile) saw annual average price rises of 2.2%; however, the divergence in growth is met by a similar divergence in growth in household disposable income for these two groups.
Households without children have also experienced stronger rises in their prices and costs than households with children, but again, this growth is matched by similar growth in household disposable income for each group.
2. Things you need to know about this release
What are the Household Costs Indices?
The Household Costs Indices (HCIs) are a set of experimental measures, currently in development, that aim to reflect UK households’ experience of changing prices and costs. More specifically they will aim to measure how much the nominal disposable income of different household groups would need to change, in response to changing prices and costs, to enable households to purchase the same quantities of goods and services at a fixed quality. Put simply, the broad approach of the HCIs is to measure the outgoings of households.
Since initiating development of the HCIs, a number of methodologies have been explored that result in the indices showing different growth rates to the UK’s lead measure of inflation, the Consumer Prices Index including owner occupiers’ housing costs (CPIH)1. The areas that have been explored, the impact that these methodologies would have if they were applied uniquely to the CPIH, and the cumulative impact of these changes are provided in the article Household Costs Indices: methodology.
For this release, the following methodologies have been applied:
- the use of democratic weighting
- a payments approach to owner occupiers’ housing costs (OOH)
- the use of gross expenditure to calculate the weight for insurance premia
- inclusion of a measure of interest on credit card debt
All other methodology remains consistent with the calculation of CPIH.
The HCIs are still in development and as such future estimates of the HCIs are expected to have different, or additional, items in scope. Furthermore, some of the aspects of methodology presented in this article may be improved. Therefore the aim of this article is to update users on progress towards development of the HCIs. For more information on other proposals that have been suggested for the HCIs, please refer to Developing the Household Costs Indices.
What household groups are presented in this article?
This article will cover the following household groups:
retired households and non-retired households
household groups by equivalised disposable income deciles
households with children and households without children
For definitions of these terms, please refer to the Glossary in section 7 of this article.
The indices for household groups are compared with an all-households index, constructed using the same methodology.
If you would like to provide feedback on the choice of household groups presented, please send comments to cpi@ons.gov.uk.
What is the structure of this release?
For each set of household groups, a similar structure is presented. The expenditure patterns for the household groups are covered first, followed by the average annual growth rates. Contributions to the change in the 12-month growth rate are presented, which highlight some of the main drivers of the growth rate for each household group.
The index for each household group is then compared with the growth in nominal mean equivalised disposable income for the respective household group. For more information on these terms, please refer to the Glossary in section 7.
What income measures are presented in this article?
Changes in prices and costs for household groups are presented in this article alongside measures of mean equivalised disposable income as produced within the Household Disposable Income and Inequality publication.
The interpretation of these results should be treated with caution, as there are elements within the two measures that mean they are not coherent. For example, the HCIs include changes in the cost of Council Tax, while the disposable income measure provided in this article deducts direct taxes (including Council Tax). This means that any changes in the cost of Council Tax will be counted in both measures. The measurement of real income in the UK: options for a coherent approach provides details of how measures of income and measures of changing prices and costs should be produced so that they are coherent.
Mean equivalised disposable household income is presented for each financial year (April to March) between financial year ending 2006 and financial year ending 2016. The annual figures presented are nominal, meaning that they do not make adjustments for changes in prices and costs. When comparing the HCIs with income, the indices have been re-referenced to the financial year ending 2006, and an annual average of each index values is used.
Quality and methodology information
For more information on the quality and methodology used to calculate these indices, please see “Quality and methodology” in section 8 of this article. We welcome feedback on these statistics to cpi@ons.gov.uk. We are also seeking feedback on the HCIs’ methodology to assist with prioritisation of future work. An optional questionnaire is provided in Annex A of the Household Costs Indices: methodology article to help guide responses. Any feedback should be sent to cpi@ons.gov.uk by Friday 23 February 2018.
Related publications
We have also produced CPIH-consistent inflation rate estimates for UK household groups. The CPIH is our most comprehensive measure of consumer price inflation. It measures the change in the prices of the goods and services consumed by households. However, because the consumption baskets of specific households differ and because prices do not all change at the same rate, the price experience of different groups of households may differ from the average figure for all households. Producing CPIH-consistent inflation rates for different household groups therefore provides an insight into how these price changes can vary between different groups, within an established framework based on economic principles.
Additional analysis is provided in Annex A (section 9) of this article that compares how the CPIH-consistent inflation rate estimates for UK household groups differ from the Household Costs Indices.
Notes for Things you need to know about this release
- CPIH measures changes in the price of goods and services consumed by households. Measuring changes in the cost of consumption goods and services is extremely important for measuring economic activity in the UK; however, it does not always reflect the changes in costs that are directly experienced by UK households.
3. Summary of results
Table 1: Average 12-month growth rates for selected household groups, UK, 2006 to 2016
| Group | 12-month growth rate (%) | ||||
| Decile of | 1 | 2 | 9 | 10 | All |
| Disposable income | 2.7 | 2.6 | 2.2 | 2.3 | 2.4 |
| Retired households | 2.6 | ||||
| Non-retired households | 2.3 | ||||
| Households with children | 2.2 | ||||
| Households without children | 2.5 | ||||
| Source: Office for National Statistics | |||||
| Notes: | |||||
| 1. Deciles of disposable income are calculated on an equivalised basis, adjusting for the composition of the household. See Glossary for more details. | |||||
| 2. Equivalised income deciles (1 equals lowest-income households, 10 equals highest-income households). | |||||
| 3. The average presented is the compound average 12-month growth rate of the unrounded indices. Consequently, it may differ from the arithmetic average of the 12-month growth rates presented in this article. | |||||
| 4. The all-households index is not calculated as an average of the income deciles, but is calculated as an index in its own right. | |||||
Download this table Table 1: Average 12-month growth rates for selected household groups, UK, 2006 to 2016
.xls (27.6 kB)4. Retired and non-retired households’ experience of changing prices and costs
How have prices and costs changed for retired and non-retired households?
The only difference between the indices presented in this analysis result from differences in the share of expenditure attributed to each category of item (under the assumption that each household group experiences the same price changes). Figure 1 presents the average expenditure share on each category of spending as a proportion of total household spending, for retired and non-retired household groups, in parts per thousand.
Figure 1: Average expenditure shares for each category of spending, retired and non-retired households
UK, 2005 to 2017
Source: Office for National Statistics
Notes:
- Expenditure shares may not sum to 1,000 due to rounding.
- Weights for each category of spending are averaged across the period of 2005 to 2017 (only the weights for January 2017 are included in the average).
Download this chart Figure 1: Average expenditure shares for each category of spending, retired and non-retired households
Image .csv .xlsBroadly, retired and non-retired households spend similar proportions of their expenditure on the same categories of spending. For example, both retired and non-retired households spend the largest proportion of their expenditure on housing and housing-related services (4. Housing, water, electricity, gas and other fuels), and a very small proportion of expenditure on education (10. Education).
However, there are categories of spending where the expenditure shares differ substantially for the two groups. To explore this further, Figure 2 presents the percentage difference in average expenditure shares (2005 to 2017) between retired and non-retired households for the 12 categories of spending.
Figure 2: Percentage difference in average expenditure shares for each category of spending, retired and non-retired households
UK, 2005 to 2017
Source: Office for National Statistics
Notes:
- "4. Housing" is composed of Housing, Owner occupiers' housing costs (OOH), water, electricity, gas and other fuels.
Download this chart Figure 2: Percentage difference in average expenditure shares for each category of spending, retired and non-retired households
Image .csv .xlsOn average, retired households have spent a larger proportion of their total expenditure on health than non-retired households between 2005 and 2017. Non-retired households spent a larger proportion of their total expenditure on education than retired households over the same period.
Both household groups spend a similar proportion of their expenditure on housing and housing-related services, recreation and culture, and miscellaneous goods and services. However, classifying these categories of spending in this way obscures some of the underlying trends. For example, when looking at the class level categories, the expenditure share on canteens, education and interest on credit card debt for non-retired households is nearly double that of retired households.
Conversely, retired households have an expenditure share more than double non-retired households for categories including: domestic services and household services (such as cleaners and gardeners); newspapers and periodicals; liquid fuels; medical services and equipment; postal services; gardens, plants and flowers; services for maintenance and repair of the dwelling; and fish.
Table 2 shows the 12-month growth rates experienced by retired and non-retired households between 2006 and 2016 (the last complete year of data), compared with an all-households index using the same methodology. The final row of the table shows the average 12-month growth rate for each group over the same period. On average over this period, retired households experience slightly faster growth than non-retired households (0.3 percentage points); however, looking at the individual years the trend is less clear. There are three distinct years where the trend is reversed and non-retired households experience stronger growth.
Table 2: 12-month growth rates for retired and non-retired household groups, alongside an all-households index, UK, 2006 to 2016
| Year | Non-retired | Retired | All-households |
|---|---|---|---|
| 2006 | 2.8 | 3.7 | 3.1 |
| 2007 | 3.4 | 3.7 | 3.5 |
| 2008 | 3.6 | 4.9 | 4 |
| 2009 | 0.4 | 1.7 | 0.8 |
| 2010 | 3.4 | 3 | 3.3 |
| 2011 | 4.6 | 4.8 | 4.7 |
| 2012 | 2.9 | 3.1 | 3 |
| 2013 | 2.4 | 2.6 | 2.5 |
| 2014 | 1.4 | 1.5 | 1.4 |
| 2015 | 0 | -0.3 | -0.1 |
| 2016 | 0.8 | 0.5 | 0.7 |
| Compound average | 2.3 | 2.6 | 2.4 |
| Source: Office for National Statistics | |||
| Notes: | |||
| 1. The average presented is the compound average 12-month growth rate of the unrounded indices. Consequently, it may differ from the arithmetic average of the 12-month growth rates presented in this article. | |||
Download this table Table 2: 12-month growth rates for retired and non-retired household groups, alongside an all-households index, UK, 2006 to 2016
.xls (27.1 kB)The 12-month growth rate by month (Figure 3) can provide more clarity on this trend. Between 2005 and 2009, retired households were experiencing stronger growth than non-retired households. Since 2010, this difference has converged. While there are a number of periods where retired households experienced stronger growth, there are also a number of periods where non-retired households experienced stronger growth, particularly since 2015, where the growth rate for retired households is marginally weaker.
Figure 3: 12-month growth rate for retired and non-retired households, alongside an all-households index
UK, January 2006 to June 2017
Source: Office for National Statistics
Download this chart Figure 3: 12-month growth rate for retired and non-retired households, alongside an all-households index
Image .csv .xlsFigures 4 and 5 present the contributions to the 12-month growth rates for retired and non-retired households respectively, which provide useful insight into the main drivers of these trends over time. The two series are driven by similar components: food and drink, housing, and housing- related services. However, the differences in the magnitude with which these components affect the 12-month growth rates for each household group explain the divergence in growth between these groups (Figure 6).
Figure 4: Contributions to the 12-month growth rate, retired households
UK, January 2006 to June 2017
Source: Office for National Statistics
Notes:
- Stacked bars reflect the percentage point contributions of each of the 87 class-level items to the 12-month growth rate. The contribution of each of the 87 class-level items is estimated separately, before being aggregated to 7 distinct categories.
- A reduction in the contribution of series to the annual rate of change need not imply falling prices, but could also reflect a lower rate of increase than the previous year.
- “Food & Drink” is composed of food, non-alcoholic and alcoholic beverages and tobacco. “Housing exc. OOH” is composed of actual rents and products and services for the repair of dwellings. Owner occupiers’ housing costs (payments) is a separate category. “Elect., gas and fuel” is composed of electricity, gas and other household fuels as well as fuels and lubricants for motor vehicles. “Transport and package holidays” includes passenger transport by road, rail, air and sea, as well as package holidays. “Education” reflects the division-level contribution. The “other” category reflects the combined contributions of the remaining class-level items, bringing the sum of contributions to the inflation rate.
- Contributions may not sum due to rounding.
Download this chart Figure 4: Contributions to the 12-month growth rate, retired households
Image .csv .xls
Figure 5: Contributions to the 12-month growth rate, non-retired households
UK, January 2006 to June 2017
Source: Office for National Statistics
Notes:
- Stacked bars reflect the percentage point contributions of each of the 87 class-level items to the 12-month growth rate. The contribution of each of the 87 class-level items is estimated separately, before being aggregated to 7 distinct categories.
- A reduction in the contribution of series to the annual rate of change need not imply falling prices, but could also reflect a lower rate of increase than the previous year.
- “Food & Drink” is composed of food, non-alcoholic and alcoholic beverages and tobacco. “Housing exc. OOH” is composed of actual rents and products and services for the repair of dwellings. Owner occupiers’ housing costs (payments) is a separate category. “Elect., gas and fuel” is composed of electricity, gas and other household fuels as well as fuels and lubricants for motor vehicles. “Transport and package holidays” includes passenger transport by road, rail, air and sea, as well as package holidays. “Education” reflects the division-level contribution. The “other” category reflects the combined contributions of the remaining class-level items, bringing the sum of contributions to the inflation rate.
- Contributions may not sum due to rounding.
Download this chart Figure 5: Contributions to the 12-month growth rate, non-retired households
Image .csv .xls
Figure 6: Contributions to the difference in the 12-month growth rate, retired households less non-retired households
UK, January 2006 to June 2017
Source: Office for National Statistics
Notes:
- Stacked bars reflect the percentage point contributions of each of the 87 class-level items to the difference in 12-month growth rates. The contribution of each of the 87 class-level items is estimated separately, before being aggregated to 7 distinct categories.
- A reduction in the contribution of series to the annual rate of change need not imply falling prices, but could also reflect a lower rate of increase than the previous year.
- “Food & Drink” is composed of food, non-alcoholic and alcoholic beverages and tobacco. “Housing exc. OOH” is composed of actual rents and products and services for the repair of dwellings. Owner occupiers’ housing costs (payments) is a separate category. “Elect., gas and fuel” is composed of electricity, gas and other household fuels as well as fuels and lubricants for motor vehicles. “Transport and package holidays” includes passenger transport by road, rail, air and sea, as well as package holidays. “Education” reflects the division-level contribution. The “other” category reflects the combined contributions of the remaining class-level items, bringing the sum of contributions to the inflation rate.
- Contributions may not sum due to rounding.
Download this chart Figure 6: Contributions to the difference in the 12-month growth rate, retired households less non-retired households
Image .csv .xlsThe two upward spikes observed in Figure 6 prior to October 2009 indicate that retired households experienced stronger growth in those periods than non-retired households. The difference was driven largely by food and drink and electricity, gas and other fuels. The prices for these categories of items were rising during these time periods, and as retired households are observed to spend a larger proportion of their expenditure on these categories of spending, they experience faster growth during these periods.
Stronger positive contributions from education have consistently increased the growth rate experienced by non-retired households. This is to be expected as a higher share of expenditure on education for non-retired households will accentuate any fluctuations in the price of education for that particular group.
Since 2012, the contributions that lead to retired households experiencing stronger growth (from food and drink, and electricity, gas and other fuels) have been offset by components such as education, transport and housing. Between 2014 and 2016, food and drink prices were falling, which contributed to non-retired households experiencing marginally faster growth.
How does nominal disposable income compare with changes in prices and costs for retired and non-retired households?
The cumulative income growth1 is compared with the cumulative HCIs’ growth in Figures 7 and 8 for non-retired and retired households respectively.
Figure 7: Mean equivalised disposable household income (nominal) and Household Costs Indices cumulative growth, non-retired households
UK, financial years ending 2006 to 2016, index financial year ending 2006 = 100
Source: Office for National Statistics
Download this chart Figure 7: Mean equivalised disposable household income (nominal) and Household Costs Indices cumulative growth, non-retired households
Image .csv .xls
Figure 8: Mean equivalised disposable household income (nominal) and Household Costs Indices cumulative growth, retired households
UK, financial years ending 2006 to 2016, index financial year ending 2006 = 100
Download this chart Figure 8: Mean equivalised disposable household income (nominal) and Household Costs Indices cumulative growth, retired households
Image .csv .xlsBetween financial year ending 2006 and financial year ending 2016, non-retired households have experienced similar changes in their income and their household costs (as measured by the HCIs). Household income for non-retired households has increased by 26% over this period, while household costs for this group have increased 27%.
While household costs for retired households have increased at a faster rate than non-retired households, their income has also increased considerably more than non-retired households and considerably more than their household costs. Household income for retired households increased 49% between financial year ending 2006 and financial year ending 2016; however, household costs for retired households only increased 32% over this same period.
Notes for Retired and non-retired households’ experience of changing prices and costs
- Details of the income measure used within this publication are provided in Section 2 of this article, “Things you need to know about this release”, under the heading “What income measures are presented in this article?”
5. Low- and high-income households’ experience of changing prices and costs
How have prices and costs changed for households with different levels of income?
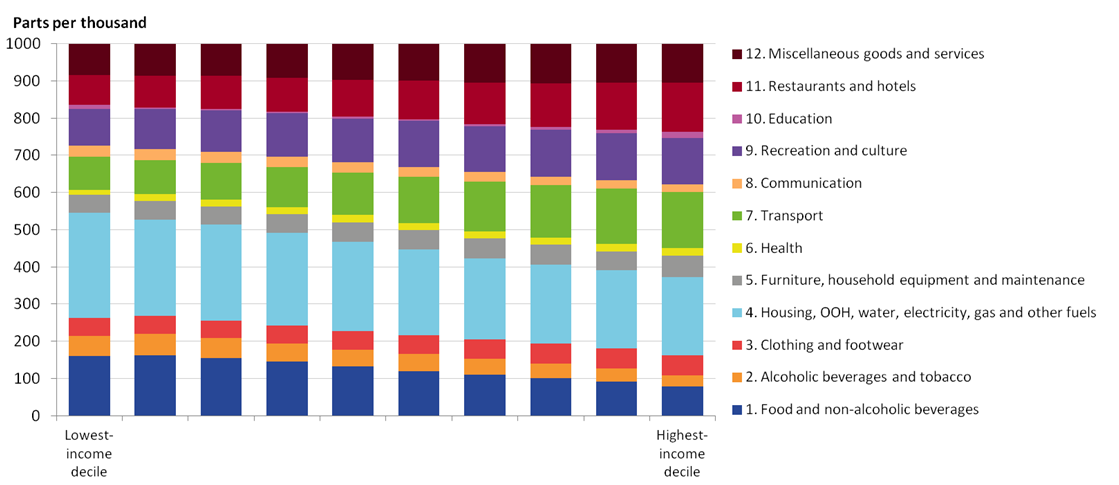
As well as dividing households by retirement status, the population of UK households can also be divided into income deciles: 10 equally-sized groups of households ranked by their equivalised disposable income (as described in the Glossary of this article). Figure 9 presents the average household expenditure share on each category (division) as a proportion of average expenditure on all items by each decile.
Figure 9: Average expenditure shares by category of spending, by equivalised disposable income decile
UK, 2005 to 2017
Source: Office for National Statistics
Notes:
- Equivalised disposable income deciles (1 equals lowest-income households, 10 equals highest-income households).
- Expenditure shares may not sum to 1,000 due to rounding.
- Weights for each category of spending are averaged across the period of 2005 to 2017 (only the weights for January 2017 are included in the average).
Download this image Figure 9: Average expenditure shares by category of spending, by equivalised disposable income decile
.png (80.3 kB) .xls (29.7 kB)Over the period 2005 to 2017, average expenditure shares on essential items (such as food, housing and housing-related services) decline smoothly between the lowest- and highest-income deciles. Conversely, average expenditure shares on restaurants, hotels and transport gradually increase between the lowest- and highest-income deciles over this same period. Education shows an irregular trend, while the average expenditure share between the first and second income deciles reduces. The average expenditure share then increases again in the highest-income decile.
As the lowest (1) and highest (10) income deciles are expected to share the same unusual composition as described in CPIH-consistent inflation rate estimates for UK household groups, they may display unusual spending patterns that could obscure the underlying trends. As such, for the remainder of this article the second and ninth deciles are chosen to be representative of low-income households and high-income households respectively.
The difference in average weight between the second and and ninth income decile for each category of spending are provided in Figure 10.
Figure 10: Percentage difference in average expenditure shares for each category of spending, low-income households (second decile) and high-income households (ninth decile)
UK, 2005 to 2017
Source: Office for National Statistics
Notes:
- "4. Housing" is composed of Housing, Owner occupiers' housing costs (OOH), water, electricity, gas and other fuels.
Download this chart Figure 10: Percentage difference in average expenditure shares for each category of spending, low-income households (second decile) and high-income households (ninth decile)
Image .csv .xlsPresenting the weights at this aggregate level obscures some of the underlying trends. For example, within the transport division, low-spending households (second decile) spend a much greater proportion of their expenditure on passenger transport by road (including coach, bus and taxi fares), whereas high-spending households (ninth decile) spend a much greater proportion of their expenditure on passenger transport by railway and the purchase of vehicles (including new and second-hand cars, motorbikes and bicycles).
The differences in the expenditure shares of households within each of the 10 income deciles drive differences in the growth rates experienced by these groups. Table 3 shows the average 12-month growth rate experienced by each equivalised income decile between 2006 and 2016 (the last complete year of data), compared with an all-households index that uses the same underlying methodology.
It can be observed that there is variation in the 12-month growth rate experienced by households with differing levels of equivalised income: the average 12-month growth rate over this period ranges from 2.7% for households in the lowest income decile to 2.3% for those in the highest decile. The all-households index has grown by 2.4% over this same period. This is equivalent to the average growth rate experienced by the fifth and sixth deciles within the income distribution.
Table 3: Average 12-month growth rate (%) for equivalised disposable income deciles, alongside an all-households index, UK, 2006 to 2016
| Year | Equivalised disposable income decile | All-households | |||||||||
|---|---|---|---|---|---|---|---|---|---|---|---|
| 1 | 2 | 3 | 4 | 5 | 6 | 7 | 8 | 9 | 10 | ||
| 2006 | 3.6 | 3.4 | 3.4 | 3.2 | 3 | 2.9 | 2.9 | 2.7 | 2.8 | 2.7 | 3.1 |
| 2007 | 3.7 | 3.5 | 3.4 | 3.4 | 3.4 | 3.5 | 3.4 | 3.4 | 3.5 | 3.7 | 3.5 |
| 2008 | 4.5 | 4.5 | 4.4 | 4.2 | 4 | 3.9 | 3.7 | 3.6 | 3.4 | 3.5 | 4 |
| 2009 | 1.3 | 1.6 | 1.5 | 1.4 | 1 | 0.6 | 0.4 | 0.2 | -0.1 | -0.2 | 0.8 |
| 2010 | 2.9 | 2.9 | 3.2 | 3 | 3.3 | 3.4 | 3.4 | 3.7 | 3.7 | 3.6 | 3.3 |
| 2011 | 4.9 | 4.8 | 4.9 | 4.7 | 4.6 | 4.7 | 4.6 | 4.7 | 4.5 | 4.5 | 4.7 |
| 2012 | 3.5 | 3.3 | 3.3 | 3 | 3 | 2.9 | 2.8 | 2.7 | 2.6 | 2.6 | 3 |
| 2013 | 2.8 | 2.8 | 2.7 | 2.5 | 2.5 | 2.4 | 2.3 | 2.2 | 2.3 | 2.3 | 2.5 |
| 2014 | 1.8 | 1.6 | 1.5 | 1.4 | 1.4 | 1.4 | 1.3 | 1.2 | 1.3 | 1.4 | 1.4 |
| 2015 | 0 | -0.1 | -0.2 | -0.1 | -0.1 | -0.2 | -0.2 | -0.1 | -0.1 | 0.2 | -0.1 |
| 2016 | 0.7 | 0.5 | 0.6 | 0.7 | 0.7 | 0.7 | 0.7 | 0.8 | 0.8 | 0.9 | 0.7 |
| Compound average | 2.7 | 2.6 | 2.6 | 2.5 | 2.4 | 2.4 | 2.3 | 2.3 | 2.2 | 2.3 | 2.4 |
| Source: Office for National Statistics | |||||||||||
| Notes: | |||||||||||
| 1. Deciles of disposable income are calculated on an equivalised basis, adjusting for the composition of the household. See Glossary for more details. | |||||||||||
| 2. Equivalised income deciles (1 equals lowest-income households, 10 equals highest-income households) | |||||||||||
| 3. The average presented is the compound average 12-month growth rate of the unrounded indices. Consequently, it may differ from the arithmetic average of the 12-month growth rates presented in this article. | |||||||||||
Download this table Table 3: Average 12-month growth rate (%) for equivalised disposable income deciles, alongside an all-households index, UK, 2006 to 2016
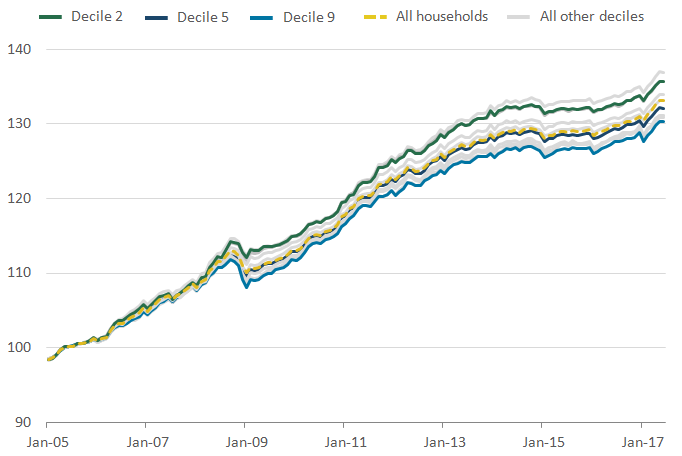
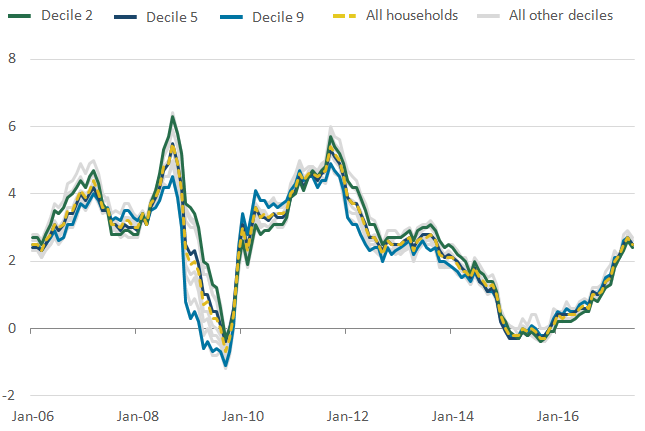
.xls (29.2 kB)To provide more clarity on this trend, Figure 11 presents the 12-month growth rate for selected income deciles along with the range of rates for all income deciles and an all-households index, between January 2005 and June 2017. The spread between 12-month growth rates is largest between 2008 and 2009. Since 2013, all income deciles have experienced similar rates of growth.
Figure 11: Range of 12-month growth rates for selected equivalised income deciles, alongside an all-households index
UK, January 2006 to June 2017

Source: Office for National Statistics
Notes:
- Equivalised income deciles (1 equals lowest-income households, 10 equals highest-income households).
Download this image Figure 11: Range of 12-month growth rates for selected equivalised income deciles, alongside an all-households index
.png (52.7 kB) .xls (45.6 kB)Cumulative changes in prices and costs over time can be seen in Figure 12. Since 2005, prices and costs of purchases by low-income households (second decile) have risen by 36%, while prices and costs of purchases by high-income households (ninth decile) have risen by 30%. The cumulative difference between the second and ninth deciles is therefore 5 index points over the period since 2005.
Note that individual households will only have experienced these differences if they were consistently placed in the same income decile through time. As it is expected that households would move between income deciles throughout their life-cycle, the cumulative growth presented in Figure 12 is for the goods, services and other financial transactions that households in each decile purchase through time, rather than the experience of the households themselves.
Figure 12: Cumulative changes in prices and costs for selected equivalised income deciles and an all-households index
UK, January 2005 to June 2017
Source: Office for National Statistics
Notes:
- Equivalised income deciles (1 equals lowest-income households, 10 equals highest-income households).
Download this image Figure 12: Cumulative changes in prices and costs for selected equivalised income deciles and an all-households index
.png (30.1 kB) .xls (38.4 kB)The contributions to the 12-month growth rate (Figures 13 and 14) give an overview of the main drivers of the 12-month growth rates for the second and ninth income deciles. These categories are broadly similar for both groups over time, including food and drink, and electricity, gas and fuels. To understand what is driving the disparity between the two series, the differences between the contributions to 12-month growth for these two household groups are provided in Figure 15.
Figure 13: Contributions to the 12-month growth rate, second equivalised disposable income decile
UK, January 2006 to June 2017
Source: Office for National Statistics
Notes:
- Stacked bars reflect the percentage point contributions of each of the 87 class-level items to the 12-month growth rate. The contribution of each of the 87 class-level items is estimated separately, before being aggregated to 7 distinct categories.
- A reduction in the contribution of series to the annual rate of change need not imply falling prices, but could also reflect a lower rate of increase than the previous year.
- “Food & Drink” is composed of food, non-alcoholic and alcoholic beverages and tobacco. “Housing exc. OOH” is composed of actual rents and products and services for the repair of dwellings. Owner occupiers’ housing costs (payments) is a separate category. “Elect., gas and fuel” is composed of electricity, gas and other household fuels as well as fuels and lubricants for motor vehicles. “Transport and package holidays” includes passenger transport by road, rail, air and sea, as well as package holidays. “Education” reflects the division-level contribution. The “other” category reflects the combined contributions of the remaining class-level items, bringing the sum of contributions to the inflation rate.
- Contributions may not sum due to rounding.
Download this chart Figure 13: Contributions to the 12-month growth rate, second equivalised disposable income decile
Image .csv .xls
Figure 14: Contributions to the 12-month growth rate, ninth equivalised disposable income decile
UK, January 2006 to June 2017
Source: Office for National Statistics
Notes:
- Stacked bars reflect the percentage point contributions of each of the 87 class-level items to the 12-month growth rate. The contribution of each of the 87 class-level items is estimated separately, before being aggregated to 7 distinct categories.
- A reduction in the contribution of series to the annual rate of change need not imply falling prices, but could also reflect a lower rate of increase than the previous year.
- “Food & Drink” is composed of food, non-alcoholic and alcoholic beverages and tobacco. “Housing exc. OOH” is composed of actual rents and products and services for the repair of dwellings. Owner occupiers’ housing costs (payments) is a separate category. “Elect., gas and fuel” is composed of electricity, gas and other household fuels as well as fuels and lubricants for motor vehicles. “Transport and package holidays” includes passenger transport by road, rail, air and sea, as well as package holidays. “Education” reflects the division-level contribution. The “other” category reflects the combined contributions of the remaining class-level items, bringing the sum of contributions to the inflation rate.
- Contributions may not sum due to rounding.
Download this chart Figure 14: Contributions to the 12-month growth rate, ninth equivalised disposable income decile
Image .csv .xls
Figure 15: Contributions to the difference in 12-month growth experienced by equivalised disposable income deciles, second decile less ninth decile
Notes:
- Stacked bars reflect the percentage point contributions of each of the 87 class-level items to the difference in 12-month growth rates. The contribution of each of the 87 class-level items is estimated separately, before being aggregated to 7 distinct categories.
- A reduction in the contribution of series to the annual rate of change need not imply falling prices, but could also reflect a lower rate of increase than the previous year.
- “Food & Drink” is composed of food, non-alcoholic and alcoholic beverages and tobacco. “Housing exc. OOH” is composed of actual rents and products and services for the repair of dwellings. Owner occupiers’ housing costs (payments) is a separate category. “Elect., gas and fuel” is composed of electricity, gas and other household fuels as well as fuels and lubricants for motor vehicles. “Transport and package holidays” includes passenger transport by road, rail, air and sea, as well as package holidays. “Education” reflects the division-level contribution. The “other” category reflects the combined contributions of the remaining class-level items, bringing the sum of contributions to the inflation rate.
- Contributions may not sum due to rounding.
Download this chart Figure 15: Contributions to the difference in 12-month growth experienced by equivalised disposable income deciles, second decile less ninth decile
Image .csv .xlsFigure 15 suggests that it is food and drink, as well as electricity, gas and fuels, that act to increase the 12-month growth rate for the lower-income households (represented by the second income decile) compared with higher-income households (represented by the ninth income decile). However, when there are increases in the cost of owner occupation (as measured by the payments approach), high-income households experience a stronger 12-month growth rate. This is because households with higher-income spend a larger proportion of their expenditure on owner-occupiers’ housing costs (OOH). When OOH are falling (for example, when mortgage interest payments declined in 2009), the downward pull on the growth of high-income households leads to low-income households experiencing stronger growth.
Since 2014, the contributions from all categories have been subdued suggesting the prices and costs for these items have remained relatively stable. The contributions to low-income households experiencing stronger growth are offset by contributions that would lead to high-income households experiencing stronger growth.
How does nominal disposable income compare with changes in prices and costs for households with different levels of income?
The cumulative income growth1 is compared with the cumulative HCIs’ growth in Figures 16, 17 and 18 for low-income households (represented by households within the second equivalised disposable income decile), mid-income households (represented by households within the fifth equivalised disposable income decile) and high-income households (represented by households within the ninth equivalised disposable income decile) respectively.
Figure 16: Mean equivalised disposable household income (nominal) and Houshold Costs Inidces cumulative growth, low-income households
UK, financial years ending 2006 to 2016, index financial year ending 2006 = 100
Source: Office for National Statistics
Download this chart Figure 16: Mean equivalised disposable household income (nominal) and Houshold Costs Inidces cumulative growth, low-income households
Image .csv .xls
Figure 17: Mean equivalised disposable household income (nominal) and Household Costs Indices cumulative growth, mid-income households
UK, financial years ending 2006 to 2016, index financial year ending 2006 = 100
Source: Office for National Statistics
Download this chart Figure 17: Mean equivalised disposable household income (nominal) and Household Costs Indices cumulative growth, mid-income households
Image .csv .xls
Figure 18: Mean equivalised disposable household income (nominal) and Household Costs Indices cumulative growth, high-income households
UK, financial years ending 2006 to 2016, index financial year ending 2006 = 100
Source: Office for National Statistics
Download this chart Figure 18: Mean equivalised disposable household income (nominal) and Household Costs Indices cumulative growth, high-income households
Image .csv .xlsFigures 16 to 18 show that while there are divergences in changes in prices and costs for households within different equivalised disposable income deciles, these changes are typically matched with similar changes in income. While prices and costs of purchases by low-income households have grown faster (31% over the period 2005 to 2006 to financial year ending 2016) than prices and costs of high-income households (26% over the same period), the income of low-income households has also experienced stronger growth (39% for low-income households compared with 28% for high-income households).
The most recent year’s data available shows a strong divergence for the low-income group, however, given this pattern has only been seen at one time point it is difficult to discern whether this is a trend in the data or a temporary divergence in the figures.
Notes for Low- and high-income households’ experience of changing prices and costs
- Details of the income measure used within this publication are provided in Section 2 of this article, “Things you need to know about this release”, and under the heading “What income measures are presented in this article?”
6. Experience of changing prices and costs for households with and without children
How have prices and costs changed for households with and without children?
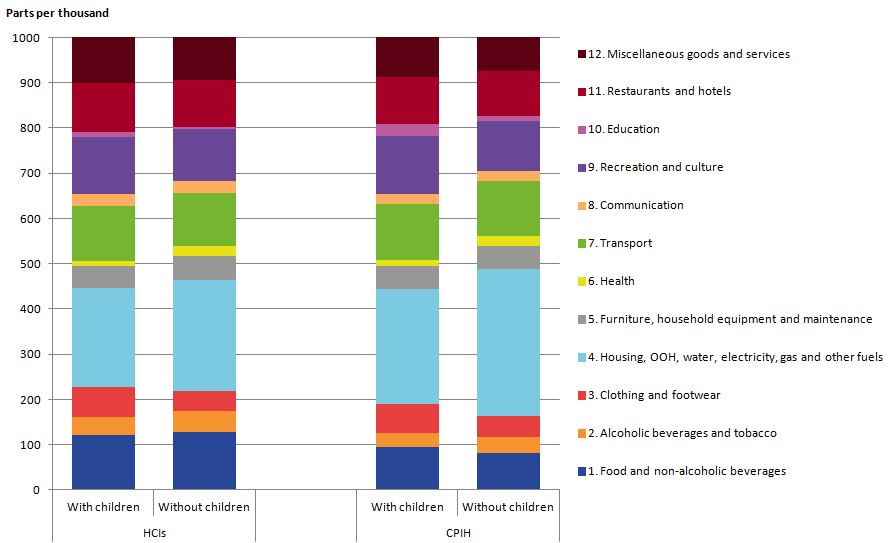
Another interesting way to group households within the population is by comparing changing prices and costs for households with children with households who do not have children. Whether or not there are children within a household can influence the goods and services that the household purchases. Figure 19 presents the average expenditure shares of households with and without children by category of spending over the period 2005 to 2017.
Figure 19: Average expenditure shares by category of spending, households with and without children
UK, 2005 to 2017
Source: Office for National Statistics
Notes:
- Expenditure shares may not sum to 1,000 due to rounding.
- Weights for each category of spending are averaged across the period of 2005 to 2017 (only the weights for January 2017 are included in the average).
Download this chart Figure 19: Average expenditure shares by category of spending, households with and without children
Image .csv .xlsThe patterns of household spending between households with and without children appear extremely similar. Figure 20 provides the percentage difference between average expenditure shares of households with children and households without children.
Figure 20: Percentage difference in average expenditure shares for each category of spending between households with children and households without children
UK, 2005 to 2017
Source: Office for National Statistics
Notes:
- "4. Housing" is composed of Housing, Owner occupiers' housing costs (OOH), water, electricity, gas and other fuels.
Download this chart Figure 20: Percentage difference in average expenditure shares for each category of spending between households with children and households without children
Image .csv .xlsAs would be expected, households with children spend a greater proportion of their expenditure on education than households without children. Conversely, households without children spend a greater proportion of their expenditure on health. This could be explained through the assumption that a greater proportion of retired households make up this group and, as shown in section 4, retired households spend a larger proportion of their expenditure on health than non-retired households. Differences in other categories of spending are minor, and investigations into class level categories provide little more insight than explorations of the data at this aggregate level.
The differences in the expenditure shares of households with and without children drive differences in the growth rates experienced by these groups. Table 4 shows the average 12-month growth rate experienced by these household groups between 2006 and 2016 (the last complete year of data), compared with an all-households index that uses the same underlying methodology. The final row of the table shows the compound average 12-month growth rate for each group over the same period.
On average over this period, households without children have experienced faster growth than households with children (0.3 percentage points). This trend is consistent across the years 2006 to 2014. In 2015 and 2016, on average the two groups experienced the same level of growth.
Table 4: 12-month growth rates for households with and without children, alongside an all-households index, UK, 2006 to 2016
| % | |||
| Year | With children | Without children | All-households |
|---|---|---|---|
| 2006 | 2.6 | 3.3 | 3.1 |
| 2007 | 3.3 | 3.6 | 3.5 |
| 2008 | 3.5 | 4.2 | 4 |
| 2009 | 0.3 | 1 | 0.8 |
| 2010 | 3.2 | 3.3 | 3.3 |
| 2011 | 4.4 | 4.8 | 4.7 |
| 2012 | 2.8 | 3 | 3 |
| 2013 | 2.4 | 2.5 | 2.5 |
| 2014 | 1.4 | 1.5 | 1.4 |
| 2015 | -0.1 | -0.1 | -0.1 |
| 2016 | 0.7 | 0.7 | 0.7 |
| Compound average | 2.2 | 2.5 | 2.4 |
| Source: Office for National Statistics | |||
| Notes: | |||
| 1. The average presented is the compound average 12-month growth rate of the unrounded indices. Consequently, it may differ from the arithmetic average of the 12-month growth rates presented in this article. | |||
Download this table Table 4: 12-month growth rates for households with and without children, alongside an all-households index, UK, 2006 to 2016
.xls (27.1 kB)To present this trend more clearly, Figure 21 displays the 12-month growth rates for households with and without children between January 2006 and June 2017, alongside an all-household index measured using the same methodology. The growth rate experienced by households without children is typically more in line with the all-households index; however, these differences have converged in recent years.
Figure 21: 12-month growth rate for households with and without children, alongside an all-households index
UK, January 2006 to June 2017
Source: Office for National Statistics
Download this chart Figure 21: 12-month growth rate for households with and without children, alongside an all-households index
Image .csv .xlsTo explore this further, Figure 22 explores the difference in contributions to the 12-month growth rate for households with and without children.
Figure 22: Contributions to the difference in 12-month growth experienced by households with and without children: households without children less households with children
Source: Office for National Statistics
Download this chart Figure 22: Contributions to the difference in 12-month growth experienced by households with and without children: households without children less households with children
Image .csv .xlsCategories of spending that have a larger weight for households without children (such as food and drink, housing and electricity, gas and fuel) typically have greater price movements and are a large weight, therefore they lead to households without children experiencing stronger growth between 2006 and 2013. Households with children have a marginally larger weight for owner occupiers’ housing costs (OOH) (payments) than households without children, therefore when prices are seen to decrease in this category in 2009, this further contributes to households without children experiencing stronger growth.
Households without children experiencing stronger growth is partially offset by changes in the cost of education. As households with children spend a greater proportion of their expenditure on this category, any price rises will have a greater influence on their 12-month growth rate.
How does nominal disposable income compare with changes in prices and costs for households with and without children?
The cumulative income growth1 is compared with the cumulative HCIs’ growth in Figures 23 and 24 for households with children and households without children respectively.
Figure 23: Mean equivalised disposable household income (nominal) and Household Costs Indices cumulative growth, households without children
UK, financial years ending 2006 to 2016, index financial year ending 2006 equals 100
Source: Office for National Statistics
Download this chart Figure 23: Mean equivalised disposable household income (nominal) and Household Costs Indices cumulative growth, households without children
Image .csv .xls
Figure 24: Mean equivalised disposable household income (nominal) and Household Costs Indices cumulative growth, households with children
UK, financial years ending 2006 to 2016, index financial year ending 2006 equals 100
Source: Office for National Statistics
Download this chart Figure 24: Mean equivalised disposable household income (nominal) and Household Costs Indices cumulative growth, households with children
Image .csv .xlsThe mean equivalised disposable income of households with and without children has grown at a remarkably similar rate over this period (30% increase for households with children and 31% increase for households without children). While households without children have faced similar cumulative growth in their prices and costs over this period (30% increase), households with children have shown slower growth (26% increase). However, this divergence between disposable income and costs for households with children is only seen in the most recent period of data (financial year ending 2015 to financial year ending 2016), so it is difficult to observe whether this is a trend in the data or just a temporary divergence in the figures.
Notes for Experience of changing prices and costs for households with and without children
- Details of the income measure used within this publication are provided in Section 2 of this article, “Things you need to know about this release”, and under the heading “What income measures are presented in this article?”