Cynnwys
- Main points
- Introduction
- A brief description of owner occupiers’ housing costs
- Payments
- Net acquisitions
- Rental equivalence
- Comparing the different approaches of measuring owner occupiers’ housing costs
- Spotlight: Owner occupiers' housing costs in the RPI
- Annex 1A: Payments methodology
- Annex 1B: Net acquisitions methodology
- Annex 1C: Rental equivalence methodology
1. Main points
Owner occupiers’ housing costs (OOH) in the UK under the rental equivalence approach have grown by 2.4% in Quarter 3 (July to Sept) 2016.
OOH according to the net acquisition approach have grown by 2.1% in Quarter 3 2016.
OOH compiled using the payments approach experienced growth of 1.3% in Quarter 3 2016.
Nôl i'r tabl cynnwys2. Introduction
This series of articles aims to provide more information about the different approaches to measuring owner occupiers’ housing costs (OOH) to aid your understanding of the differences in concept and underlying methodology. It will be updated on a quarterly basis to evaluate the performance of the different measures over time, in prevailing economic conditions. It will also include a new “spotlight” section each quarter that focuses on a particular topic relevant to the measurement of OOH. This quarter, the spotlight will compare the measure of OOH used in the RPI alongside the other approaches. We invite you to submit ideas for future spotlights to cpi@ons.gsi.gov.uk.
For more information about the different methods, please see the first article in the series – Understanding the different approaches of measuring owner occupiers’ housing costs (OOH): Quarter 2 (Apr to June) 2016, which provides a more detailed description of each of the methods. This first article also provides a more detailed commentary and analysis of the historical time series and the main drivers behind these long-term trends. You should note that the payments approach and net acquisitions are both experimental indices and therefore we would caution against any use other than for research purposes. More information on the methodology for each approach can also be found in Annex 1.
Nôl i'r tabl cynnwys3. A brief description of owner occupiers’ housing costs
The Consumer Prices Index including owner occupiers’ housing costs (CPIH) is identical to the UK’s headline measure of consumer price inflation, the Consumer Prices Index (CPI), with the additional inclusion of a measure of owner occupiers’ housing costs (OOH)1. OOH are the costs of housing services associated with owning, maintaining and living in one’s own home. This is distinct from the cost of purchasing a house which is partly for the accumulation of wealth and partly for housing services.
There is not a single defined measure of OOH because they can be calculated differently depending on what the target is. In particular, should OOH be measured at the point of acquisition of the housing service, the point of use, or the point at which it is paid for? Each of these 3 approaches has its own specific methodological strengths and weaknesses, and is measured using different methods.
Notes for: A brief description of owner occupiers’ housing costs
- From March 2017, CPIH will also include a measure of Council Tax in the index. Please see the National Statistician’s statement for more information.
4. Payments
What is the payments approach?
The payments approach aims to measure the payments related to the ownership of owner occupier housing. This means that all payments that households make as owner occupiers when consuming housing should be included, such as mortgage interest payments, transaction costs such as estate agency fees and legal fees, and running costs such as repairs and maintenance, ground rent and dwelling insurance. The payments approach is not our favoured method to measuring owner occupiers’ housing costs (OOH) in CPIH. This is because a consumer prices index aims to measure consumption, and interest payments represent the cost of borrowing money rather than the cost of consumption.
OOH(Payments) is an experimental series, and we therefore advise using it with some caution. We are continuing to work on identifying possible improvements to the current methodology and data sources. Any changes to the index will be highlighted in future releases and we will update the methodology section and historical series accordingly. For more information on the current methodology and data sources used to construct the OOH(Payments) approach, please see Annex 1A.
Latest figure and long-term trend
Owner occupiers’ housing costs compiled using the payments approach experienced growth of 1.3% in Quarter 3 (July to Sept) 2016 compared with Quarter 3 2015 (Figure 1). This remains unchanged from Quarter 2 (Apr to June) 2016 and is in line with historical trends.
Figure 2 presents the contributions to the quarterly growth rate of OOH(Payments) from the sub-indices used in its construction. Looking at contributions to growth is helpful to provide insight into the main drivers behind the year-on-year changes in the series. Council Tax was the highest positive contributor, which is in line with recent quarters. Mortgage interest rates also remain the largest negative contributor. The drop in the Bank of England base rate to 0.25% in August 2016 could impact on the contribution from mortgage interest payments in the future.
For a longer time series of contributions, please see the dataset presented alongside this release.
Figure 1: OOH (Payments) growth rate, quarter on corresponding quarter of previous year
UK, Quarter 1 (Jan to Mar) 2006 to Quarter 3 (July to Sept) 2016
Source: Office for National Statistics
Notes:
- Q1 refers to Quarter 1 (Jan to Mar); Q2 refers to Quarter 2 (Apr to June); Q3 refers to Quarter 3 (July to Sept); and Q4 refers to Quarter 4 (Oct to Dec).
Download this chart Figure 1: OOH (Payments) growth rate, quarter on corresponding quarter of previous year
Image .csv .xls
Figure 2: Contributions to percentage change in OOH(Payments) from component sub-indices, latest quarter on corresponding quarter of previous year
UK, Quarter 3 (July to Sept) 2016
Source: Office for National Statistics
Notes:
- Contributions may not sum due to rounding. Council Tax includes council Tax in Great Britain and Northern Ireland rates. Other includes dwelling insurance, ground rent, estate agent fees, home-buyers survey and house conveyancing.
- Q1 refers to Quarter 1 (Jan to Mar); Q2 refers to Quarter 2 (Apr to June); Q3 refers to Quarter 3 (July to Sept); and Q4 refers to Quarter 4 (Oct to Dec).
Download this chart Figure 2: Contributions to percentage change in OOH(Payments) from component sub-indices, latest quarter on corresponding quarter of previous year
Image .csv .xls5. Net acquisitions
What is the net acquisitions approach?
The net acquisitions approach – OOH(NA) – theoretically treats a home as the purchase of a good that is part asset (the land) and part consumable (the house) and excludes the land component from the index. OOH(NA) also includes costs associated with buying and maintaining a house; for example, self-builds and renovations, repairs and maintenance, transfer costs and dwelling insurance. The “net” principle in net acquisitions relates to the fact that only transactions that occur between the OOH sector and other sectors (for example, construction firms and private landlords) should be included.
In practice, while the measure presented here is the best measure of the net acquisitions approach that we can currently produce, the lack of available source data means that some components are not recorded fully. For instance, because of the lack of available data, the methodology used does not separate between the land and house price, and therefore there will be some measure of asset price included in the example. We therefore advise that OOH(NA) should be used and referred to with caution, and it is consequently not our favoured approach of measuring OOH in CPIH. As with the OOH(Payments) approach, it is an experimental index and we will continue to work on improving the methodology and data sources used in the index. For more information on the methodology used to construct OOH(NA), please see Annex 1B.
A small error was detected in the release of Quarter 2 (Apr to June) 2016 Owner occupiers' housing costs using the net acquisitions approach data on 23 September 2016. In this release, the indices were calculated using the new House Price Index (HPI). However, the expenditure data used to weight the indices had not been uprated with the indices created using the new HPI. This has now been corrected for this release and a revised historical series alongside an updated contributions chart is available in the dataset presented alongside this release.
Latest figure and long-term trend
The net acquisitions approach – OOH(NA) – grew by 2.1% in Quarter 3 (July to Sept) 2016 compared with Quarter 3 2015. This is lower than the 3.4% growth rate for Quarter 2 2016 but is still in line with historical trends (Figure 3).
Figure 4 shows the contributions to quarter on corresponding quarter of previous year growth rate for OOH(NA). While new dwellings continued to be the main driver of the increase in OOH(NA), its contributions to the growth rate have halved since Quarter 2. The input data for the new dwellings series is the HPI, which has seen a fall in the 12-month growth rate since July 2016. This demonstrates one of the main limitations of the current method of measuring net acquisitions, which is that movements in the asset price are not excluded from the index and can therefore influence some of the main trends shown in the data.
For a longer time series of contributions, please see the dataset presented alongside this release.
Figure 3: OOH(NA) growth rate, quarter on corresponding quarter of previous year
UK, Quarter 1 (Jan to Mar) 2006 to Quarter 3 (July to Sept) 2016
Source: Office for National Statistics
Notes:
- Q1 refers to Quarter 1 (Jan to Mar); Q2 refers to Quarter 2 (Apr to June); Q3 refers to Quarter 3 (July to Sept); and Q4 refers to Quarter 4 (Oct to Dec).
Download this chart Figure 3: OOH(NA) growth rate, quarter on corresponding quarter of previous year
Image .csv .xls
Figure 4: Contributions to percentage change in OOH(NA) from component sub-indices, latest quarter on corresponding quarter of previous year
UK, Quarter 3 (July to Sept) 2016
Source: Office for National Statistics
Notes:
- Contributions may not sum due to rounding. New dwellings includes acquisition of new dwellings and self-builds and renovations.
- Q1 refers to Quarter 1 (Jan to Mar); Q2 refers to Quarter 2 (Apr to June); Q3 refers to Quarter 3 (July to Sept); and Q4 refers to Quarter 4 (Oct to Dec).
Download this chart Figure 4: Contributions to percentage change in OOH(NA) from component sub-indices, latest quarter on corresponding quarter of previous year
Image .csv .xls6. Rental equivalence
What is the rental equivalence approach?
The final section presents the rental equivalence approach to measuring owner occupiers’ housing costs – OOH(RE), which targets the measurement of ongoing consumption of OOH services, rather than when OOH is acquired or when it is paid for. As the principle behind CPIH is to measure the average change in the prices of goods and services brought for the purpose of consumption by households, the appropriate measure of OOH in CPIH is rental equivalence, which captures the ongoing consumption of OOH services. This is because the other approaches include either a measure of interest rates, or some measure of the capital element of housing, which make them unsuitable for a price index that measures the changing cost of consumption. The approach is also based on a higher quality data source than the other approaches presented in this article, allowing for a more reliable estimate of the measure. For more information about why the rental equivalence is used in CPIH, please see the CPIH compendium.
Latest figure and long-term trend
OOH(RE) grew by 2.4% in September 2016 compared with September 2015 (Figure 5). This continued the upward trend in 12-month growth rate of OOH(RE) seen since the end of 2015 and began to reach similar levels of growth seen prior to the economic downturn in 2008. On a quarterly basis for consistency with OOH(Payments) and OOH(NA), OOH(RE) grew by 2.4% in Quarter 3 (July to Sept) 2016 compared with the corresponding quarter of the previous year, up from 2.3% in Quarter 2 (Apr to June) 2016.
Figure 5: 12-month growth rate of OOH(RE)
UK, Jan 2006 to Sept 2016
Source: Office for National Statistics
Notes:
- Q1 refers to Quarter 1 (Jan to Mar); Q2 refers to Quarter 2 (Apr to June); Q3 refers to Quarter 3 (July to Sept); and Q4 refers to Quarter 4 (Oct to Dec).
Download this chart Figure 5: 12-month growth rate of OOH(RE)
Image .csv .xls7. Comparing the different approaches of measuring owner occupiers’ housing costs
Although there is not a single defined measure of OOH, and each of the methods discussed prior measure different aspects of OOH, it is still useful to look at the 3 measures together to see how they differ over time.
The cumulative measure of all 3 approaches is presented in Figure 6. It suggests that since 2005, OOH(NA) has shown the strongest growth over the period. OOH(Payments) saw strong growth prior to the economic downturn due to the large positive contributions from the growth in mortgage interest payments (Figure 6). Of the 3 measures, it has also seen the largest fall since the economic downturn, again driven by the falling price of mortgage interest payments and has still not recovered its pre-downturn peak.
OOH(RE) appears at a lag to the OOH(NA) and OOH(Payments) approaches for the peak and trough before and after the economic downturn. This lag is because OOH(RE) is a “stock” measure of rents. This means that it captures price information for the entire stock of rental properties, which includes existing contracted properties and properties that are new to the market. Therefore, the flow of new rents based on recent developments in house prices will only gradually influence its development because the stock of existing dwellings is so much larger. This also means that the relative peaks and troughs of OOH(RE) will be subdued relative to OOH(NA) because the large stock of contracted rental properties is likely to mute the impact of volatile house prices.
Figure 6: OOH(RE), OOH(NA) and OOH(Payments) indices, 2005 = 100
UK, Quarter 1 (Jan to Mar) 2005 to Quarter 3 (July to Sept) 2016

Source: Office for National Statistics
Notes:
Q1 refers to Quarter 1 (Jan to Mar); Q2 refers to Quarter 2 (Apr to June); Q3 refers to Quarter 3 (July to Sept); and Q4 refers to Quarter 4 (Oct to Dec).
Download this image Figure 6: OOH(RE), OOH(NA) and OOH(Payments) indices, 2005 = 100
.png (12.9 kB) .xls (34.3 kB)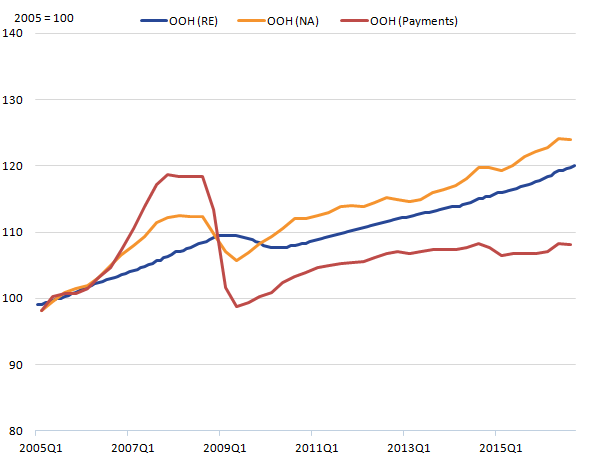
The lag for OOH(RE) is not a disadvantage to using the rental equivalence approach in the calculation of the owner occupier’s housing costs component in CPIH. This is because the rental equivalence approach aims to measure the housing services that are consumed each period (consistent with the principles that underlie the construction of CPIH) and therefore does not need to follow the trend of house prices. If consideration is required of house prices, the HPI should be used instead.
Nôl i'r tabl cynnwys8. Spotlight: Owner occupiers' housing costs in the RPI
Following user requests, this spotlight looks at the measure of owner occupiers’ housing costs (OOH) that is included in the RPI and compares this with the other 3 approaches.
The Retail Prices Index (RPI) is a legacy index that no longer holds National Statistic status because of a number of factors that make it unfit for use as a measure of consumer prices inflation. For example, these include the use of the Carli formula and the treatment of owner occupiers’ housing costs (OOH). In 2015, the Johnson Review recommended that:
“ONS and the UK Statistics Authority should re-state its position that the RPI is a flawed statistical measure of inflation which should not be used for new purposes and whose use should be discontinued for all purposes unless there are contractual commitments at stake”.
Following a public consultation, the National Statistician wrote to Sir Andrew Dilnot, Chair of the UK Statistics Authority, stating that:
“RPI is not a good measure of inflation and does not realistically have the potential to become one… from the start of 2017, ONS would publish the minimum of RPI-related data necessary to ensure the critical and essential needs of existing users are met”.
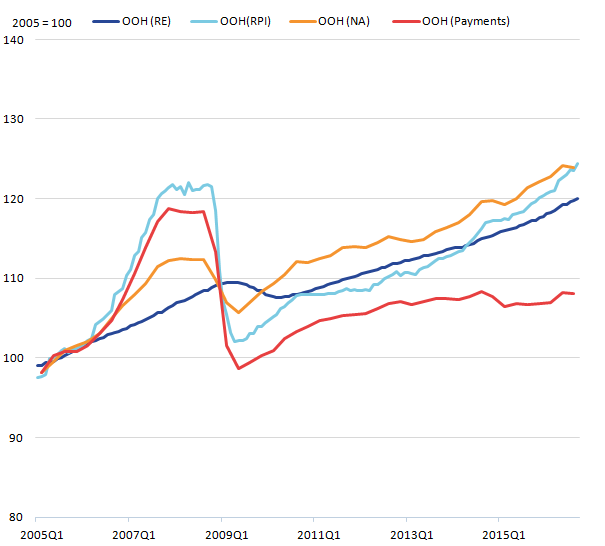
The RPI is intended to follow an accounting approach to estimating OOH on a user costs basis similar to the rental equivalence approach (that is, it aims to measure the cost of using housing services). In theory, the full user cost model includes mortgage interest paid, opportunity cost of capital used, depreciation, running costs minus the capital gain. In practice, some of these elements are not directly observable and most countries that apply the user cost approach adapt this model in some way. The RPI can be thought of as following a user cost model, with opportunity costs and capital gains excluded. This is approach taken by the RPI Advisory Committee when they reviewed the treatment of housing costs in the RPI in 1994.
However, the RPI approach is sometimes described as following a pseudo-payments approach due to the similarities between the 2 indices. Nonetheless, there are a number of differences between the RPI measure and the payments approach that has been calculated in this article, which is more in line with a true payments approach.
For instance, one of the problems for the payments approach is to account for major repairs and maintenance, which are difficult to obtain prices for on a consistent basis. One method of dealing with this problem is the approach taken in the RPI (which takes it closer to a user cost approach), which includes a component for the depreciation of the property. The approach was characterised as estimating the amount of money households should put aside for necessary major repairs and updating in order to maintain the value of the property. In the RPI, this is proxied by including a direct measure of house prices for the depreciation component. This means that there will be some measure of asset price included in the index, making it unsuitable as a measure of the cost of consumption. The use of mortgage interest payments as another sub-component also makes it unsuitable as a measure of consumer inflation. This is because interest payments represent the cost of borrowing money rather than the cost of consumption, and therefore it is not our favoured approach to measure OOH costs this way in a consumer prices index.
Table 1 presents the weights for a sub aggregate of the RPI Housing components excluding Rents. Mortgage Interest Payments (MIPs), Council Tax and Depreciation account for over half the total expenditure on OOH(RPI). In particular, in recent years Depreciation accounts for over 40% of expenditure on OOH(RPI), showing the impact of including a direct measure of house prices in the index.
Table 1: Weights of sub-components and total OOH in RPI, 2005 to 2016
| % | Weights out of 1000 | ||||||||||
| Year | Council Tax and Rates | Depreciation | Do it yourself materials | Dwelling Insurance and ground rent | Mortgage interest payments | Repairs and maintenance charges | Water and other charges | OOH(RPI) | |||
| 2005 | 21.4 | 26.9 | 7.7 | 3.8 | 27.5 | 6.6 | 6 | 182 | |||
| 2006 | 22 | 24.9 | 7.3 | 4 | 28.2 | 6.8 | 6.8 | 177 | |||
| 2007 | 21.6 | 27 | 4.9 | 3.8 | 29.7 | 6.5 | 6.5 | 185 | |||
| 2008 | 20 | 28.2 | 4.6 | 4.1 | 30.8 | 6.2 | 6.2 | 195 | |||
| 2009 | 23 | 28.7 | 5.2 | 4.6 | 23.6 | 6.9 | 8 | 174 | |||
| 2010 | 23.2 | 32.7 | 4.8 | 4.2 | 20.2 | 7.1 | 7.7 | 168 | |||
| 2011 | 24.2 | 32.7 | 5.5 | 4.2 | 19.4 | 6.1 | 7.9 | 165 | |||
| 2012 | 25.3 | 34.6 | 4.9 | 3.7 | 17.9 | 5.6 | 8 | 162 | |||
| 2013 | 25.6 | 34.5 | 4.2 | 4.2 | 17.3 | 6 | 8.3 | 168 | |||
| 2014 | 25.3 | 34.9 | 3.6 | 3.6 | 18.1 | 6 | 8.4 | 166 | |||
| 2015 | 22.3 | 40.8 | 4.5 | 3.4 | 16.2 | 5 | 7.8 | 179 | |||
| 2016 | 21.9 | 43.7 | 3.8 | 3.3 | 15.3 | 4.9 | 7.1 | 183 | |||
| Source: Office for National Statistics | |||||||||||
Download this table Table 1: Weights of sub-components and total OOH in RPI, 2005 to 2016
.xls (28.7 kB)Figure 7 presents the OOH(RPI) approach alongside the other approaches to measuring OOH discussed in this article. The OOH(RPI) saw the highest growth over the period before the economic downturn, mirroring the growth seen in OOH(Payments). Following the fall in OOH(RPI) caused by the reduction in the Bank of England base rate, and the impact that had on the price of mortgage interest payments, the index began to rise again. This time it mirrored the trend in the OOH(NA) approach, which also includes a direct measure of house prices. This demonstrates one of the main limitations for both the OOH(RPI) and OOH(NA) approaches, which is that movements in the asset price are not excluded from the index and can therefore influence some of the main trends shown in the data.
Figure 7: OOH(RE), OOH(NA), OOH(Payments) and OOH(RPI) indices, 2005 = 100
UK, Quarter 1 (Jan to Mar) 2005 to Quarter 3 (July to Sept) 2016
Source: Office for National Statistics
Notes:
Q1 refers to Quarter 1 (Jan to Mar); Q2 refers to Quarter 2 (Apr to June); Q3 refers to Quarter 3 (July to Sept); and Q4 refers to Quarter 4 (Oct to Dec).