Cynnwys
- Summary
- Introduction
- Different approaches of measuring owner occupiers’ housing costs
- The payments approach
- The net acquisitions approach
- The rental equivalence approach
- Comparing the different approaches of measuring owner occupiers’ housing costs
- Spotlight: the relationship between private rents and house prices
- Annex 1A: Payments methodology
- Annex 1B: Net acquisitions methodology
- Annex 1C: Rental equivalence methodology
1. Summary
This is the first release of a new quarterly bulletin that aims to provide more information about the different approaches to measuring owner occupiers’ housing costs.
There are 3 different approaches that measure different aspects of owner occupiers’ housing costs: the rental equivalence approach, the net acquisitions approach and the payments approach.
Nôl i'r tabl cynnwys2. Introduction
The Consumer Prices Index including Housing costs (CPIH) is identical to the UK’s headline measure of consumer price inflation, the Consumer Prices Index (CPI), with the additional inclusion of a measure of owner occupiers’ housing costs (OOH).
OOH are the costs of housing services associated with owning, maintaining and living in one’s own home. This is distinct from the cost of purchasing a house. A consumer price index aims to measure consumption, whereas the purchase of a house is the purchase of an asset that is not consumed in the same way as other items. OOH costs are therefore challenging to measure. There is not a single defined measure of OOH because they can be calculated differently depending on what the target is. In particular, should it be measured at the point of acquisition of the housing service, the point of use, or the point at which it is paid for? Each of these 3 approaches has its own specific methodological strengths and weaknesses and is measured using different methods. Determining which approach is most suitable for a given purpose and how best to measure it, is one of the most contentious issues in the field of inflation measurement. The reasons for this stem from both methodological and practical considerations.
This article is the first in a series that aims to provide more information about the different approaches to measuring OOH to aid your understanding of the differences in concept and underlying methodology. It will be updated on a quarterly basis to evaluate the performance of the different measures over time, in prevailing economic conditions. It will also include a new “spotlight” section each quarter that focuses on a particular topic relevant to the measurement of OOH. The first spotlight will look at the relationship between private rents and house prices. We invite you to submit ideas for future spotlights to cpi@ons.gov.uk.
As this is the first publication of this release, the focus will be more on the trends seen across the entire time period (2005 to 2016). It will therefore be a longer article than future releases, which will instead focus more on recent data.
For more information on the CPIH, please see the CPIH compendium.
Nôl i'r tabl cynnwys3. Different approaches of measuring owner occupiers’ housing costs
In constructing a measure of inflation, a decision must be made on the point at which to observe price change. There are 3 choices:
the point of acquisition of a good or service
the point at which it is used
the point at which it is paid for
For most goods and services, this makes little to no difference. For example, an apple would generally be acquired, paid for and used (eaten) in the same period (month). For a number of goods and services, it could make some difference. These differences are at their largest when considering owner occupiers’ housing costs (OOH). Owner occupiers’ housing is acquired at a single point, used for many years and can be paid for (for example, through a mortgage) over much of a lifetime. Statisticians and economists have developed theoretical methods to measure OOH from each of these perspectives; each method is summarised in Table 1.
Table 1: Methods used to calculate the different approaches of measuring owner occupiers’ housing costs
| Method | Target | Approach | Description |
| Payments | The payments relating to the ownership of owners occupiers’ housing | Payments | Directly measures what households pay as owner occupiers when consuming housing. Includes mortgage interest payments, transaction costs and running costs. |
| Net acquisitions | The cost of acquiring and maintaining owners occupiers’ housing | Acquisitions | Treats a house as the purchase of a good that is part asset (the land) and part consumable (the house). Includes costs associated with buying and maintaining a house, for example major repairs, transfer costs and dwellings insurance. |
| Rental equivalence | The ongoing consumption of owners occupiers’ housing services | User costs | Assumes a dwelling is a capital good and therefore not consumed, but instead provides a flow of services that are consumed each period. Rental equivalence imputes owner occupiers’ housing costs from the rents paid for equivalent rented properties. |
| Narrow user costs | The ongoing consumption of owners occupiers’ housing services | User costs | Assumes that a dwelling is a capital good and therefore not consumed, but instead provides a flow of services that are consumed each period. Estimates are made for each of the individual elements of the costs of the services. These include the opportunity cost to the owner occupier of having money tied up in their dwelling rather than being used for some other purpose, plus depreciation and recurring costs such as maintenance. |
| Notes: | |||
| 1. There are 2 use-based approaches, rental equivalence and narrow user costs. While they both measure OOH at the point of consumption, these 2 approaches can also give different results, particularly in the short-term. | |||
Download this table Table 1: Methods used to calculate the different approaches of measuring owner occupiers’ housing costs
.xls (28.2 kB)This article presents a comparison of the rental equivalence, net acquisitions and the payments approach to calculating OOH. The narrow user cost method has not been developed because of the subjectivity involved in selecting the methodology for determining the real rate of interest, an important component in calculating the opportunity cost of home ownership. Both the net acquisitions approach and the payments approach are produced on an experimental basis.
Overview of the payments approach
The first measure discussed here is a payments approach to calculating owner occupiers housing costs – OOH(Payments). It is presented in this article as a comparison tool against the other approaches, but it has not been published previously. While the approach used to measure owner occupiers’ housing costs in the RPI is sometimes described as a payments approach, this is not strictly true as it includes a measure of depreciation and doesn’t include stamp duty as a transaction cost.
For the purposes of this article, the payments approach is aggregated together using the relevant components from RPI (including mortgage interest payments, transactions costs and running costs) in addition to indices that capture changes in payments of Stamp Duty and major repairs and maintenance. For more information about the methodology used to calculate the payments approach, please see Annex 1A for a summary.
Overview of the net acquisitions approach
Eurostat is currently exploring different ways of measuring owner occupiers’ housing costs for the European-wide Harmonised Index of Consumer Prices (HICP). As part of this development work, the Office for National Statistics (ONS) is required by European regulations to produce an index using the net acquisitions approach – OOH(NA). The net acquisitions approach is preferred by Eurostat because it is the best measure to use to produce a consistent measure across all European countries. This is because the housing market is different across different countries: for example, in many countries there is no rental market, which means that the rental equivalence approach cannot be used. Moreover, the rental equivalence approach is not necessarily in line with HICP regulations, which forbids the use of imputation1.
However, there are still a number of limitations with the net acquisitions approach. For instance, because of lack of available data in most European countries (including the UK), the methodology proposed does not separate between the land and house price, and therefore there will be some measure of asset price included in the index. This means it is not suitable as a measure of the cost of consumption. In addition, there is currently no available weighting information for one of the sub-components of the index and therefore a zero weight is applied. In summary, while this is the best measure of the net acquisitions approach that we can currently produce, this lack of available source data affects the reliability of the approach and it therefore should be treated with caution.
The net acquisitions approach presented here is consistent with the measure that we currently produce for Eurostat, which can be found on our website. For more information about the methodology used to calculate the net acquisitions approach, please see Annex 1B for a summary, or the full methodology article for more information.
Overview of the rental equivalence approach
The final approach presented here, the rental equivalence approach – OOH(RE) – is consistent with the measure of owner occupiers’ housing costs (OOH) used in the CPIH. As the principle behind CPIH is to measure the average change in the prices of goods and services bought for the purpose of consumption by households, the appropriate measure of OOH in CPIH is rental equivalence, which captures the ongoing consumption of owner occupiers’ housing services. This is because the other approaches include either a measure of interest rates, or some measure of the capital element of housing, which make them unsuitable for a price index that measures the changing cost of consumption. The approach is also based on a higher quality data source than the other approaches presented in this article, allowing for a more reliable estimate of the measure.
For more information about why the rental equivalence is used in CPIH, please see the CPIH compendium. The compendium also contains further information about the methodology used to calculate the rental equivalence approach, or please see Annex 1C for a summary.
Notes for Different approaches of measuring owner occupiers’ housing costs:
- Please see Section 1.2.3 in the CPIH Compendium for more information.
4. The payments approach
The payments approach aims to measure the payments related to the ownership of owner occupiers’ housing costs (OOH). This means that all payments that households make as owner occupiers when consuming housing should be included, such as mortgage interest payments, transaction costs such as estate agency fees and legal fees, and running costs such as repairs and maintenance, ground rent and dwelling insurance. As interest payments represent the cost of borrowing money rather than the cost of consumption, it would be inappropriate to measure OOH costs this way in CPIH. OOH(Payments) is an experimental series and we therefore advise using it with some caution. For more information on the methodology used to construct the OOH(Payments) approach, please see Annex 1A.
Figure 1 presents the contributions to the quarterly growth rate of OOH(Payments) from the sub-indices used in its construction. Looking at contributions to growth is helpful to provide insight into the main drivers behind the year-on-year changes in the series.
For the payments approach, it is the sub-index for mortgage interest payments that appears to have the highest impact on the aggregate series. Prior to the economic downturn in 2008, mortgage interest payments contributed positively to the growth of OOH(Payments), which peaked in Quarter 3 (July to Sept) 2007. This can be explained by a growth in the Bank of England base rate from 3.5% in July 2003 to 5.75% in July 2007. As the economic downturn took hold and the Bank responded to the financial market shock, the base rate fell to a historic low of 0.5% in March 2009. The corresponding decline can be seen in the negative contributions from mortgage interest payments, which drive the fall in the OOH(Payments) annual growth rate in 2009.
Since the beginning of 2010, OOH(Payments) have seen less volatile growth, largely due to the unchanged base rate set by the Bank. The reduction in Stamp Duty rates in December 2014 led to a fall in the overall OOH(Payments) approach in 2015.
In Quarter 2 (Apr to June) 2016, OOH(Payments) grew by 1.3% compared with Quarter 2 2015.
Figure 1: Contributions to percentage change in OOH(Payments) from component sub-indices, latest quarter on corresponding quarter of previous year
UK, Quarter 1 (Jan to Mar) 2006 to Quarter 2 (Apr to June) 2016
Source: Office for National Statistics
Notes:
- Contributions may not sum due to rounding. Council tax includes council tax in Great Britain and Northern Ireland rates. Other includes dwelling insurance, ground rent, estate agent fees, home buyers survey and house conveyancing.
Download this chart Figure 1: Contributions to percentage change in OOH(Payments) from component sub-indices, latest quarter on corresponding quarter of previous year
Image .csv .xls5. The net acquisitions approach
The net acquisitions approach – OOH(NA) – theoretically treats a home as the purchase of a good that is part asset (the land) and part consumable (the house) and excludes the land component from the index. OOH(NA) should also include costs associated with buying and maintaining a house; for example, self-builds and renovations, repairs and maintenance, transfer costs and dwelling insurance. As discussed in section 3, while the measure presented here is the best measure of the net acquisitions approach that we can currently produce, the lack of available source data means that some components are not recorded fully and some measure of asset price will be included in the index. We therefore advise that OOH(NA) should be used and referred to with caution, and is therefore not suitable for purpose in CPIH. For more information on the methodology used to construct OOH(NA), please see Annex 1B.
Figure 2 presents the contributions to the quarterly growth rate of OOH(NA) from the sub-indices used in its construction. New dwellings, other services related to the acquisition of dwellings, and major repair and maintenance explain most of the changes in the 12-month OOH(NA) price growth. The strong growth in the period leading up to the start of the economic downturn in 2008 is mainly driven by increases in the prices of new dwellings and other services related to the acquisition of dwellings. The input data for the new dwellings series is the ONS House Price Index (HPI), which saw strong growth in house prices leading up to the start of the economic downturn. This demonstrates one of the main limitations of the current method of measuring net acquisitions, which is that movements in the asset price are not excluded from the index and can therefore influence some of the main trends shown in the data.
Figure 2: Contributions to percentage change in OOH(NA) from component sub-indices, latest quarter on corresponding quarter of previous year
UK, Quarter 1 (Jan to Mar) 2006 to Quarter 2 (Apr to June) 2016
Source: Office for National Statistics
Notes:
- Contributions may not sum due to rounding. New dwellings includes acquisition of new dwellings and self builds and renovations.
Download this chart Figure 2: Contributions to percentage change in OOH(NA) from component sub-indices, latest quarter on corresponding quarter of previous year
Image .csv .xlsNew dwellings had a relatively strong negative contribution between Quarter 4 (Oct to Dec) 2008 and Quarter 4 2009 mirrored by the other services related to the acquisition of dwellings. This was likely caused by shrinking demand for housing caused by the economic downturn which in turn affected both house prices and transfer costs.
In the period following the recovery, growth in OOH(NA) was again driven by new dwellings and other services related to the acquisition of dwellings. House prices fell again in the period 2010 to 2013, corresponding to the second dip in the series. Movements in asset prices are therefore an important driver of trends in the OOH(NA) series, which can be further demonstrated by the close relationship between the HPI and OOH(NA) index shown in Figure 3.
In Quarter 2 (Apr to June) 2016, OOH(NA) grew by 3.4% compared with Quarter 2 2015.
Figure 3: HPI and OOH(NA) indices, Index 2005 = 100
UK, Quarter 1 (Jan to Mar) 2005 to Quarter 2 (Apr to June) 2016

Source: Office for National Statistics
Download this image Figure 3: HPI and OOH(NA) indices, Index 2005 = 100
.png (19.8 kB) .xls (963.1 kB)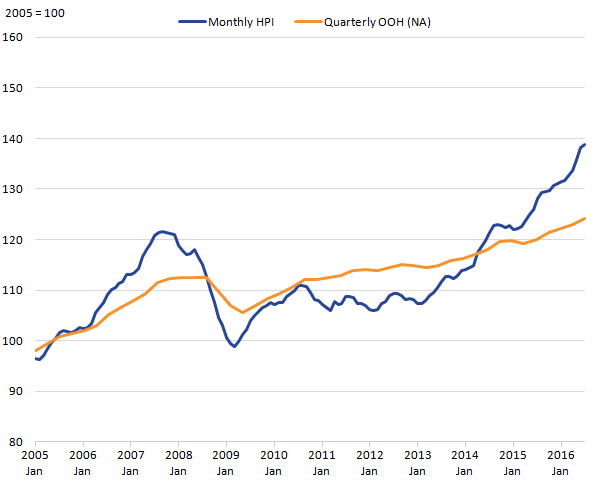
6. The rental equivalence approach
This section presents the rental equivalence approach to measuring owner occupiers’ housing costs OOH(RE) which targets the measurement of ongoing consumption of owner occupiers’ housing services, rather than when they are acquired or when they are paid for. Because of the methodology used to calculate the rental equivalence approach, it is not possible to present a contributions chart for this approach. This is mainly due to the fact that OOH(RE) is not constructed using a set of sub-indices that measure different concepts (maintenance costs, stamp duty and so on), but instead is aggregated from indices measuring the same concept across regions. However, we can still compare movements in OOH(RE) over time on a monthly basis. Figure 4 shows that in June 2016, OOH(RE) grew by 2.3% compared with the same period a year ago.
Figure 4: 12-month growth rate of OOH(RE)
UK, June 2006 to June 2016
Source: Office for National Statistics
Download this chart Figure 4: 12-month growth rate of OOH(RE)
Image .csv .xlsOOH(RE) grew at a steady rate up until the end of 2009. Following the economic downturn, prices then fell sharply reaching a minimum of negative 1.8% for the 12 month growth rate in April 2010. OOH(RE) then recovered, although growth remained below that experienced in the period prior to the downturn. Prices then began to rise again towards the end of 2014 and have continued on an upward trend in recent months.
Nôl i'r tabl cynnwys7. Comparing the different approaches of measuring owner occupiers’ housing costs
Although there is not a single defined measure of owner occupiers’ housing costs (OOH) and each of the methods discussed prior measure different aspects of OOH, it is still useful to look at the 3 measures together to see how they differ over time.
The cumulative measure of all 3 approaches is presented in Figure 5. It suggests that since 2005, OOH(NA) has shown the strongest growth over the period. OOH(Payments) saw strong growth prior to the economic downturn due to the large positive contributions from the growth in mortgage interest payments (Figure 1). Of the 3 measures, it has also seen the largest fall since the economic downturn, again driven by the falling price of mortgage interest payments and has still not recovered its pre-downturn peak.
OOH(RE) appears at a lag to the OOH(NA) and OOH(Payments) approaches for the peak and trough before and after the economic downturn. This lag is because OOH(RE) is a “stock” measure of rents. This means that it captures price information for the entire stock of rental properties, which includes existing contracted properties and properties that are new to the market. Therefore, the flow of new rents based on recent developments in house prices will only gradually influence its development because the stock of existing dwellings is so much larger. This also means that the relative peaks and troughs of OOH(RE) will be subdued relative to OOH(NA) because the large stock of contracted rental properties is likely to mute the impact of volatile house prices.
Figure 5: OOH(RE), OOH(NA) and OOH(Payments) indices, 2005 = 100
UK, Quarter 1 (Jan to Mar) 2005 to Quarter 2 (Apr to June) 2016

Source: Office for National Statistics
Download this image Figure 5: OOH(RE), OOH(NA) and OOH(Payments) indices, 2005 = 100
.png (13.0 kB) .xls (26.6 kB)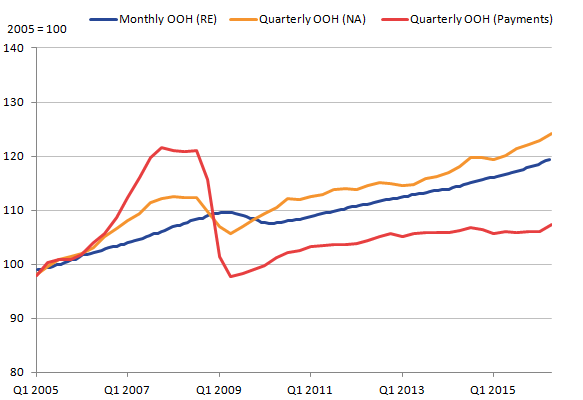
The lag for OOH(RE) is not a disadvantage to using the rental equivalence approach in the calculation of the owner occupiers’ housing costs component in CPIH. This is because the rental equivalence approach aims to measure the flow of housing services that are consumed each period (consistent with the principles that underlie the construction of CPIH) and therefore does not need to follow the trend of house prices. If consideration is required of house prices, the HPI should be used instead.
Nôl i'r tabl cynnwys8. Spotlight: the relationship between private rents and house prices
The rental equivalence approach measures the ongoing consumption of owner occupiers’ housing in CPIH. It uses rental prices as a proxy for the costs of housing services. The rental equivalence approach therefore answers the question: “how much would I have to pay in rent to live in a home like mine?” for an owner occupier. In other words, we value housing services by looking at the cost of the next best alternative to home ownership, namely renting a property: “if I did not own a home, I would need to rent one”.
Therefore, as the approach aims to measure the cost of housing services rather the asset value of the house, it should not be expected to move in line with house prices in the short-term.
However, intuitively, changes in house prices can be thought of as an important influence for private rental prices over a longer period of time. It may therefore be reasonable to expect a longer-term relationship between movements in rents (which feed through into the rental equivalence approach) and house prices. This spotlight therefore meets the user demand for some analysis that looks to investigate this assumption.
This spotlight will first look at the theory concerning the relationship between house prices and rents, before looking at some empirical evidence. This evidence stems from comparing the ONS Index of Private Housing Rental Prices (IPHRP) data and the House Price Index (HPI). The IPHRP measures the change in the price of renting residential property from private landlords. The index measures both the change in price of newly advertised rental prices and the price changes experienced by existing tenancies. The IPHRP uses the same source data as the rental equivalence approach but it is weighted differently to account for the different mix of properties found in the rental and owner occupied sectors. For more information on how the IPHRP and the rental equivalence approach are constructed from the same source data, please see the CPIH Compendium.
In economic theory, the value of an asset (in this case, the house price) moves in line with the value of the revenue it generates (in this case, the rents that can be charged to others using the property). However, in the short-term, the relationship between house prices and rents could depend on other, external, factors. For example, rent for a property is likely to be higher in relation to the house price when the interest rate is higher. This is because it becomes more costly to own a house (for example, because of the increase in mortgage interest payments) and therefore demand for renting will increase. This may cause the house price and rental income from a property to move in different directions in the short-term.
Given this discussion, it seems reasonable to expect there to be a relationship between indicators of rental prices and house prices in the long-term. Stronger (weaker) house prices are likely to raise (lower) the costs of capital for landlords and all else being equal they should feed into higher (lower) rents.
Figure 6 presents the HPI and IPHRP series for England indexed to January 2005 and confirms that there is a broad, positive association between these series. While the IPHRP series does not show the same degree of price change as the HPI, it moves in broadly the same direction as the house price series, although with a noticeable lag.
Figure 6: HPI and IPHRP indices, 2005 = 100
England, January 2005 to July 2016
Source: Office for National Statistics
Download this chart Figure 6: HPI and IPHRP indices, 2005 = 100
Image .csv .xlsThis lag in the rental price series is examined in more detail in Figure 7, which plots the growth of house prices (left-hand axis) and rents (right-hand axis) in England since January 2006.
Figure 7: 12-month growth rate of HPI and IPHRP
England, January 2005 to July 2016
Source: Office for National Statistics
Download this chart Figure 7: 12-month growth rate of HPI and IPHRP
Image .csv .xlsThe lag in rental prices is because of the fact that the IPHRP is a “stock” measure of rents. This means that it captures price information for the entire stock of rental properties, which includes existing properties and properties that are new to the market. Therefore, the flow of new rents based on recent developments in house prices will only gradually influence its development because the stock of existing dwellings is so much larger. The HPI, by contrast, is a “flow” measure, capturing only the part of the housing market that is changing as newly marketed properties are bought and sold. For this reason, we would expect the HPI series to adjust more quickly to changes in the wider housing market than the IPHRP series.
In summary, the preceding discussion and analysis suggests that it is reasonable to expect there to be a relationship between house prices and private rents in the long-term. However, there can be short-term divergences between the 2 series which can occur due to a wide range of different factors.
These short-term fluctuations and the observed lag in rental prices do not have any implications for the use of the rental equivalence approach in measuring owner occupiers’ housing costs in CPIH. As discussed at the beginning of this spotlight, the rental equivalence approach measures the ongoing consumption of owner occupied housing services and therefore does not need to follow the trend of house prices because that is not what it is intended to measure.
Nôl i'r tabl cynnwys