1. Introduction
The Services Producer Price Index (SPPI), produced by the Office for National Statistics (ONS), provides a measure of inflation for the UK service sector. It is constructed from a statutory quarterly survey which measures the price received for selected services provided by UK businesses to other UK businesses and government. We do not currently produce an SPPI for every industry in the service sector and so the SPPI aggregate is a partial best estimate of the overall inflation to UK businesses from the service sector. This article presents standard errors for quarter-on-quarter and annual growth rates for the SPPI between Quarter 2 (Apr to Jun) 2012 and Quarter 1 (Jan to Mar) 2016. Confidence intervals have been calculated for gross sector output (GSO) growth rates at the highest level SPPI, and for a selection of industries with large standard errors.
Nôl i'r tabl cynnwys2. Standard errors
If the SPPI was based on a census of every business in the UK service sector and every survey was returned correctly and on time, then the true values of price movements would be known. However, since the SPPI is based on a sample of UK businesses, it means that the SPPI is an estimate of the population price movements and is subject to sampling variability. Sampling variability means that if a different set of businesses had been sampled, then a different estimate would have resulted. Exactly how much these would differ, by taking different samples, cannot be measured directly but is approximated using a standard error (calculated as the square root of the variance of the estimate).
Standard errors are used to show the spread of price movements and are one way of assessing the accuracy of a price index. The lower the standard error for a given price index, the more confident one can be that the estimated index is close to the true value for the price index had all UK businesses been included.
Nôl i'r tabl cynnwys3. Confidence intervals
A confidence interval is an estimated range of values which lie around a sample estimate. This range identifies the likely values for the population value, defined by a specified probability. Confidence intervals for this publication are produced at the 95% level. This means that if 100 samples were taken, then the population value would fall between the upper and lower bounds 95 times.
Nôl i'r tabl cynnwys4. Aggregate SPPI
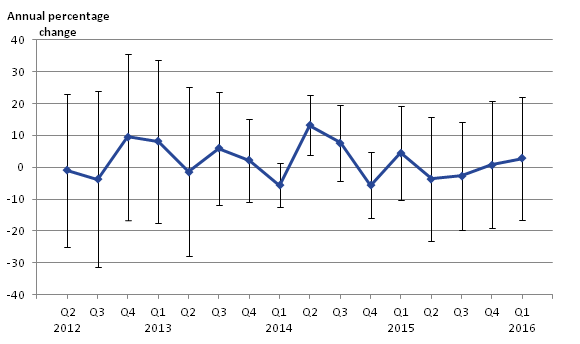
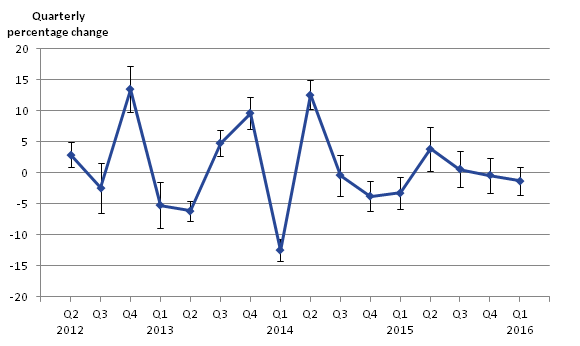
This section includes summary information of the top level SPPI (gross sector output (GSO)) annual and quarterly standard errors for the growth rates. The annual and quarter-on-quarter growth rates with associated 95% confidence intervals are plotted for each period between Quarter 2 2012 and Quarter 1 2016. Table 1 shows the quarterly and annual growth and an estimate of the standard errors for these periods.
Generally, the annual standard errors for each quarter are consistently low in all periods. However, the standard error in the first quarter of 2013 and each period throughout 2014 are larger than all other periods. This is reflected in the confidence intervals which can be seen in Figure 1.
The top level SPPI (GSO) quarterly growth has fairly consistent standard errors for every quarter. This is reflected in the confidence intervals which can be seen in Figure 2.
The median of the annual and quarterly standard errors over the 16-quarter period were found to be 0.21 and 0.20 respectively. These are both fairly low, suggesting that the published growth rates of both the quarter-on-quarter and annual movements are a good estimator of the true population values.
The 5 instances with largest confidence intervals in figure 1 are cases where the independence calculation was applied (see background note 2)
Table 1: Standard errors of the quarterly and annual growth in the aggregate SPPI, UK, Quarter 2 2012 to Quarter 1 2016
| 2010=100, SIC2007 | ||||||||||||
| Percentage change over quarter | Quarter-on-quarter standard error | Percentage change over year | Year-on-year standard error | |||||||||
| 2012 Q2 | 0.5 | 0.1 | 0.8 | 0.2 | ||||||||
| Q3 | 0.2 | 0.2 | 1.5 | 0.2 | ||||||||
| Q4 | 0.4 | 0.2 | 1.5 | 0.1 | ||||||||
| 2013 Q1 | 0.4 | 0.2 | 1.5 | 0.5 | ||||||||
| Q2 | -0.2 | 0.1 | 0.8 | 0.1 | ||||||||
| Q3 | 0.2 | 0.1 | 0.8 | 0.1 | ||||||||
| Q4 | 0.9 | 0.2 | 1.3 | 0.1 | ||||||||
| 2014 Q1 | - | 0.1 | 0.9 | 0.4 | ||||||||
| Q2 | 0.4 | 0.2 | 1.5 | 0.4 | ||||||||
| Q3 | 0.2 | 0.2 | 1.5 | 0.4 | ||||||||
| Q4 | - | 0.2 | 0.6 | 0.4 | ||||||||
| 2015 Q1 | -0.2 | 0.2 | 0.4 | 0.2 | ||||||||
| Q2 | 0.4 | 0.3 | 0.4 | 0.2 | ||||||||
| Q3 | - | 0.2 | 0.2 | 0.2 | ||||||||
| Q4 | 0.5 | 0.2 | 0.7 | 0.3 | ||||||||
| 2016 Q1 | 0.6 | 0.2 | 1.4 | 0.3 | ||||||||
| Source: Office for National Statistics | ||||||||||||
| 1. The aggregate SPPI is an aggregate of the individual industry level SPPIs (excluding Financial intermediation). It does not provide full coverage of the service sector. | ||||||||||||
| 2. The Gross Sector series is calculated using weights based on sales from all transactions in the UK to UK businesses and government. | ||||||||||||
| 3. Not all of the industry-level SPPIs used to construct the aggregate SPPI are National Statistics. | ||||||||||||
| 4. Q1 is Quarter 1 January to March, Q2 Quarter 2 April to June, Q3 Quarter 3 July to September and Q4 Quarter 4 October to December. | ||||||||||||
Download this table Table 1: Standard errors of the quarterly and annual growth in the aggregate SPPI, UK, Quarter 2 2012 to Quarter 1 2016
.xls (29.2 kB)
Figure 1: SPPI all services, gross sector output (GSO) - annual growth (quarter on same quarter previous year) with 95% confidence intervall
UK, Quarter 2 2012 to Quarter 1 2016

Source: Services Producer Price Indices (SPPI) - Office for National Statistics
Download this image Figure 1: SPPI all services, gross sector output (GSO) - annual growth (quarter on same quarter previous year) with 95% confidence intervall
.png (11.8 kB) .xls (48.1 kB)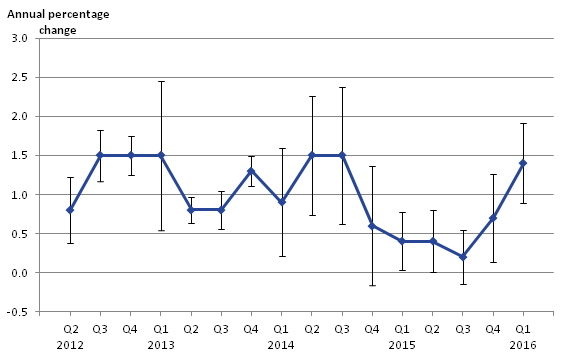
Figure 2: SPPI all services, gross sector output (GSO) - quarterly growth with 95% confidence interval
UK, Quarter 2 2012 to Quarter 1 2016

Source: Services Producer Price Indices (SPPI) - Office for National Statistics
Download this image Figure 2: SPPI all services, gross sector output (GSO) - quarterly growth with 95% confidence interval
.png (13.3 kB) .xls (48.1 kB)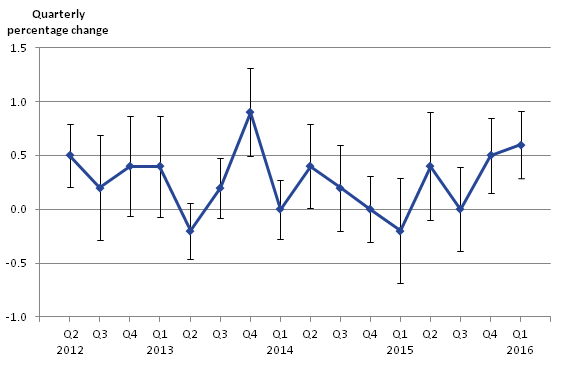
5. Industries with large standard errors
Standard errors for all industries can be found in the Services Producer Prices Index standard errors – Quarter 1 2016 dataset.
Some industries displayed large standard errors for some quarter-on-quarter or annual growth periods. The 95% confidence interval has been calculated for each of these below.
Commercial vehicle ferries
This service industry is currently comprised of 15 service items and as a result the price growth of individual items can be highly influential at the industry level. This introduces the potential for an increased standard error if the growth recorded for an individual item does not match the general trend of the other items.
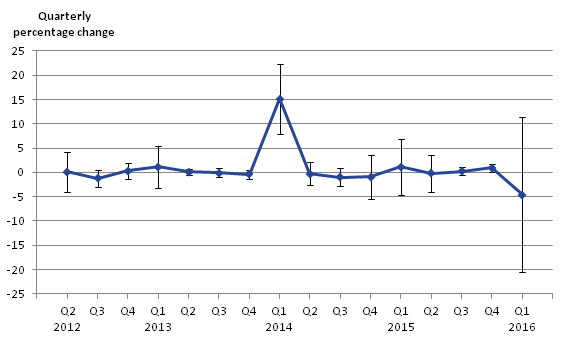
Some companies in this industry review their prices on an annual basis. This is usually captured in the prices taken for the first quarter of each year. The first period each year is most likely to have changing prices which introduces variability into the index.
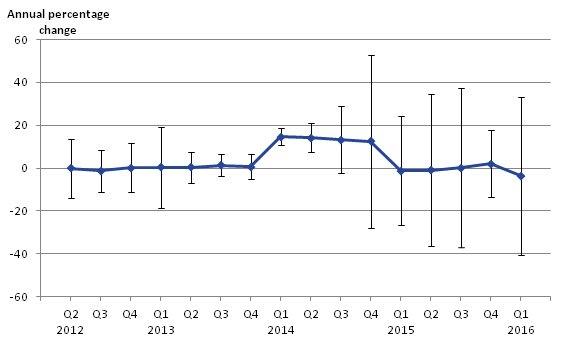
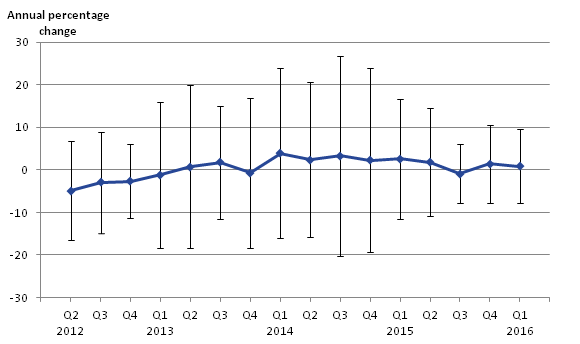
A genuine price increase of one service item between the fourth quarter (Oct to Dec) of 2013 and the first quarter of 2014 is the cause of the visible quarter-on-quarter growth in this industry (see Figure 4). This introduced uncertainty in the growth for that quarter as a majority of other items during this time showed a slight negative growth. As a result, the standard error for the annual growth in subsequent periods increases, with the largest standard error for annual growth of 20.60 occurring in the fourth quarter of 2014. This can be seen in the confidence intervals in Figure 3. The effect of annual price updates in the first quarter each year, which increases the standard errors, can be seen in Figure 4, as the confidence intervals are noticeably larger than in other quarters within the same year.
The median of the annual and quarterly standard errors over the 16-quarter period were found to be 7.52 and 1.08 respectively. The median annual standard error is large and suggests that the published growth rates of annual movements are not a great estimator for the true population values. This is likely an effect of the propagation of the larger standard errors in Quarter 1 and the large quarter-on-quarter growth in the first quarter of 2014. The median quarterly standard error is fairly high, but shows that the growth values for this index are more reliable estimators of the population values.
Figure 3: Commercial vehicle ferries - annual growth (quarter on same quarter previous year) with 95% confidence interval
UK, Quarter 2 2012 to Quarter 1 2016
Source: Services Producer Price Indices (SPPI) - Office for National Statistics
Download this image Figure 3: Commercial vehicle ferries - annual growth (quarter on same quarter previous year) with 95% confidence interval
.png (8.5 kB) .xls (48.1 kB)
Figure 4: Commercial vehicle ferries - quarterly growth with 95% confidence interval
UK, Quarter 2 2012 to Quarter 1 2016
Source: Services Producer Price Indices (SPPI) - Office for National Statistics
Download this image Figure 4: Commercial vehicle ferries - quarterly growth with 95% confidence interval
.png (9.8 kB) .xls (48.6 kB)
Hotels
“Hotels” is known to be quite a volatile price index, with large positive and negative growths quite a common occurrence.
Large standard errors for the annual growth exist for most quarters throughout the period spanning Quarter 2 2012 and Quarter 1 2016, with a median standard error of 9.45. This is large, and suggests that the index for this industry is not a good estimate of the true population values. The confidence intervals in Figure 5 reflect the confidence displayed by these standard errors around the associated annual growth value.
The standard errors for the quarterly growth remain small for each period despite the volatile quarter-on-quarter growth in the industry, with a median standard error of 1.32. This is quite large when compared with the quarterly growth standard error median of other industries, but is not unexpected given the volatility. A median standard error of this size suggests that the quarterly growth is a fairly accurate measure for the true population value. Figure 6 shows the quarterly growth and the confidence intervals around each value.
Figure 5: Hotels (business customers only) - annual growth (quarter on same quarter previous year) with 95% confidence interval
UK, Quarter 2 2012 to Quarter 1 2016
Source: Services Producer Price Indices (SPPI) - Office for National Statistics
Download this image Figure 5: Hotels (business customers only) - annual growth (quarter on same quarter previous year) with 95% confidence interval
.png (12.3 kB) .xls (48.1 kB)
Figure 6: Hotels (business customers only) - quarterly growth with 95% confidence interval
UK, Quarter 2 2012 to Quarter 1 2016
Source: Services Producer Price Indices (SPPI) - Office for National Statistics
Download this image Figure 6: Hotels (business customers only) - quarterly growth with 95% confidence interval
.png (12.9 kB) .xls (47.6 kB)
Advertising services
This industry is a time-based series because prices are set on a contract basis within this industry, which means without using time-based methods, measuring a price for each specific service would be difficult. Therefore a “service price” is generated based on the content of each contract and worked out using the time committed by workers of different grades. This produces a best estimate of the cost of that contract, making different contracts somewhat comparable, but there will still be variability in the prices.
A large standard error around the annual growth exists for most periods in this industry. The median standard error of the annual growth for the period spanning Quarter 2 2012 and Quarter 1 2016 is 6.97. This shows that our sample for this industry is probably not the best measure of the true population movements. The confidence intervals around each growth are displayed in Figure 7.
The 16-quarter-on-quarter median standard error of “advertising services” is 1.29. This suggests that the quarterly growth is a fairly reasonable measure of the true population value. The confidence intervals (see Figure 8) show that a consistent level of accuracy is maintained for each quarter-on-quarter period.
Figure 7: Advertising services - annual growth (quarter on same quarter previous year) with 95% confidence interval
UK, Quarter 2 2012 to Quarter 1 2016
Source: Services Producer Price Indices (SPPI) - Office for National Statistics
Download this image Figure 7: Advertising services - annual growth (quarter on same quarter previous year) with 95% confidence interval
.png (9.5 kB) .xls (48.1 kB)
Figure 8: Advertising services - quarterly growth with 95% confidence interval
UK, Quarter 2 2012 to Quarter 1 2016

Source: Services Producer Price Indices (SPPI) - Office for National Statistics
Download this image Figure 8: Advertising services - quarterly growth with 95% confidence interval
.png (11.6 kB) .xls (48.1 kB)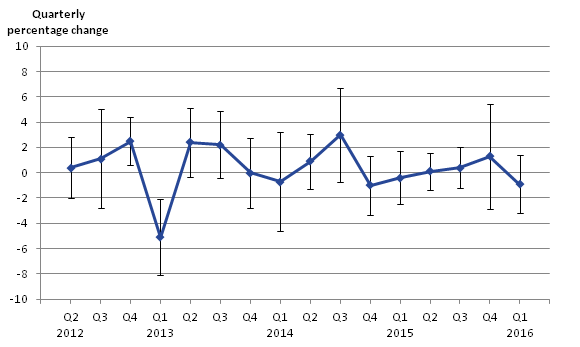
6. Conclusions
The aggregate SPPI is a good measure for the true population values, with a 16-quarter median standard error for the annual and quarter-on-quarter growths of 0.21 and 0.20 respectively.
The industries of “commercial vehicle ferries”, “hotels”, and “advertising services” display standard errors that suggest they are not reliable estimators for the annual growth of the population. These industries however, displayed fairly reasonable standard errors for the quarterly growth, with a median value of 1.08, 1.32, and 1.29 respectively.
Nôl i'r tabl cynnwys