1. Introduction
Broadly speaking, two types of House Price Indices can be distinguished; one that reflects residential properties purchased during a particular period (a flow measure) and one for the stock of residential properties at a particular moment in time. The published UK House Price Index (UK HPI) is an example of a flow-based measure while this article presents preliminary estimates for a stock measure. Calculating a stock-weighted house price can be difficult, as a data source that reflects the stock of all residential properties needs to be available. Analysis presented in this article achieves this using the Valuation Office Agency’s Council Tax valuation list.
Preliminary estimates presented in this article are still in development. We are looking to improve the coverage presented and methodology used in subsequent releases once we have gathered more user feedback.
Nôl i'r tabl cynnwys2. What is a stock-weighted house price index?
The current UK House Price Index (UK HPI) is a measure of the level of house prices based on the flow of sales to private households. This type of house price index represents the type and location of properties that are selling at that point in time. The weights, which represent the types and location of properties that are being purchased, are updated every year based on transactions in the previous year, which are then used to estimate an average house price each period. If an individual is looking to buy or sell a property it is probably this type of measure they would be most interested in as it reflects the types of properties that are selling now.
However, the type and location of houses sold in a particular year may be different to the whole stock of residential properties. While the number of dwellings in the England and Wales housing stock is about 25 million, there are only about 1 million property transactions each year (around 4% of the stock). This is because some properties are more likely to be sold than others, due to factors such as their location or property type. Given this, estimates from a stock-weighted house price index are likely to be different to that of the UK HPI, which is a flow.
Nôl i'r tabl cynnwys3. Methodology
The methodology used in calculating these stock-weighted house price index estimates closely follow the methodology of the UK House Price Index (HPI) where hedonic regression is used to estimate values.
Further information on the hedonic regression method
In a hedonic regression, properties are defined in terms of a set of features or characteristics, each of which contributes to the price paid for a property. For example, the presence of a garden, the number of bedrooms, or the location of the property will all contribute to the amount paid, but none of these features can be priced in isolation.
A regression model is used to estimate the value of each of these features from the set of properties during a particular period. For example, the model might estimate the effect that every additional bedroom and each different location have in the sale price in a certain month. Then, the price of a particular property can be calculated by combining the values assigned to each of its features. This method allows us to estimate the prices of properties with every combination of features (such as number of bedrooms and regions), even if that particular combination did not trade in the period.
A fuller description of this method and other alternative methods for calculating house price indices can be found in the Handbook on Residential Property Price Index.
In the UK HPI the following features (or characteristics) are used as part of this hedonic regression:
- location – the local authority of the property
- property type – detached, semi-detached, terraced or flat
- number of rooms – number of habitable rooms
- floor area – floor area of property in meters squared
- ACORN – a geo-demographic segmentation of residential neighbourhoods in the UK
- property status – whether the property is a new-build or existing property
For the stock-weighted house price index the property status variable was not used, in part due to the proportion of new-builds in the stock of residential properties being very small.
Estimates produced through the hedonic regression are then aggregated using weights. While the UK HPI uses weights based on transactions in the previous year, this stock-weighted house price index uses weights based on the stock of all residential dwellings. In this analysis we define the stock of all residential dwellings as including owner occupier housing, social housing and the private rental sector within England and Wales. The source of this stock data is the Council Tax valuation list maintained by the Valuation Office Agency (VOA).
The VOA has been responsible for banding properties for Council Tax since the tax was first introduced in 1993; before then, the VOA was responsible for the earlier system of domestic rates. The Council Tax valuation list is a robust source of data that covers, in principle, all residential properties in England and Wales.
Nôl i'r tabl cynnwys4. How do the average house prices and annual growth rates compare?
Figure 1 presents the average house price for England and Wales presented under a stock and flow measure (UK House Price Index (UK HPI)).
Figure 1: Average house price of flow and stock of properties, England and Wales, January 1995 to December 2015
Source: Office for National Statistics, UK House Price Index
Download this chart Figure 1: Average house price of flow and stock of properties, England and Wales, January 1995 to December 2015
Image .csv .xlsIn January 1995, both series started off at approximately the same level but from around 2000 the average house price of both series began to diverge, with the flow measure increasing quicker than the stock measure. By July 2007, this difference had reached £14,000. The economic downturn led to a temporary convergence with the difference in the series reducing to £10,000 by December 2008. Following the recovery from the economic downturn the divergence resumed. By the end of the period, in December 2015, the average house price for England and Wales under a stock measure was £194,000, while for the flow measure this was £215,000.
Annual growth rates of both series are presented in Figure 2. Trends in both series are seen to be very similar.
Figure 2: Annual house price rates of change of flow and stock of properties, England and Wales, January 1996 to December 2015
Source: Office for National Statistics, UK House Price Index
Download this chart Figure 2: Annual house price rates of change of flow and stock of properties, England and Wales, January 1996 to December 2015
Image .csv .xlsWhile one might expect a flow measure to be slightly more volatile than a stock measure, in part because the weights are calculated on only one year’s worth of transactions rather than the full stock of properties, this does not seem to be the case. This may be due to the flow of houses sold each year being broadly representative of the housing stock across England and Wales. Alternatively, it could be due to inflation rates for this different mix of properties being quite similar.
While both show similar trends, the annual inflation rate of the flow is, on average, slightly higher than the stock (by 0.4 percentage points). It is this higher growth that explains why the average house price for a flow measure, as presented in Figure 1, is above that of the stock.
The gap between the two series was greatest in October 2000, when the flow was 2.4 percentage points higher than the stock. The next section looks at the reasons for the differences between both series by focusing on the weights.
Nôl i'r tabl cynnwys5. What’s driving the differences between the stock and flow?
Differences in levels and growth rates between both measures are due to differences in the mix of properties of a stock compared with a flow. If we focus on the stock and flow annual growth rates during 2000 we find that around 70% of the difference between both can be explained by four of the Acorn groups that are used as characteristics in the regression model.
CACI Acorn
Acorn is a geo-demographic segmentation of residential neighbourhoods in the UK. It classifies each postcode in the country into one of 62 types. The 62 types aggregate into 18 Acorn groups, which lie within six Acorn categories at the top level. These 18 groups (Acorn 1 to 18) are used as variables in the regression, as they are in the production of the UK House Price Index (UK HPI).
Of the 18 Acorn groups, four: “striving families”, “poorer pensioners”, “struggling estates” and “difficult circumstances” are much more prevalent in the stock of housing than they are in the flow as they tend to be sold less often. These four fall into the higher categories of “financially stretched” and “urban adversity”. There are four times as many “difficult circumstances” classified houses in the stock as there are in the flow and twice as many “struggling estates”. House prices in areas that are classified to these groups also tend to be lower, which results in a lower average house price in a stock measure compared with a flow and a lower inflation rate due to how infrequently they are sold.
The distribution of rooms between a stock and a flow also contributes to the differences seen, particularly properties with two habitable rooms. In 2000, of the difference between the stock and the flow, 10% can be explained by properties with two habitable rooms. Similarly to previously, there is a larger proportion of properties with two habitable rooms in the stock of properties compared with the flow and properties with fewer rooms tend to be cheaper than properties with more rooms.
To help understand how the property mix of a stock and flow measure differs we can take a closer look at their respective weights in a bit more detail.
Figure 3: Weights of the flow (in 2015) and stock of properties by Acorn category
Source: Office for National Statistics, UK House Price Index
Notes:
- Acorn categories rather than Acorn groups are shown here for presentational purposes.
Download this chart Figure 3: Weights of the flow (in 2015) and stock of properties by Acorn category
Image .csv .xlsAs can be seen in Figure 3 the wealthier Acorn categories of “affluent achievers”, “rising prosperity” and “comfortable communities”, together make up 70% of the flow while only 60% of the stock. Properties within these categories are transacted more, perhaps because individuals or families in these properties are more mobile. Conversely, properties in areas categorised as “financially stretched” and “urban adversity” are transacted less often and represent a smaller proportion of the flow of properties each period.
Figure 4: Percentage point difference between the weight of the flow (in 2015) and the stock of properties by Local Authority
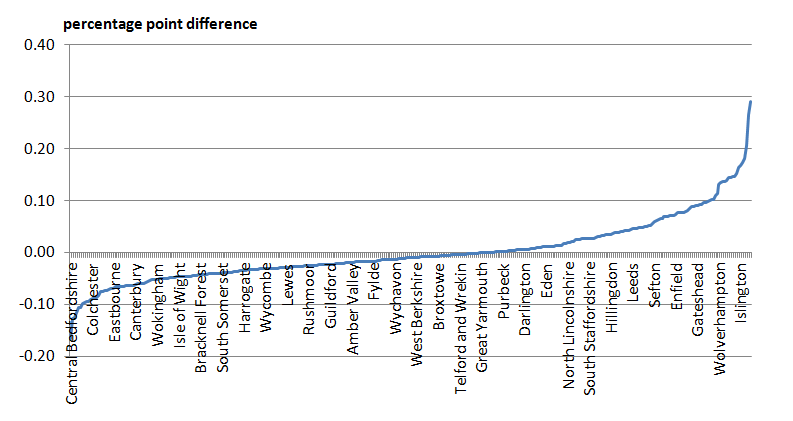
Source: Office for National Statistics, UK House Price Index
Download this image Figure 4: Percentage point difference between the weight of the flow (in 2015) and the stock of properties by Local Authority
.PNG (21.1 kB) .xlsx (20.1 kB)
Figure 4 presents the difference between stock and the flow, for each local authority in England and Wales. At one end we have major cities such as Birmingham, Liverpool and Sheffield that have a higher weight in a stock measure compared with a flow. By contrast, at the other end of the scale is Central Bedfordshire. Houses in local authorities at this end of the scale have a higher weight or contribution in the flow compared with the stock. Put another way, properties in Central Bedfordshire are transacted more often than those in Birmingham, relative to the available stock in those areas.
A possible reason for this is the presence of social housing in the housing stock. Houses owned by local authorities are not frequently transacted and therefore do not contribute to the flow each period but are still parts of the stock. Local authority housing statistics in 2016 reports that 14.5% of the stock of housing in Birmingham is social housing, while for Sheffield the figure is 16.6%. By contrast, only 4.4% of Central Bedfordshire’s stock consists of social housing.
Figure 5: Weights of the flow (in 2015) and stock of properties by property type
Source: Office for National Statistics, UK House Price Index
Download this chart Figure 5: Weights of the flow (in 2015) and stock of properties by property type
Image .csv .xlsFigure 5 shows the percentage of properties by type. Detached and terraced houses look to be transacted more frequently given they have a higher proportion in the flow, with flats and semi-detached properties transacted less often. Analysing by property on its own may not be that illuminating given that other factors, such as where the properties are located, may also be contributing to this distribution.
Figure 6: Weights of the flow (in 2015) and stock of properties by number of habitable rooms
Source: Office for National Statistics, UK House Price Index
Notes:
- The number of habitable rooms excludes bathrooms, conservatories, kitchens and utility rooms.
Download this chart Figure 6: Weights of the flow (in 2015) and stock of properties by number of habitable rooms
Image .csv .xlsFinally Figure 6 presents the number of properties by habitable rooms in the stock and flow. Broadly speaking, properties with more habitable rooms tend to be transacted more, hence they have a higher contribution in the flow. The biggest difference here is seen for properties with two habitable rooms that are more prevalent in the stock compared with the flow. This may be linked to the findings presented in Figure 5, which found that flats are more prevalent in the stock to the flow and flats tend to have fewer habitable rooms.
Overall, properties that are transacted frequently tend to be larger and in more affluent areas. Given their size and the area they are in, they tend to be more expensive. The consequence of this is that the average price level of a flow measure of house prices tends to be above that of a stock.
Nôl i'r tabl cynnwys6. Next steps
This article has presented preliminary estimates for a stock-weighted house price index and has presented these results against the UK House Price Index, which is a flow-based measure. We are looking to develop this statistic further and gather user feedback to the approach we should take. In our next release we are looking to:
- extend the coverage to include data for Scotland
- present analysis at a more granular level
In presenting this additional analysis we would be interested in any user feedback on the results presented so far such as:
- should we focus on the stock of all residential properties or simply the owner occupied housing stock?
Please send any suggestion or feedback to hpi@ons.gov.uk
Nôl i'r tabl cynnwys