Cynnwys
- Main points
- Statistician’s comment
- Summary
- Recent falls in CPIH reflect falls across the majority of components
- The extent of country and regional variation in prices across the UK differs by category of spending
- Falls in core input PPI have not yet fed through to core output PPI and core CPIH
- The stock-weighted measure of House Price Index closely tracks the flow-based measure
- Authors
1. Main points
The 12-month growth rate of the Consumer Prices Index including owner occupiers’ housing costs (CPIH) fell to 2.5% in February 2018, with a broad range of categories seeing a reduction in the 12-month growth rate.
London had the highest average level of consumer prices in the UK in 2016 compared with the UK average, with Northern Ireland having the lowest.
A slowdown in the 12-month growth rate of the core input Producer Price Index (PPI) has not yet fed through to core output PPI and core CPIH.
Movements in the stock-weighted House Price Index (HPI) closely track those in the flow-based measure.
2. Statistician’s comment
Commenting on today’s inflation figures, ONS Head of CPI Phil Gooding said:
“A small fall in petrol prices alongside food prices rising more slowly than last year helped pull down inflation, as many of the early 2017 price increases due to the previous depreciation of the pound have started to work through the system.
"Hotel prices also fell and the cost of ferry tickets rose more slowly than last year, when prices were collected on Valentine’s Day when many people could have been taking mini-breaks.
“There were some signs of slowing price rises in the cost of products leaving factories, with food and petroleum products prices falling. Inflation of raw materials is also slowing down following high annual inflation in 2017, with prices of crude oil lower than in January.
“House price growth remained steady, with prices increasing strongly across much of the country, although London and the North East are both lagging behind."
Nôl i'r tabl cynnwys3. Summary
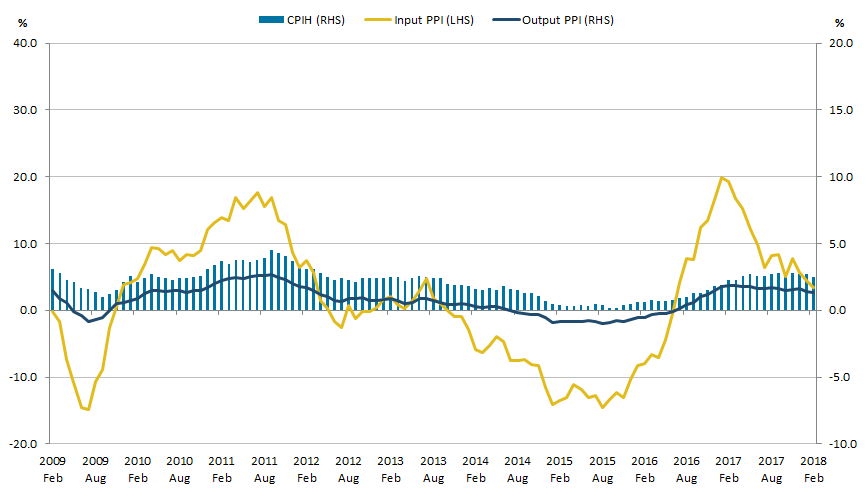
Figure 1 shows that the 12-month growth rate of the Consumer Prices Index including owner occupiers’ housing costs (CPIH) fell to 2.5% in February 2018. The input Producer Price Index (input PPI) grew by 3.4% in the 12 months to February 2018, down from 4.5% in the 12 months to January 2018. The output Producer Price Index (output PPI) grew by 2.6% in the 12 months to February 2018, down from 2.8% in the 12 months to January 2018.
Figure 1: Annual growth rate for input Producer Price Index (PPI)(left-hand side), output PPI and Consumer Prices Index including owner occupiers' housing costs (CPIH)(right-hand side)
UK, February 2009 to February 2018
Source: Office for National Statistics
Notes:
- These data are also available within the Dashboard: Understanding the UK economy.
Download this image Figure 1: Annual growth rate for input Producer Price Index (PPI)(left-hand side), output PPI and Consumer Prices Index including owner occupiers' housing costs (CPIH)(right-hand side)
.png (23.3 kB) .xls (35.3 kB)
Data tables accompanying this commentary include contributions to the 12-month growth rate of output and input PPI, and contributions to the 12-month growth rate of CPIH and CPI by total import intensity of goods and services.
Nôl i'r tabl cynnwys4. Recent falls in CPIH reflect falls across the majority of components
Figure 2 shows the contributions to the 12-month growth rate of the Consumer Prices Index including owner occupiers’ housing costs (CPIH) by category of spending. Housing, water, electricity, gas and other fuels has fairly consistently contributed the most to the 12-month growth rate of CPIH, between January 2013 and February 2018, contributing an average of 0.56 percentage points per month over the period.
Figure 2: Contributions to the growth rate of the Consumer Prices Index including owner occupiers' housing costs (CPIH) by category of spending
UK, January 2013 to February 2018
Source: Office for National Statistics
Download this chart Figure 2: Contributions to the growth rate of the Consumer Prices Index including owner occupiers' housing costs (CPIH) by category of spending
Image .csv .xlsThe increase in the 12-month growth rate of CPIH between April 2016 and April 2017 was driven largely by increases in the contribution from the transport category, in particular motor fuels. This reflected increases in both the dollar and sterling prices of crude oil, coupled with a weakening of the sterling effective exchange rate. Following this, the 12-month growth rate of CPIH has been fairly stable between August 2017 and January 2018 with the largest contributions coming from transport, and housing, water, electricity, gas and other fuels.
In the most recent month, February 2018, the 12-month growth rate for CPIH has fallen to 2.5%, down from 2.7% in January 2018. This reflects decreasing inflation across a range of goods and services, with the majority of components of CPIH contributing less to the headline rate in February 2018 than they did in January 2018.
The main driver of this change was transport, which contributed 0.08 percentage points less to the headline 12-month growth rate of CPIH in February than January. Food and non-alcoholic beverages, and restaurants and hotels both contributed 0.06 percentage points less to the headline rate over the same period. This recent trend may be partly attributable to the gradual strengthening of sterling over the same period, which reduces the inflationary pressure of imported goods and services.
Nôl i'r tabl cynnwys5. The extent of country and regional variation in prices across the UK differs by category of spending
The recently published country and regional relative consumer price levels data (RRCPL) uses spatial adjustment factors to estimate relative price levels for goods and services in different countries and regions of the UK. Taking UK national average prices as the reference point (UK equals 100), Table 1 shows how prices compare for different goods and services between countries and regions. It is important to note that these spatial price indices do not provide information on price change over time.
London has the highest overall relative country and regional consumer price level, at 107.0, which indicates that on average, prices in London are 7.0% above the UK average. In contrast, Northern Ireland has the lowest, at 97.7, indicating that prices in Northern Ireland are on average 2.3% below the UK average.
Table 1: Country and regional price level relative to national price level
| UK = 100, 2016 | |||||
| Division | London | England (excluding London) | Scotland | Wales | Northern Ireland |
|---|---|---|---|---|---|
| Food and non alcoholic beverages | 102.2 | 97.6 | 99.8 | 100.8 | 99.7 |
| Alcohol and tobacco | 103.0 | 96.8 | 99.4 | 102.3 | 98.6 |
| Clothing and footwear | 103.5 | 101.3 | 99.2 | 97.7 | 98.5 |
| Household and housing services1 | 105.1 | 98.7 | 99.7 | 99.6 | 97.0 |
| Furniture and household goods | 112.2 | 97.4 | 103.2 | 95.5 | 99.8 |
| Transport | 103.3 | 100.4 | 99.7 | 100.6 | 96.1 |
| Communication | 100.0 | 100.0 | 100.0 | 100.0 | 100.0 |
| Recreation and culture | 114.8 | 96.2 | 101.4 | 96.8 | 95.8 |
| Restaurants and hotels | 113.0 | 97.4 | 100.4 | 95.1 | 98.3 |
| Miscellaneous goods and services | 110.5 | 99.7 | 104.8 | 96.2 | 93.4 |
| All | 107.0 | 98.7 | 100.4 | 98.5 | 97.7 |
| Source: Office for National Statistics | |||||
| Notes: | |||||
| 1. Excluding rental costs and costs associated with owner occupied housing. | |||||
Download this table Table 1: Country and regional price level relative to national price level
.xls (36.9 kB)Table 1 also shows that when prices are broken down further into divisional categories, we can see greater or lesser country and regional variation, depending on the component. For example, there is a small amount of variation in the country and regional prices for food and non-alcoholic beverages, where London prices are 2.2% above the UK average and prices in England (excluding London) are 2.4% below the UK average. This suggests that across all countries and regions, food and non-alcoholic beverage prices are broadly similar. Prices for clothing and footwear exhibit similar differences, ranging from 3.5% above the UK average in London to 2.3% below in Wales. The low level of variation in prices across countries and regions for these divisions may be attributable to the dominance of large retailers who display little variation in their pricing across countries and regions.
Greater price variation exists in the divisions that include an element of services, such as restaurants and hotels, as well as recreation and culture. This is most noticeable in London, where restaurants and hotels, and recreation and culture prices are 13.0% and 14.8% above the UK average respectively. This likely reflects the variance in labour costs between regions, which make up a large proportion of the total costs in the services industry. The variability in the cost of renting or leasing outlets across the regions may also impact on the price of service-based divisions.
Nôl i'r tabl cynnwys6. Falls in core input PPI have not yet fed through to core output PPI and core CPIH
Figure 3 shows the 12-month growth rates for core components of the input and output Producer Price Index (PPI) and the Consumer Prices Index including owner occupiers’ housing costs (CPIH). The purpose of the core series is to strip away the more volatile components in each measure that are prone to temporary shocks, which may mask the underlying inflation level. Excluding the volatile series from these measures means that the 12-month growth rate is more stable than the aggregate series. All three core series exclude food, beverages and tobacco while core input PPI also excludes petroleum-based products (FBTP) and core CPIH also excludes energy1.
Figure 3: Core input Producer Price Index (PPI)(right-hand side), core output PPI and core Consumer Prices Index including owner occupiers' housing costs (CPIH)(left hand-side)
UK, January 2007 to February 2018

Source: Office for National Statistics
Notes:
- The energy component of CPIH is made up of electricity, gas and other fuels, and fuels and lubricants.
Download this image Figure 3: Core input Producer Price Index (PPI)(right-hand side), core output PPI and core Consumer Prices Index including owner occupiers' housing costs (CPIH)(left hand-side)
.png (31.8 kB) .xls (39.9 kB)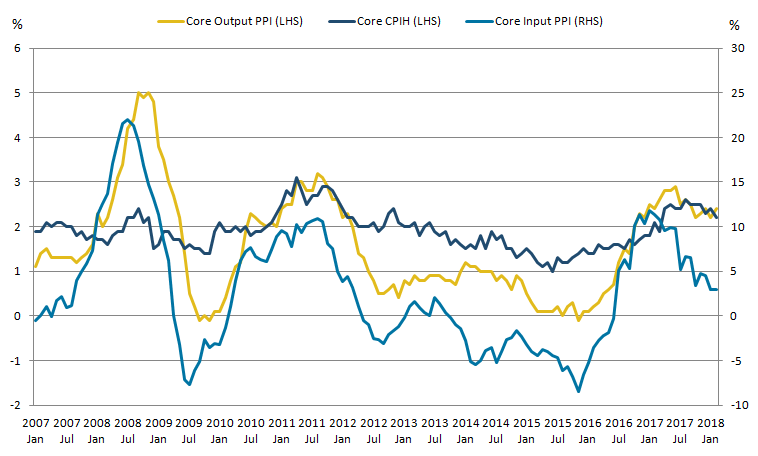
Previous analysis shows that components of core input PPI tend to broadly track the sterling effective exchange rate, due to core input PPI containing a large proportion of imported goods. Similarly, the movements in core output PPI appear to broadly track movements in core input PPI but with a slight lagged effect. This suggests that changes to the cost of inputs take time to translate into changes in the price of outputs. This may be due partly to fixed-term contracts between suppliers of inputs and producers.
Figure 3 also shows that core CPIH appears to broadly track core output PPI but with more muted movements and little to no lagged effect. The lack of a notable lagged effect between changes in core output prices and changes in core CPIH may be due to households having fewer fixed-term contracts or price guarantees with producers. Therefore, changes in core output prices appear to have a more immediate impact on the prices faced by households.
In the 12 months to February 2018, the growth rate of core input PPI has remained at 2.9%, down from 4.5% in the 12 months to December 2017. The growth rate of core output PPI rose slightly to 2.4% and the growth rate of core CPIH fell slightly to 2.2% in the 12 months to February 2018. The 12-month growth rate in core input PPI has been falling fairly consistently since January 2017, while the 12-month growth rates for core output PPI and core CPIH have been relatively flat over recent months suggesting that the falls seen in the 12-month growth rate of input PPI have not yet fed through into core output PPI and core CPIH. The falling rate of core input PPI since December 2017 has been driven largely by imports, with prices decreasing for some components such as other imported parts and equipment.
Notes for: Falls in core input PPI have not yet fed through to core output PPI and core CPIH
- The energy component of CPIH is made up of electricity, gas and other fuels, and fuels and lubricants.
7. The stock-weighted measure of House Price Index closely tracks the flow-based measure
The February 2018 Stock-weighted House Price Index article presented preliminary estimates as an alternative to the flow-based UK House Price Index (UK HPI).
The stock-weighted approach reflects the stock of properties at a particular moment in time, whilst the flow-based measure reflects residential property sales to private households during a particular period. In the flow-based measure, updated annually, weights represent the type and location of properties sold in the previous year. The weights are then used to estimate an average house price in each period. However, the type and location of properties sold in a particular period may not reflect the make-up of the overall stock of residential properties, as individuals have preferences to which type and location of property they purchase. It is estimated property transactions make up around 4% of the residential stock each year.
Figure 4 reflects the differences in the estimates of the annual growth rates of the stock-weighted House Price Index and the UK HPI (flow-based measure). The stock-weighted series covers England and Wales and is compared here to England and Wales coverage within the UK HPI (flow measure).
Figure 4: Annual house price rates of change of flow and stock of properties
England and Wales, January 1996 to December 2015
Source: Office for National Statistics
Download this chart Figure 4: Annual house price rates of change of flow and stock of properties
Image .csv .xlsFigure 4 shows that the annual growth-rate trends for both indices are similar, which may be due to the flow of houses sold each year being broadly representative of the housing stock across England and Wales. However, the flow-based measure is on average slightly higher than the stock.
The difference between the two series was greatest in October 2000, when the flow-based measure was 2.4 percentage points higher than the stock-based measure. Around 70% of the difference in the stock and flow annual growth rates during 2000 can be explained by four of the Acorn groups used as characteristics in the regression model. Acorn is a geo-demographic segmentation of residential neighbourhoods in the UK and are used as variables within the regression analysis that estimates UK HPI. Four of the groups fall into the categories of “financially stretched” and “urban adversity”, and are much less prevalent in the flow-based measure as they are sold less often.
For example, there are twice as many houses classified as “struggling estates” in the stock as there are in the flow. House prices in these areas tend to be lower, resulting in a lower stock-measure HPI compared with flow-based and a lower inflation rate due to how infrequently they’re sold.
The remaining 30% can be explained by differences including the property type and distribution of rooms. For example, detached houses have a higher proportion of the flow-based measure given they are transacted more frequently, with flats transacted less often. There is a larger proportion of properties with two habitable rooms in the stock of properties compared with the flow. In fact, 10% of the difference between the stock-based measure and flow-based measure in 2000 can be explained by properties with two habitable rooms.
Another example is that more frequently transacted houses tend to be in more affluent areas, which also tend to have higher house prices. Consequently, the average price level of the flow-based measure of house prices tends to be above that of the stock. The presence of social housing in the housing stock may also partially explain the difference, as houses owned by local authorities are not frequently transacted and therefore do not contribute to the flow but are still included in the stock.
Further analysis on the differences is contained in the Stock-weighted House Price Index article.
Nôl i'r tabl cynnwys