Cynnwys
- Main points
- Statistician’s comment
- Introduction
- CPIH grew by 2.3% in the 12 months to February while factory gate producer prices rose by 3.7%
- Longer-term changes in owner occupiers’ housing costs (OOH) reflect changes in private rental prices in England (excluding London)
- 12-month growth rate for food turns positive at 0.3% following almost 3 years of food price deflation
- PPI output price growth still driven by refined petroleum products
- Twice as many first-time buyers spent more than £200,000 on a property in 2016 than in 2006
1. Main points
Consumer and producer prices
- Consumer price inflation continued to rise in February 2017, reflecting upwards pressure from increasing food and transport costs.
- The 12-month rates of inflation for manufacturers’ inputs and outputs in February 2017 are broadly unchanged from January, reflecting little change in prices in the month.
House prices
- The distribution of house prices for first-time buyers, using a mortgage, has seen a marked shift towards properties valued above £200,000 in the last 10 years.
2. Statistician’s comment
Commenting on today’s CPIH, factory gate and house price figures, ONS Deputy National Statistician Jonathan Athow said:
“Inflation has risen to its highest rate for almost three and a half years with price increases seen across a range of items but with food and fuel having the largest impact.
"Prices for manufacturers stayed broadly constant in February, though the annual growth rate for goods leaving the factory gate remains at levels not seen since 2011.
“House prices continued to rise into January, albeit at a slightly slower rate than the 2016 average.”
Nôl i'r tabl cynnwys3. Introduction
We introduced our new economic "theme days" in January which will ensure that related economic statistics are released together. The separate bulletins relating to the Prices theme day contain details of the new data published and important information on how to interpret the statistics.
UK producer price inflation: Feb 2017
UK consumer price inflation: Feb 2017
Index of private housing rental prices (IPHRP) in Great Britain: Feb 2017
UK house price index: Jan 2017
The House Price Index annual tables have also been updated to 2016 and are used in this commentary.
In line with the change in the UK consumer price inflation bulletin, the analysis in this article will be on movements in the Consumer Prices Index including owner occupiers’ housing costs (CPIH). This extends the Consumer Prices Index (CPI) to include a measure of the costs associated with owning, maintaining and living in one’s own home, known as owner occupiers’ housing costs (OOH), along with Council Tax.
Data tables accompanying this release are:
- contributions to the 12-month growth rate for input and output producer prices
- contributions to the 12-month growth rate of the Consumer Prices Index including owner occupiers’ housing costs (CPIH) by import intensity of products
4. CPIH grew by 2.3% in the 12 months to February while factory gate producer prices rose by 3.7%
Figure 1 shows that the Producer Price Index (PPI) input (left-hand scale) and PPI output indices (right-hand scale) move in broadly similar ways over time, although the movement in manufacturers’ input prices is considerably greater than for manufacturers’ output prices. The 12-month input PPI increased by 19.1% in February 2017 while output PPI increased by 3.7%. Both these figures are broadly unchanged on the 12-month growth rate in January, indicating little change in prices in the month or from base effects.
The 12-month growth in the Consumer Prices Index including owner occupiers’ housing costs (CPIH) increased to 2.3% in February from 1.9% in January. The February rate for CPI is also 2.3% and is above the Bank of England’s target for inflation for the first time since December 2013.
Figure 1: Annual growth for PPI input (LHS), PPI output and CPIH (RHS)
UK, January 2008 to February 2017

Source: Office for National Statistics
Notes:
- These data are also available within the Dashboard: assessing the post-referendum UK economy.
Download this image Figure 1: Annual growth for PPI input (LHS), PPI output and CPIH (RHS)
.png (23.9 kB) .xls (28.2 kB)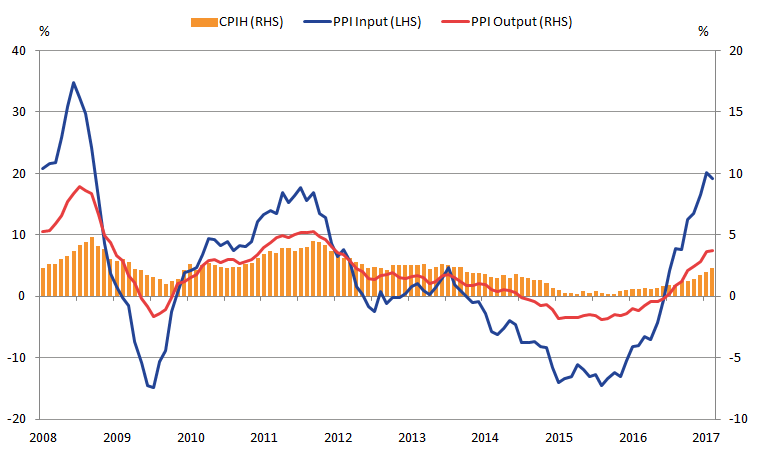
5. Longer-term changes in owner occupiers’ housing costs (OOH) reflect changes in private rental prices in England (excluding London)
Our preferred method to measure owner occupiers’ housing costs (OOH) is the rental equivalence approach, which imputes owner occupiers’ housing costs from the rents paid for equivalent rented properties. Given that OOH account for around 17% of CPIH, it is the main driver for differences between the CPIH and CPI inflation rates. While CPIH and CPI show similar trends over time, movements in OOH have resulted in differences in the rates.
To further understand the movements in the OOH component, Figure 2 plots the 12-month growth rate for the Index of Private Housing Rental Prices (IPHRP) against the OOH component of CPIH. The IPHRP measures the change in price of renting residential property from private landlords. It uses the same source of rental data as OOH but the weights used to create the different series are designed to reflect the different housing mix that can be found in the private rental market compared with the owner-occupied market.
Figure 2: 12-month growth rate for IPHRP, England and OOH, UK
January 2006 to February 2017
Source: Office for National Statistics
Notes:
- England is used here as comparison because it is produced on a longer time series than the IPHRP for Great Britain. However, as England accounts for around 90% of the total weight in IPHRP, the growth rates are similar for Great Britain and England.
Download this chart Figure 2: 12-month growth rate for IPHRP, England and OOH, UK
Image .csv .xlsFigure 2 shows that the IPHRP (England) and OOH follow similar trends over time, although rental price growth was higher than OOH in the periods 2008, 2011 to 2013 and 2015. These increases were largely driven by higher rental price growth in London, which accounted for 36% of the total weight in IPHRP in 2017. Rental price growth in London peaked at 5.3% in summer 2012, compared with 3% in England as a whole. If we exclude London from the measure, rental price growth in England was just 1.7%, in line with OOH. Figure 2 shows that this relationship between IPHRP (England excluding London) and OOH holds over the whole time series.
While rental price growth in London has slowed in recent periods, the latest data show continued growth in IPHRP (England excluding London) and OOH. OOH was less affected by the movement in London rental prices because London has a lower weight in the OOH series. This reflects the fact that London has a smaller proportion of total owner-occupier housing stock, compared with rented properties. Figure 3 shows the proportion of the total owner occupied and rented dwelling stock that is accounted for by each region. Expenditure weights for IPHRP and OOH are calculated by multiplying these dwelling stock counts from the Department for Communities and Local Government (DCLG) by average rental prices.
Figure 3: Dwelling stock proportions, by tenure and region
England, 2011
Source: Department for Communities and Local Government
Download this chart Figure 3: Dwelling stock proportions, by tenure and region
Image .csv .xls6. 12-month growth rate for food turns positive at 0.3% following almost 3 years of food price deflation
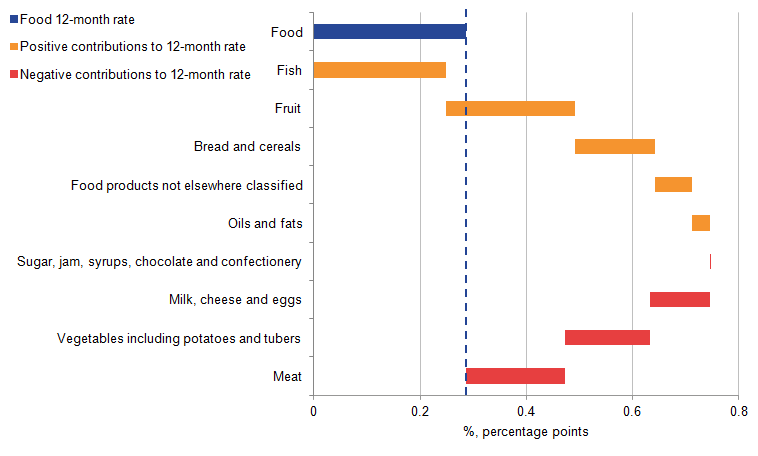
The 12-month growth rate for food within CPIH was 0.3% in February 2017, up from negative 0.4% in January. This is the first month of positive food price growth since April 2014.
Figure 4 shows the contributions to the 12-month growth rate of food by class of product. Positive contributions are mainly from fruit and fish, offset by negative contributions from vegetables and meat. The impacts of widely reported shortages of some vegetables in February were seen in rises in individual product prices such as lettuce during the month, but over 12 months, vegetable prices were still 0.9% lower in aggregate than in February 2016.
Figure 4: Contributions to the 12-month rate for CPIH Food group, by class
UK, February 2017
Source: Office for National Statistics
Notes:
- Individual contributions may not sum due to rounding
Download this image Figure 4: Contributions to the 12-month rate for CPIH Food group, by class
.png (14.7 kB) .xls (17.9 kB)
7. PPI output price growth still driven by refined petroleum products
Figure 5 shows the change in the contributions to Producer Price Index (PPI) output price growth from different types of products supplied by UK manufacturers since February 2013. From the beginning of 2015 to mid-2016, refined petroleum products were the largest contributor to output price deflation, reflecting lower global oil prices. From December 2016 however, refined petroleum products became the largest contributor to output price inflation which has continued into February 2017.
The contribution to PPI output inflation from chemical and pharmaceutical products also continued to grow in February 2017. For 5 consecutive months, food products have also been contributing positively to output price growth, with the contribution steadily increasing in size each month.
Figure 5: Contributions to the 12-month rate of output producer price inflation by component and overall output PPI rate
UK, February 2013 to February 2017
Source: Office for National Statistics
Notes:
- Contributions to output PPI may not sum up due to rounding.
Download this chart Figure 5: Contributions to the 12-month rate of output producer price inflation by component and overall output PPI rate
Image .csv .xls8. Twice as many first-time buyers spent more than £200,000 on a property in 2016 than in 2006
Figure 6 shows the cumulative percentage of house buyers, using a mortgage, by the price they paid in 2016 compared with 2006. House buyers are categorised into first-time buyers and former owner-occupier buyers.
Figure 6: Cumulative distribution of house prices for first time buyers and former owner-occupier buyers
UK, 2006 and 2016
Source: Regulated Mortgage Survey (RMS), Matrix Solutions/Council of Mortgage Lenders
Notes:
- The price intervals are not equal in width along the horizontal axis.
- The data used to produce the chart are taken from the Council of Mortgage Lenders (CML) and cover 70% of all purchases with mortgages. Cash sales are not covered in this analysis.
- Data are published in HPI annual tables, Table 34.
Download this chart Figure 6: Cumulative distribution of house prices for first time buyers and former owner-occupier buyers
Image .csv .xlsThe data show that there has been an upward shift in the distribution of house prices for both first-time buyers and former owner-occupiers using a mortgage between 2006 and 2016. For example, 15% of first-time buyers bought their houses for under £80,000 in 2006; however, this has fallen to approximately 7% in 2016. In contrast, there has been a large increase in the share of properties bought by first-time buyers at more than £200,000 (16.8% in 2006 compared with 39.3% in 2016). These figures are likely to be influenced by high average London property prices.
These data also show that former owner-occupiers using a mortgage have seen a similar shift in the distribution of house purchase prices. In 2016 only around 20% of former owner-occupiers bought houses for more than £300,000; however, this proportion rose to around 40% by 2016. These data also show that first-time buyers now need to spend almost as much on a property, in nominal terms, as former owner-occupiers did 10 years ago. For example, in 2016 just over two-thirds of first-time buyers (73.7%) spent less than £250,000 on a house, a similar proportion to former owners (69%) in 2006.
Nôl i'r tabl cynnwys