1. Main points
The 12-month growth rate of the Consumer Prices Index including owner occupiers’ housing costs (CPIH) rose to 2.3% in May 2018, its first increase since September 2017.
The increase in the 12-month growth rate of CPIH between April and May 2018 was driven largely by transport, with global prices for crude oil partially driving growth in the prices of fuels and lubricants.
Recent increases in global prices for crude oil have also driven increases in the 12-month growth rate for the input Producer Price Index (PPI), which rose to 9.2% in May 2018.
Annual rental price growth in London turned negative for the first time since 2010 but remained unchanged in Great Britain as a whole.
2. Statistician’s comment
Commenting on today’s inflation figures, Head of Inflation Mike Hardie said:
“Recent large rises in the cost of crude oil have fed through to prices paid by consumers at the pump. Air fares and ferry prices also contributed to the overall increase in inflation due to the timing of Easter. However, these effects have been partly offset by price falls in computer games and energy costs rising by less than this time last year.
“Annual house price growth continued to slow, with weak growth in London offset by increases in the South West and West Midlands. Nationally, rental prices remained unchanged, with rents in London falling on the year for the first time in nearly eight years.”
Nôl i'r tabl cynnwys3. Summary
Figure 1 shows that the 12-month growth rate of the Consumer Prices Index including owner occupiers’ housing costs (CPIH) rose to 2.3% in May 2018. By far the largest driver of this increase was transport. The input Producer Price Index (input PPI) grew by 9.2% in the 12 months to May 2018, up from 5.6% in the 12 months to April 2018; this was driven mainly by increases in prices for crude oil and fuels. The output Producer Price Index (output PPI) grew by 2.9% in the 12 months to May 2018; the largest upward contribution was from coke and refined petroleum products. Prices for coke and refined petroleum products increased by 12.4% in the 12 months to May 2018; this was up from 5.6% in the 12 months to April 2018.
Figure 1: 12-month growth rates for input Producer Price Index (PPI) (left-hand side), output PPI and Consumer Prices Index including owner occupiers' housing costs (CPIH) (right-hand side)
UK, April 2009 to April 2018

Source: Office for National Statistics
Notes:
- These data are also available within the Dashboard: Understanding the UK economy.
Download this image Figure 1: 12-month growth rates for input Producer Price Index (PPI) (left-hand side), output PPI and Consumer Prices Index including owner occupiers' housing costs (CPIH) (right-hand side)
.png (22.2 kB) .xls (45.6 kB)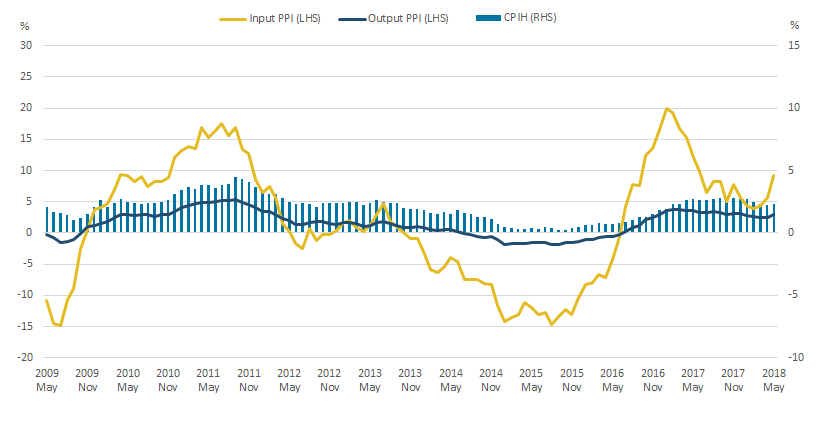
4. 12-month growth in CPIH rises to 2.3% in May 2018, driven by transport
Figure 2 shows the 12-month growth rate of the Consumer Prices Index including owner occupiers’ housing costs (CPIH) and the contributions made to the headline rate by specific components – transport, food and non-alcoholic beverages, clothing and footwear, housing, water, electricity, gas and other fuels, and the combined other components – from January 2016 to May 2018.
Figure 2: Contributions to the 12-month growth rate of Consumer Prices Index including owner occupiers' housing costs (CPIH) by category
UK, January 2016 to May 2018
Source: Office for National Statistics
Download this chart Figure 2: Contributions to the 12-month growth rate of Consumer Prices Index including owner occupiers' housing costs (CPIH) by category
Image .csv .xlsThe 12-month growth rate in CPIH has been broadly decreasing in recent months, from 2.8% in November 2017 to 2.2% in April 2018, although it has increased again to 2.3% in May 2018. A number of components have contributed to the recent falls in the 12-month growth rate of CPIH, including clothing and footwear, housing, water, electricity, gas and other fuels, and food and non-alcoholic beverages. The largest overall contribution to the fall in the 12-month growth rate came from transport, which contributed 0.23 percentage points less to the headline 12-month growth in CPIH in April 2018 than in November 2017, when CPIH was at its recent peak. Transport was also the biggest driver of the increase in the 12-month growth rate between April and May 2018; contributing 0.58 percentage points to the 12-month growth rate in May 2018 compared with 0.30 percentage points in April 2018.
Figure 3 shows the 12-month growth rate for the transport component of CPIH and the contributions made by specific components of transport – fuels and lubricants, passenger transport by air, passenger transport by sea and inland waterways, and the combined other components – from January 2016 to May 2018.
Figure 3: Contributions to the 12-month growth rate of the transport component of Consumer Prices Index including owner occupiers' housing costs (CPIH)
UK, January 2016 to May 2018
Source: Office for National Statistics
Download this chart Figure 3: Contributions to the 12-month growth rate of the transport component of Consumer Prices Index including owner occupiers' housing costs (CPIH)
Image .csv .xlsThe biggest driver of change in the 12-month growth rate for the transport component of CPIH in recent months has been fuels and lubricants, which fell from contributing 3.84 percentage points to growth of the transport component in February 2017, to only 0.05 percentage points in March 2018. Fuels and lubricants have also been the biggest driver of this month’s increase in the 12-month growth rate for the transport component of CPIH, contributing 1.57 percentage points to the overall transport component 12-month growth rate in May 2018. This increase in fuels and lubricants reflects rising global prices for crude oil and is explored more in the Producer Price Index (PPI) analysis.
Other notable drivers of the increase in the 12-month growth rate for the transport component of CPIH are passenger transport by air and passenger transport by sea and inland waterways, which contributed 0.29 percentage points and 0.20 percentage points respectively to the 12-month growth rate of the transport component in May 2018. Last month’s Prices economic commentary: May 2018 explained the effect that the timing of Easter has on prices for air fares, in particular, while a similar effect is seen for passenger transport by sea and inland waterways.
Figure 4 shows the passenger transport by air component of CPIH for January 2016 to May 2018, indexed to January equals 100 for each year. In the chart legend, the month in the bracket indicates which month Easter fell in that particular year. This year Easter Sunday fell on 1 April, which was largely between the dates of flights for which prices data are collected for CPIH for March and April, and meant that most of the Easter holiday price increases were not picked up in either March or April CPIH data. Prices for air fares within CPIH therefore remained broadly unchanged between March and April 2018, having fallen slightly compared with February 2018.
Figure 4: Air fares component of Consumer Prices Index including owner occupiers’ housing costs (CPIH)
UK, January 2016 to May 2018
Source: Office for National Statistics
Download this chart Figure 4: Air fares component of Consumer Prices Index including owner occupiers’ housing costs (CPIH)
Image .csv .xlsThe most recent data, for May 2018, show an increase in the passenger transport by air component of CPIH, with prices in May being 13.2% higher than in January 2018. This is broadly in line with increases in 2017 and 2016, which saw prices in May being 13.1% and 15.6% higher respectively. This suggests that, regardless of the timing of Easter, prices in May relative to January remain broadly similar between years.
Nôl i'r tabl cynnwys5. Rising global prices for crude oil are feeding through into producer and consumer prices
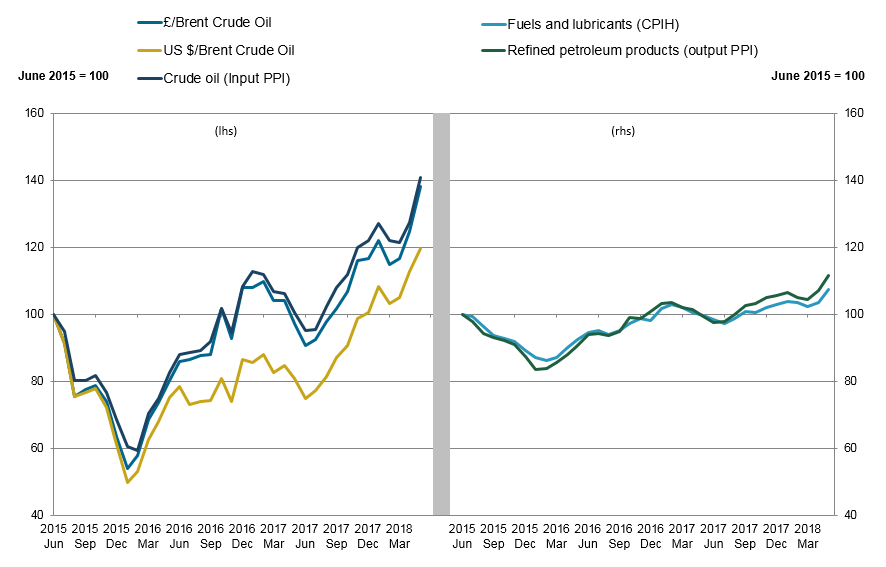
Global prices for Brent crude oil as well as related producer and consumer prices are shown in Figure 5. The left-hand panel shows global prices for Brent crude oil, in both pounds sterling and US dollars, and the prices that manufacturing firms pay for crude oil as represented by the crude oil component of the input Producer Price Index (input PPI). The right-hand panel shows consumer prices for fuels and lubricants from the Consumer Prices Index including owner occupiers’ housing costs (CPIH) and factory gate prices for refined petroleum products from the output Producer Price Index (output PPI).
Figure 5: Brent crude oil and crude oil (input PPI) index (left-hand side), and refined petroleum products (output PPI) and fuels and lubricants (CPIH) (right-hand side)
UK, June 2015 to May 2018
Source: Office for National Statistics, Financial Times
Download this image Figure 5: Brent crude oil and crude oil (input PPI) index (left-hand side), and refined petroleum products (output PPI) and fuels and lubricants (CPIH) (right-hand side)
.png (47.1 kB) .xls (30.7 kB)
Brent crude oil prices in pounds sterling and US dollars tracked each other closely between June and December 2015, beginning to diverge in early 2016 and diverging further as sterling depreciated following the EU referendum in June 2016. Although this gap remains, prices have nonetheless continued to follow similar trends with recent price rises following decreases in early 2018.
The latest data for May show that the crude oil component of input PPI was 40.7% higher than in June 2015. This reflects both underlying increases in Brent crude oil prices and exchange rate effects, as the sterling price of Brent crude oil increased by 38.1% over the same period compared with an increase of only 19.5% in the US dollar price of Brent crude oil. All three measures have increased in April and May 2018. Recent increases in global prices for crude oil reflect a range of international supply side factors, including geopolitical tensions, declines in Venezuela’s production and the threat of new sanctions on Iran by the US.
These increases in input prices have fed through into higher producer output prices and consumer prices. The right-hand panel of Figure 5 shows the fuels and lubricants component of CPIH and the refined petroleum products component of output PPI. Consumer prices and output prices for petroleum products have followed each other closely over the period. Both series have been rising for the last two months, with the latest data for May 2018 showing that prices for the fuels and lubricants component of CPIH and the refined petroleum products component of output PPI are now 7.4% and 11.7% higher respectively than in June 2015. This reflects the trends seen in producer input prices and global prices for oil.
Nôl i'r tabl cynnwys6. Annual rental growth in London is negative for the first time since 2010
Figure 6 shows the 12-month growth rates for house prices and rental prices in London since January 2010. Changes to the 12-month growth rate for private rental prices are influenced by changes in the 12-month growth rate for house prices, as landlords seek sufficient rental yields for the purchase price, as well as other market factors.
Figure 6: 12-month growth in London house prices and rental prices
London, January 2010 to May 2018
Source: HM Land Registry, Office for National Statistics
Notes:
- The chart uses the latest available data: house price 12-month growth for April 2018 and rental price 12-month growth for May 2018.
Download this chart Figure 6: 12-month growth in London house prices and rental prices
Image .csv .xlsThe latest available rental price data show that average rents in London fell by 0.2% between May 2017 and May 2018. This is the first month of negative 12-month growth in London rents since September 2010 when the 12-month growth rate was negative 0.4%. Growth in London rental prices has been slowing since August 2015 when the 12-month growth rate was 4.3%.
In April 2018 – the latest month for which data are available – the 12-month growth rate for house prices in London increased, from negative 0.5% growth in March 2018 to 1.0% growth in April 2018, the first time annual house price growth has increased since August 2017. Previous analysis has shown that changes in rental price growth tend to broadly track changes in house price growth but take around 14 months to feed through to the rental market and are more muted in their impact.
Figure 7 shows the 12-month growth rates for house prices and rental prices in Great Britain from January 2012, the earliest that data are available at this aggregation.
Figure 7: 12-month growth in Great Britain house prices and rental prices
Great Britain, January 2012 to May 2018
Source: HM Land Registry, Office for National Statistics
Notes:
The chart uses the latest available data: house price growth for April 2018 and rental price growth for May 2018.
Rental data for Great Britain are only available from 2012 as earlier data for Scotland are not available.
Download this chart Figure 7: 12-month growth in Great Britain house prices and rental prices
Image .csv .xlsHouse price growth in Great Britain has followed similar trends to London since 2014 but has remained more robust in recent months. Rental price growth has been broadly decreasing since August 2015 with the slowdown driven mainly by the fall in rental price growth in London over the same period.
The slowdown in the rental market likely reflects a combination of supply side and demand side factors. The Royal Institution of Chartered Surveyors (RICS) April 2018 Residential Market Survey reported that tenant demand in the three months to April 2018 was stagnant. On the supply side, there was a sharp increase in property transactions prior to the introduction of higher Stamp Duty on additional properties in April 2016, with the effect of the increased stock of properties likely taking time to feed through to rental prices.
Nôl i'r tabl cynnwys