Cynnwys
- Main points
- Statistician’s comment
- Summary
- Price movements differ between higher and lower import intensity groupings
- The 12-month growth rate of input PPI was negative for the first time since June 2016
- England experienced a fall in the growth rate of house prices in the 12-months to May 2018 and to May 2019
- Authors
1. Main points
The 12-month growth rate of the Consumer Prices Index including owner occupiers’ housing costs (CPIH) was 1.9% in June 2019, unchanged from May 2019.
The 12-month growth rate of the input Producer Price Index (input PPI) fell to negative 0.3% in June 2019, down from 1.4% in May 2019; this is the first fall on the year since June 2016.
The output Producer Price Index (output PPI) grew by 1.6% in the 12 months to June 2019, down from growth of 1.9% in the 12 months to May 2019.
Changes to the 12-month growth rate of CPIH have been driven mainly by changes within the higher import intensity groups and energy.
Annual house price growth in the UK continued to slow in May 2019, with prices in London falling by 4.4%, the lowest rate of growth since August 2009.
2. Statistician’s comment
Commenting on today’s inflation figures, Head of Inflation at the Office for National Statistics, Mike Hardie said:
“Annual house price growth remained slow but was once again strong in the North West and Wales. However, London experienced its biggest annual fall since August 2009.
“The overall rate of inflation remains steady, with no change in pace this month. Petrol and diesel prices fell this year but rose a year ago, while clothes prices dropped by less than this time last year.”
Nôl i'r tabl cynnwys3. Summary
Figure 1 shows that the 12-month growth rate of the Consumer Prices Index including owner occupiers’ housing costs (CPIH) was 1.9% in June 2019, unchanged from May 2019. The largest downward contributions to the change in the 12-month rate came from housing and household services, transport and restaurants and hotels. These downward effects were offset by upward contributions from clothing and footwear, food and non-alcoholic beverages and furniture, household equipment and maintenance.
The 12-month growth rate of input Producer Price Index (input PPI) fell to negative 0.3% in June 2019, down from 1.4% in May 2019. This is the first fall on the year since June 2016. Crude oil made the largest downward contribution to the change in the 12-month growth rate.
The output Producer Price Index (output PPI) grew by 1.6% in the 12 months to June 2019, down from growth of 1.9% in the 12 months to May 2019; its lowest rate of growth since September 2016.
Figure 1: The 12-month growth rate of CPIH was unchanged in June 2019, while the 12-month growth rates of both input and output PPI fell between May and June 2019
12-month growth rates for input PPI and output PPI (left-hand side), and CPIH (right-hand side), UK, June 2010 to June 2019
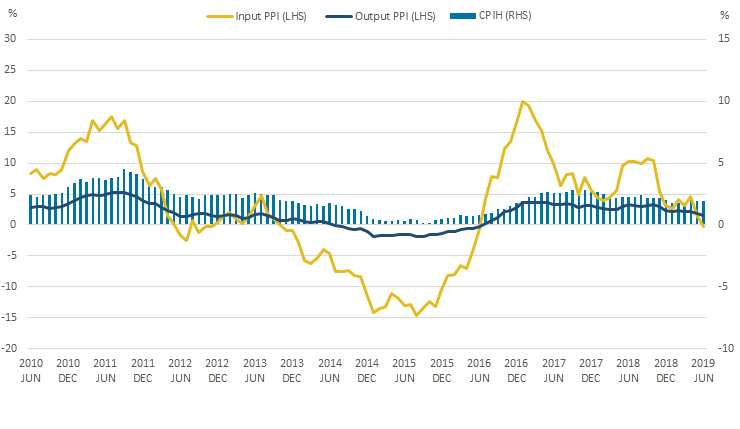
Source: Office for National Statistics – Producer Price Index and Consumer Prices Index including owner occupiers' housing costs
Notes:
- These data are also available within the Dashboard: Understanding the UK economy.
Download this image Figure 1: The 12-month growth rate of CPIH was unchanged in June 2019, while the 12-month growth rates of both input and output PPI fell between May and June 2019
.png (25.0 kB) .xlsx (21.5 kB)
4. Price movements differ between higher and lower import intensity groupings
This analysis uses the updated import intensity estimates for Consumer Prices Index including owner occupiers’ housing costs (CPIH) released today (17 July 2019), based on the methodology published in the January 2018 Economic review.
Total import intensity refers to percentage of the final household consumption that is either directly or indirectly due to imports. Both direct and indirect estimates of import intensity are reflected in the final price consumers face and include the effects of taxes, subsidies and margins. Indirect import intensity refers to goods and services that are produced domestically but use a degree of imported materials or services to make up the final production. Direct import intensity refers to goods and services that are produced abroad but imported into the UK.
Estimating the import intensity of the CPIH basket is particularly relevant given the recent sterling exchange rate movements. The extent to which a weaker pound makes imports relatively more expensive for UK consumers depends upon the import intensity of consumer demand and the extent of the pass-through of the exchange rate. Analysis of the pass-though is presented in the July 2019 Economic review.
The average total import intensity of the CPIH basket is 21.7%, which reflects the average direct import intensity of 14.5% and indirect import intensity of 7.2%. This means that according to household expenditure weights in the 2015 input-output analytical tables, of every £1 spent, 14.5 pence is spent on a direct import and 7.2 pence is spent on imports used in the production of goods and services. Figure 2 shows the estimates for indirect and direct import intensity by division.
Figure 2: The CPIH divisions with the highest total import intensity have a higher proportion of direct import intensity
Estimates for indirect and direct import intensity by the divisions of the CPIH basket, UK, 2015
Source: Office for National Statistics – Consumer Prices Index including owner occupiers’ housing costs
Notes:
- Import intensity estimates are based on the latest (2015) Input-Ouput Analytical Tables.
- Division level estimates are based on household expenditure weighting within the Input-Output Analytical Tables.
Download this chart Figure 2: The CPIH divisions with the highest total import intensity have a higher proportion of direct import intensity
Image .csv .xlsClothing and footwear has the highest total import intensity of the CPIH divisions at 39.6% and the highest direct import intensity at 38.7%. The 38.7% reflects the high dependence on imported manufactured clothing.
Communication has the highest indirect import intensity at 19.0% and one of the lowest direct import intensities (under 1.0%). The large indirect import intensity may be partially attributed to importing parts for communication and telecommunications (broadband and networks) which are used in the intermediate production chain.
Products can be grouped into their relevant import intensity in order to track price movements over time. Figure 3 shows price indices by import intensity between January 2014 and June 2019.
Figure 3: Price movements for the higher import intensity groups have been more volatile over the period
Consumer Prices Index including owner occupiers' housing costs (CPIH) by import intensity group, UK, January 2014 to June 2019
Source: Office for National Statistics – Consumer Prices Index including owner occupiers’ housing costs
Notes:
- Updated import intensity estimates effect the import intensity groups from January 2015 onwards with:
a. Products for the regular repair of dwelling and information processing equipment moving from the 25 to 40% group to the 10 to 25% group.
b. Fish, and garments moving from the 40% plus group to the 25 to 40% group.
c. Cultural services moving from the 10 to 25% group to the 25 to 40% group.
Download this chart Figure 3: Price movements for the higher import intensity groups have been more volatile over the period
Image .csv .xlsSince January 2014, prices for lower import intensity groups have experienced the highest growth at 14.6% for the 0% to 10% group, and 11.3% for the 10% to 25% group. Over the same period, the higher import intensity groups have grown by a lesser amount, with growth of 6.4% for the 25% to 40% group, and 2.4% for the 40% plus group.
Greater fluctuation is seen in the price movements for the higher import intensity groups compared with the lower groups. This fluctuation partly reflects movements in the sterling effective exchange rate which has a stronger effect on goods with a higher import intensity, such as new cars and spare parts and accessories within the transport component of the CPIH basket.
The import intensity groupings can also be shown by their contributions to the 12-month growth rate of CPIH. Figure 4 shows the contributions since January 2014.
Figure 4: Changes to the inflation rate have been driven mainly by changes within the higher import intensity groups and energy
Contributions to the 12-month growth rate of CPIH by import intensity group, UK, January 2014 to June 2019
Source: Office for National Statistics – Consumer Prices Index including owner occupiers’ housing costs
Notes:
Energy includes fuels and lubricants; electricity; gas; liquid fuels and solid fuels.
Updated import intensity estimates effect the import intensity groups from January 2015 onwards with:
a. Products for the regular repair of dwelling and information processing equipment moving from the 25 to 40% group to the 10 to 25% group.
b. Fish and garments moving from the 40% plus group to the 25 to 40% group.
c. Cultural services moving from the 10 to 25% group to the 25 to 40% group.
Download this chart Figure 4: Changes to the inflation rate have been driven mainly by changes within the higher import intensity groups and energy
Image .csv .xlsSince January 2014, the lower import intensity groups and owner occupiers’ housing costs have made a relatively stable contribution to the headline 12-month growth rate for CPIH. Changes to the inflation rate have been driven mainly by changes within the higher import intensity groups (25% to 40% and 40% plus) and energy. Since February 2017, the higher import intensive groups and energy have made a positive contribution to the overall growth rate of CPIH.
More recently, the contribution of energy to the 12-month growth rate of CPIH fell in January 2019 to 0.07 percentage points after the introduction of the constraint by Ofgem on energy prices. In April 2019, the cap for the default tariff increased by 10%, increasing the contribution of energy to 0.38 percentage points. Since April 2019, all import intensity groups have provided a relatively stable contribution to the 12-month growth rate of CPIH.
Nôl i'r tabl cynnwys5. The 12-month growth rate of input PPI was negative for the first time since June 2016
Following a period of sustained negative growth between November 2013 and June 2016, the 12-month growth rate in input producer prices rose considerably between July 2016 and January 2017, reaching a peak of 19.9% in January 2017. The 12-month growth rate of input Producer Price Index (PPI) has remained positive, until June 2019, when the 12-month growth rate became negative for the first time since June 2016.
Figure 5 shows the contributions of grouped components to the 12-month growth rate of input PPI between January 2014 and June 2019. It also shows the 12-month growth rate of the inverted sterling effective exchange rate over the same period.
Figure 5: The contribution from crude oil led to the 12-month growth rate of input PPI turning negative in June 2019
Contributions to the 12-month growth rate of input PPI and the inverted sterling effective exchange rate, UK, January 2014 to June 2019
Source: Office for National Statistics – Producer Price Index, Bank of England
Notes:
Home-produced components include: home-produced food and other home-produced material.
Imported components include: imported food; imported metals; imported chemicals; other imported parts or equipment; and other imported materials.
Download this chart Figure 5: The contribution from crude oil led to the 12-month growth rate of input PPI turning negative in June 2019
Image .csv .xlsCrude oil is a large contributor to input PPI accounting for 20% of the expenditure weight. Throughout most of the period graphed, crude oil has generally been the largest contributor to 12-month growth of input PPI. In June 2019 crude oil provided a contribution of negative 2.19 percentage points to the 12-month growth rate. In recent months, crude oil prices have been relatively volatile, falling by around 11% in the 12-months to June 2019. This volatility can be attributed to a range of factors including weaker global demand, political tensions in the Gulf, and the decision by the Organization of Petroleum Exporting Countries (OPEC), in December 2018, to cut production of crude oil, removing 1.2 million barrels a day from the market. This fall was partially offset by the 1.6% decrease in the sterling effective exchange rate over the same period, which all other things being equal would have lead to imports being more expensive.
Imports contribute the most to input PPI accounting for two thirds of the expenditure weight. Prices for imported components of input PPI are also generally more volatile (due to the exchange rate fluctuation) than those for home-produced components so imports are typically a significant driver of changes in the 12-month growth rate.
The 12-month growth rate of input PPI broadly follows similar trends to the inverted sterling effective exchange rate as imports become relatively more expensive when the value of sterling falls and relatively cheaper when the value of sterling increases. Domestic components of input PPI also show a similar, but more muted, trend, which may reflect some of these components being traded at global prices. Following the depreciation of sterling after June 2016, the imported components made a larger contribution to input PPI, increasing from a contribution of 1.69 percentage points in June 2016 to a peak of 7.73 percentage points in November 2016. This corresponded with an increase in the inverted sterling effective exchange rate shown on the graph.
Figure 6 shows price indices for the imported components of input PPI, between January 2014 and June 2019.
Figure 6: Imported components of input PPI have broadly followed changes in the inverted sterling effective exchange rate
Imported indices of input PPI and the inverted sterling effective exchange rate, UK, January 2014 to June 2019
Source: Office for National Statistics – Producer Price Index, Bank of England
Download this chart Figure 6: Imported components of input PPI have broadly followed changes in the inverted sterling effective exchange rate
Image .csv .xlsThe price movements of imported components have broadly followed changes in the inverted sterling effective exchange rates, with imported metals being the most volatile component. Imported metals account for around 15% of the expenditure weight of imported components (excluding crude oil and fuel components which include both home-produced and imported components) in input PPI. The appreciation of sterling in 2015 partially contributed to the fall in the price of imported metals with the price index falling to a low of 82.2 in December 2015. Following the depreciation of sterling in June 2016, the price of imported metals increased as imports became relatively more expensive. More recently, the 12-month growth rate of prices of imported metals has been driven by non-EU imports of precious metals.
Nôl i'r tabl cynnwys6. England experienced a fall in the growth rate of house prices in the 12-months to May 2018 and to May 2019
In May 2019, the 12-month growth rate in house prices was 1.2%, which is lower than in May 2018 and May 2017, where the 12-month growth rates were 3.1% and 4.2% respectively. Figure 7 shows the growth rate of UK house prices and the variation across UK countries.
Figure 7: UK house price growth has declined in the 12 months to May 2019, compared with the previous two years
12-month growth rate in house prices in the countries of the UK, and the UK, each May between 2017 and 2019
Source: Office for National Statistics, HM Land Registry - UK House Price Index
Download this chart Figure 7: UK house price growth has declined in the 12 months to May 2019, compared with the previous two years
Image .csv .xlsFor each month shown on the chart, England has made up around 83% to 84% of UK House Price Index (HPI), meaning that the trend shown for the UK largely reflects movements in house price growth in England. The 12-month growth rate of house prices in England fell from 4.6% in May 2017 to 2.8% in May 2018, and then to 1.0% in May 2019.
Scotland, Wales and Northern Ireland show a different trend, where the 12-month growth rate increased between May 2017 and May 2018, before decreasing in May 2019. These differences reflect a range of market factors and devolved housing policies such as Stamp Duty.
For example, the annual house price in Wales has constantly outpaced the UK growth rate since May 2018. Previous analysis has linked this to the increased demand for properties on the Welsh side of the Severn Estuary since it was announced, in July 2017, that tolls would be removed from the M48 Severn Bridge and the M4 Prince of Wales Bridge, which took effect in December 2018.
Additionally, house price growth in Wales may also reflect tax changes introduced in 2018. From 1 April 2018, the Welsh Government replaced Stamp Duty with the Land Transaction Tax, leading to properties purchased in Wales being subject to different rates of tax than properties of the same value purchased in England.
The fall in the 12-month growth rate of house prices in England to May 2018 and to May 2019 is consistent within grouped English regions, as shown in Figure 8.
Figure 8: Each grouped region saw a year-on-year fall in house price growth
12-month growth rate in house prices in grouped regions of England, each May between 2017 and 2019
Source: Office for National Statistics, HM Land Registry – UK House Price Index
Notes:
- The North includes the North East, the North West and Yorkshire and the Humber.
- The Midlands includes the East Midlands and the West Midlands.
- The South includes the East of England, the South West and the South East.
Download this chart Figure 8: Each grouped region saw a year-on-year fall in house price growth
Image .csv .xlsThe decrease in the 12-month growth rate of house prices is most prominent in London where prices have been decreasing on the year since March 2018. From May 2017 to May 2019, the 12-month growth rate of house prices in London fell by 7.26 percentage points to negative 4.4%; its lowest rate since August 2009. Previous analysis presents descriptive charts on the slowdown of house price growth within London.
The Bank of England has noted in their latest inflation report that affordability constraints in London and other southern regions led to a more pronounced slowdown in house price growth (PDF 3.84MB), and that the London housing market has probably been disproportionately affected by regulatory and tax changes (PDF, 5.0MB).
London, the South east and the East of England collectively have a collective weight of around 34% of the UK HPI. Previous analysis has shown that weak or negative house price growth in these regions have had a downward pull on UK HPI in recent months. Across all regions, the most pronounced fall in property prices has been for flats, which in London account for just over half of property sales in 2018.
Nôl i'r tabl cynnwys