Cynnwys
- Main points
- Statistician’s comment
- Summary
- Transport largely drove movements in the 12-month growth rate of CPIH in 2018, reflecting changing world prices for crude oil
- Crude oil largely drove movements in the 12-month growth rate of input and output PPI in 2018
- Average property price increases since January 2018 have been relatively muted compared with previous years
- Authors
1. Main points
The 12-month growth rate of the Consumer Prices Index including owner occupiers’ housing costs (CPIH) was 2.0% in December 2018, down from 2.2% in November 2018.
The input Producer Price Index (input PPI) grew by 3.7% in the 12 months to December 2018, slowing from 5.3% in the 12 months to November 2018.
The output Producer Price Index (output PPI) grew by 2.5% in the 12 months to December 2018, down from 3.0% in the 12 months to November 2018.
Over the course of 2018, transport largely drove changes in the 12-month growth rate of CPIH, with fuels and lubricants moving broadly in line with changes in world prices for crude oil.
Crude oil prices also largely drove movements in the 12-month growth rates for input and output PPI in 2018 and almost entirely explain the fall in the 12-month growth rate for input PPI between November and December 2018.
While following similar seasonal trends, average house prices for Great Britain in the year to November 2018 have increased by less than seen over the same period in previous years.
2. Statistician’s comment
Commenting on today’s inflation figures, Head of Inflation Mike Hardie said:
“Inflation eased mainly due to a big fall in petrol, with oil prices tumbling in recent months. Air fares also helped push down the rate, with seasonal prices rising less than they did last year. These were partially offset by small rises in hotel prices and mobile phone charges.
“House price growth was little changed in the year to November with buoyant growth across much of the UK held back by London and the South East.”
Nôl i'r tabl cynnwys3. Summary
Figure 1 shows that the 12-month growth rate of the Consumer Prices Index including owner occupiers’ housing costs (CPIH) was 2.0% in December 2018, down from 2.2% in November 2018.
The largest downward contributions to the change in the 12-month rate came from falls in petrol prices and from air fares, where the latter rose between November and December 2018 but by less than a year ago. These downward effects were offset by upward contributions from a variety of categories including accommodation services and, to a lesser extent, mobile phone charges, games, toys and hobbies, and food.
The input Producer Price Index (input PPI) grew by 3.7% in the 12 months to December 2018, slowing from 5.3% in the 12 months to November 2018. All product groups made an upward contribution to the annual rate. However, the fall in the 12-month growth rate is almost entirely explained by crude oil, which made the smallest upward contribution to the 12-month growth rate of any component of input PPI in December 2018, having previously made the highest contribution to the 12-month growth rate in every other month of 2018.
The output Producer Price Index (output PPI) grew by 2.5% in the 12 months to December 2018, down from 3.0% in the 12 months to November 2018. The fall in the 12-month growth rate was largely driven by petroleum products.
Figure 1: 12-month growth rates for input Producer Price Index (PPI) (left-hand side), output PPI (left-hand side), and Consumer Prices Index including owner occupiers' housing costs (CPIH) (right-hand side)
UK, December 2009 to December 2018

Source: Office for National Statistics
Notes:
- These data are also available within the Dashboard: Understanding the UK economy.
Download this image Figure 1: 12-month growth rates for input Producer Price Index (PPI) (left-hand side), output PPI (left-hand side), and Consumer Prices Index including owner occupiers' housing costs (CPIH) (right-hand side)
.png (27.5 kB) .xlsx (23.7 kB)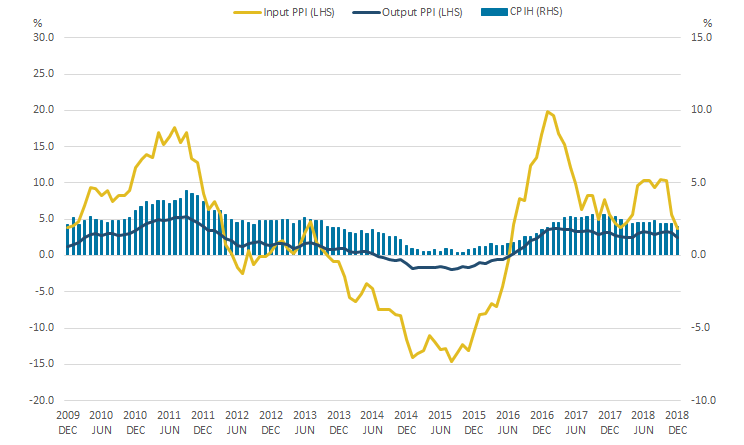
4. Transport largely drove movements in the 12-month growth rate of CPIH in 2018, reflecting changing world prices for crude oil
Figure 2 shows contributions to the 12-month growth rate of the Consumer Prices Index including owner occupiers’ housing costs (CPIH) for each month of 2018. Food and non-alcoholic beverages, and clothing and footwear have made decreasing contributions to the 12-month growth rate of CPIH over the course of the year with clothing and footwear making a negative contribution in recent months.
The falling contribution from food and non-alcoholic beverages has been driven in large part by meat, with downward contributions also coming from the components milk, cheese and eggs, and coffee, tea and cocoa. The negative contribution from clothing and footwear is largely a reflection of base effects with prices in recent months being slightly lower than they were the same time a year ago.
Figure 2: Contributions to the 12-month growth rate of CPIH
UK, January 2018 to December 2018
Source: Office for National Statistics
Notes:
Contributions may not sum due to rounding.
The “other” component includes: alcoholic beverages and tobacco; furniture, household equipment and routine maintenance; health; communication; education and miscellaneous goods and services.
Download this chart Figure 2: Contributions to the 12-month growth rate of CPIH
Image .csv .xlsTransport saw the largest variation in its contribution to the 12-month growth rate of CPIH in 2018, rising sharply from a contribution of 0.30 percentage points in April 2018 to 0.75 percentage points in August 2018 before falling back to a contribution of 0.41 percentage points in December 2018. This movement was largely driven by fuels and lubricants, prices for which tend to move broadly in line with changes in world prices for crude oil, which have been falling in recent months. Other components of transport saw more price variation but had less impact on the 12-month growth rate due to their lower weight within the inflation basket.
Housing, water, electricity, gas and other fuels made an increasing contribution to the 12-month growth rate of CPIH over much of 2018, rising from a contribution of 0.47 percentage points in May 2018 to 0.62 percentage points in December 2018. This increase was largely driven by increasing contributions from the electricity, gas and other fuels component. Gas and electricity prices rose by around 7% and 9%, respectively, between January and December 2018. As with fuels and lubricants, energy prices are driven to a large extent by movements in world prices, as well as seasonal patterns for gas and electricity prices.
Nôl i'r tabl cynnwys5. Crude oil largely drove movements in the 12-month growth rate of input and output PPI in 2018
Figure 3 shows contributions to the 12-month growth rate of input Producer Price Index (input PPI) for each month of 2018. Crude oil typically makes the largest contribution to the 12-month growth rate of input PPI as prices for crude oil vary to a much larger degree than the other components of input PPI, as well as having a relatively large weight. The contribution from crude oil increased rapidly from 1.45 percentage points in February 2018 to 6.99 percentage points in June 2018. It remained relatively stable between June and October 2018 before falling sharply to 2.18 percentage points in November 2018 and only 0.07 percentage points in December 2018.
Figure 3: Contributions to the 12-month growth rate of input PPI
UK, January 2018 to December 2018
Source: Office for National Statistics
Notes:
Contributions may not add up to the rate due to rounding.
The “other” component includes: fuel (including Climate Change Levy); other home produced material and home produced food.
Download this chart Figure 3: Contributions to the 12-month growth rate of input PPI
Image .csv .xlsThis rise and fall in the contribution of crude oil to the 12-month growth rate of input PPI largely reflects movements in the barrel price of crude oil, which grew from $63 per barrel in February 2018 to $77 per barrel in October 2018 before falling sharply to $54 per barrel in December 2018.
The effect of oil price movements is also influenced by the exchange rate as world prices for crude oil are set in US dollars. The value of sterling against the US dollar fell between September and December 2018 so the fall in crude oil prices within input PPI has been more muted than the fall in world prices for crude oil over that period. Nonetheless, the contribution from crude oil has fallen to such an extent that it made the lowest contribution of any component to the 12-month growth rate of input PPI in December, having made the largest contribution of any component in every other month of 2018. This effect of the lower value of sterling is also reflected in price movements for other imported components of input PPI, all of which increased between November and December 2018.
Figure 4: Contributions to the 12-month growth rate of output PPI
UK, January 2018 to December 2018
Source: Office for National Statistics
Notes:
Contributions may not add up to the rate due to rounding.
The “other” component includes: alcohol and tobacco; paper and printing products; computers, electrical and optical equipment and other manufactured products.
Download this chart Figure 4: Contributions to the 12-month growth rate of output PPI
Image .csv .xlsFigure 4 shows contributions to the 12-month growth rate for output Producer Price Index (output PPI) for each month of 2018. In line with the picture from input PPI, the largest change in contributions to output PPI has come from coke and refined petroleum products, which also reflect movements in crude oil prices. The effect of these movements is more muted in output PPI as the output price includes duty, which makes up a relatively large proportion of the output price; as such, even large changes in the price of crude oil have less effect on the end price of petroleum products including duty. This more muted movement may also reflect pricing decisions if producers choose not to pass on the full effect of cost changes to customers.
The contribution to the 12-month growth rate from food products has also changed considerably over the course of 2018, falling from a contribution of 0.76 percentage points in January 2018 to only 0.10 percentage points in December 2018. This falling contribution is partly due to base effects as prices for food products grew relatively slowly during 2018 compared with the increases seen over the course of 2017.
Contributions from other components of output PPI remained relatively stable over 2018.
Nôl i'r tabl cynnwys6. Average property price increases since January 2018 have been relatively muted compared with previous years
Figure 5 shows movements in average house prices for Great Britain between January 2012 and November 2018. Prices have been indexed to January for each year to show how average house prices moved during the year and highlight any seasonal patterns from year to year.
In the year to November 2018, average house prices increased by around 2.8%. This is lower than price increases seen over the same period in five of the last six years and is only slightly higher than the price increase seen in 2012, when house price growth was still relatively low following the financial crisis.
Figure 5: Movement in average house prices across the year
Great Britain, January 2012 to November 2018
Source: Office for National Statistics, HM Land Registry
Download this chart Figure 5: Movement in average house prices across the year
Image .csv .xlsTrends in average house price movements appear to follow seasonal patterns with prices remaining relatively flat, or falling slightly, at the beginning of the year before rising during the summer and tailing off again towards the end of the year. Average house prices fell slightly for the third consecutive month in November 2018 while in five of the previous six years average prices rose at least once between September and November.
Recent falls in average house prices are driven in large part by London where average prices in November 2018 are estimated to have been lower than they were in January 2018. Figure 6 shows movements in average house prices for Scotland, Wales, Northern Ireland and selected regions of England. Figure 6 shows similar seasonal patterns to those seen at Great Britain level in Figure 5 but also shows considerable variation in the scale of house price growth between the different countries and regions of the UK.
Figure 6: Movement in average house prices for Scotland, Wales, Northern Ireland and selected regions of England
January 2018 to November 2018
Source: Office for National Statistics, HM Land Registry
Notes:
- Northern Ireland data are only available on a quarterly basis. Northern Ireland data are copied forward until the next quarter's data are available.
Download this chart Figure 6: Movement in average house prices for Scotland, Wales, Northern Ireland and selected regions of England
Image .csv .xlsAverage house prices in London saw the lowest increase of anywhere in the UK in the year to November 2018, rising by a little over 1% between January and July 2018 before falling back to a low point in November 2018 where average prices were over 1% lower than at the start of the year. This continues the recent trend of weak or negative house price growth in London, with 8 of the last 11 months having negative 12-month growth rates for average house prices. Previous analysis has explored recent trends in the London housing market. Relatively low house price growth was also seen in the South East, which may reflect trends radiating outwards from London.
Yorkshire and The Humber saw the highest increase in average house prices in 2018, with prices rising by around 5.6% between January and August 2018 before falling back, with prices in November being around 2.8% higher than in January 2018.
Both Wales and the West Midlands had their highest average prices of the year in November, with prices rising by 5.5% and 5.3%, respectively, from January. Average house price increases in Wales may reflect increased demand for properties close to the Severn Estuary since the announcement of the removal of tolls on the M48 Severn Bridge and the M4 Prince of Wales Bridge. Average property prices are typically higher on the English side of the estuary than on the Welsh side so buyers may be incentivised to buy property in Wales and commute once the bridge tolls are removed.
Nôl i'r tabl cynnwysManylion cyswllt ar gyfer y Erthygl
Related publications
- Index of Private Housing Rental Prices, UK: December 2018
- Consumer price inflation, UK: December 2018
- Private rental growth measures, a UK comparison: October to December 2018
- Producer price inflation, UK: December 2018
- Services producer price inflation, UK: October to December 2018
- UK House Price Index: November 2018