Cynnwys
- Main points
- Statistician's comment
- Changes to publication schedule for economic statistics
- The 12-month growth rates for producer and consumer price indices in December 2016 were all stronger than the previous month
- A range of input producer prices continue to be associated with changes in the sterling exchange rate
- Increased producer prices have started to feed into higher prices for consumers in some areas
- Rental prices are more stable and tend to lag changes in house prices across England
1. Main points
Consumer and producer prices
- Inflation rose in December 2016, in part as recent rises in producer prices were passed onto consumers.
- Producer input, output and consumer prices are all showing an increase in the 12-month growth rate between December 2015 and December 2016 compared with the 12-month growth rate for November 2016.
House prices and rental prices
- Average house prices in the UK grew by 6.7% between November 2015 and November 2016. This is lower than the 12-month growth rates seen in the first half of 2016, but in line with rates seen in the second half of the year.
- Growth in house prices and rental prices varies across the UK and regions of England, but there is a relatively close correlation between house prices and lagged rental price growth in each English region.
2. Statistician's comment
Commenting on today’s inflation figures, ONS Head of Inflation Mike Prestwood said:
“This is the highest CPI has been for over two years, though the annual rate remains below the Bank of England’s target and low by historical standards.
Rising airfares and food prices, along with petrol prices falling less than last December, all helped to push up the rate of inflation.
Rising raw material costs also continued to push up the prices of goods leaving factories.”
Nôl i'r tabl cynnwys3. Changes to publication schedule for economic statistics
ONS introduced its new economic "theme days" in January, which will ensure that related economic statistics are released together.
This article updates previous analysis of the Producer Price Index (PPI) and Consumer Prices Index (CPI) and will be published each month alongside the statistical bulletins released on Prices theme day1. These currently are:
UK producer price inflation: Dec 2016
UK consumer price inflation: Dec 2016
Index of private housing rental prices (IPHRP) in Great Britain, results: Dec 2016
UK house price index: Nov 2016
Updated analysis of the contributions to the 12-month growth rate for input and output producer prices and the contributions to the 12-month CPI growth rate by import intensity of products is available in the data tables associated with this release.
Notes for: Changes to publication schedule for economic statistics
- Services Producer Prices (SPPI) will be included in the theme day from May 2017
4. The 12-month growth rates for producer and consumer price indices in December 2016 were all stronger than the previous month
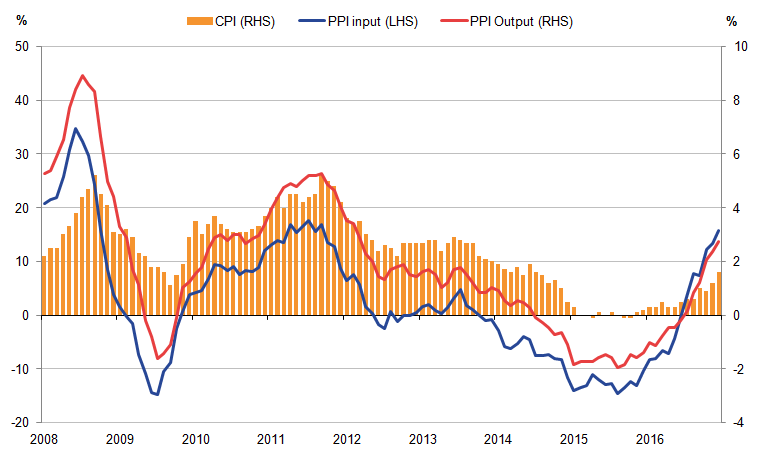
Figure 1 shows that PPI input (left hand scale) and PPI output indices (right hand scale) move in broadly similar ways over time, although the movement in PPI input prices is considerably greater than for manufacturers’ output prices. Input PPI has increased by 15.8% between December 2015 and December 2016. This is mainly as a result of falling prices a year ago, as growth was relatively flat on the month. Output prices have risen by 2.7% between December 2015 and December 2016, the highest annual rate since March 2012.
Figure 1 also shows that consumer price inflation, measured by the CPI, has generally followed the direction of change in producer output and input prices. Periods of deflation in producer prices have coincided with periods of historically low consumer price inflation. Moving in the same direction as recent growth in producer input and output prices, the latest period shows CPI increased by 1.6% for the 12 months to December 2016, up from 1.2% in November 2016.
Figure 1: Annual growth for PPI input (left hand axis), PPI output and CPI (right hand axis)
UK, January 2008 to December 2016
Source: Office for National Statistics
Notes:
- These data are also available within the Dashboard: assessing the post-referendum UK Economy.
Download this image Figure 1: Annual growth for PPI input (left hand axis), PPI output and CPI (right hand axis)
.png (34.3 kB) .xls (34.8 kB)
5. A range of input producer prices continue to be associated with changes in the sterling exchange rate
Figure 2 shows the input Producer Price Index (PPI) for selected products, plotted against the path of the inverted, effective sterling exchange rate between 2010 and 2016.
Figure 2: Inverted sterling effective exchange rate (right hand axis) and selected input Producer Price Indices (left hand axis), by product
UK, 2010 to 2016

Source: Office for National Statistics, Bank of England
Notes:
- Each series is the input price index for the manufacture of that product. For example, the price series for imported metals includes the cost of imported materials used by UK metal manufactures.
- These data are available in Table 7 of UK Producer Price Inflation datasets.
Download this image Figure 2: Inverted sterling effective exchange rate (right hand axis) and selected input Producer Price Indices (left hand axis), by product
.png (35.4 kB) .xls (27.1 kB)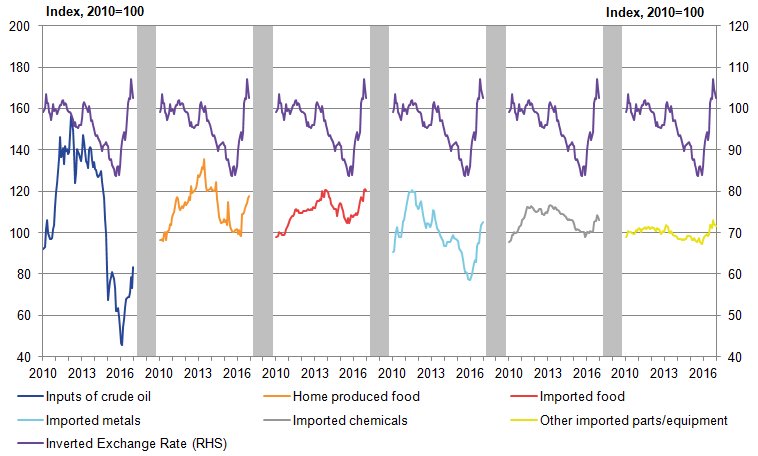
The price paths of the inputs used to produce commodity-based outputs such as oil and metal products appear to be more closely correlated to changes in the exchange rate than prices faced by the producers of other parts and equipment. Prices faced by crude oil manufacturers are also seen to be more volatile than the other indices and this can be attributed to both changes in the price of oil and also to movements in the exchange rate.
Previous analysis by ONS of the recent rise in dollar and sterling oil prices can help explain the upward pressure on the crude oil input PPI series. This series includes both imported and domestically produced inputs and is the largest single component of the overall input PPI index, with a weight of around 20%. Imported inputs make up around two-thirds of this aggregate series, and therefore the exchange rate is having a relatively strong influence on overall input PPI growth.
In contrast, the price paths of the inputs used in the manufacture of other parts and equipment such as motor vehicles are seen to be less correlated with movements in the sterling effective exchange rate compared with other input PPI series. The manufacture of these goods uses a wider range of intermediate inputs than needed for the production of more commodity-based outputs. Overseas pricing strategy, competition and supply chain relationships as well as the exchange rate will therefore have a range of effects on input prices for these products and may be reducing the correlation between these series and the effective sterling exchange rate.
Nôl i'r tabl cynnwys6. Increased producer prices have started to feed into higher prices for consumers in some areas
As seen previously in Figure 2, input prices for both crude oil and imported food products have seen large increases in the last few months. This may be starting to feed into certain components of the CPI.
Figure 3 shows headline CPI growth, a selection of goods and services from CPI and the growth in the value of sterling (measured by the inverted effective exchange rate index). Twelve-month growth rates for energy prices – including electricity, gas, other household fuels and fuels and lubricants used in transport equipment (primarily petrol and diesel prices) – faced by consumers in particular have been positive in each of the last 3 months.
As shown in previous analysis by ONS, the recent increase in input prices for crude oil products has begun to feed into increased output producer prices for refined petroleum products. This has subsequently fed into higher consumer prices for fuels and lubricants, which makes up around half of the energy component shown in Figure 3.
Figure 3: 12-month growth rate for the inverted sterling effective exchange rate, and headline CPI, food, and energy
UK, January 2014 to December 2016
Source: Office for National Statistics, Bank of England
Notes:
- The food category reflects Group 01.1 Food within the Classification of Individual Consumption According to Purpose (COICOP). Energy includes electricity, gas and other household fuels as well as fuels and lubricants for motor vehicles.
Download this chart Figure 3: 12-month growth rate for the inverted sterling effective exchange rate, and headline CPI, food, and energy
Image .csv .xlsAlongside the positive growth in energy prices in the last 3 months, food price deflation has moderated. This has led to a reduced negative contribution to headline CPI from food prices. As seen in Figure 2, the input producer prices for food have been increasing in the last few months, so this may now be feeding into food manufacturer output prices and consumer prices for food products.
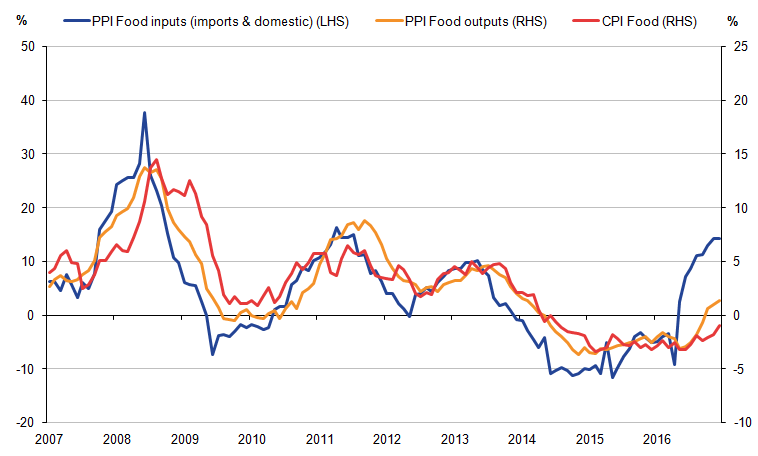
Figure 4 shows that there is a clear relationship between input producer prices for food (both domestic and imported) shown on the left-hand scale, output producer prices for food and consumer prices for food, both shown on the right-hand scale. During the period from January 2007, input producer prices for food tend to change first (and to a greater extent), followed by output producer prices and then finally consumer prices.
Figure 4: 12-month growth in input PPI for food products (left hand axis), output PPI for food products and food component of CPI (right hand axis)
UK, January 2007 to December 2016
Source: Office for National Statistics
Download this image Figure 4: 12-month growth in input PPI for food products (left hand axis), output PPI for food products and food component of CPI (right hand axis)
.png (29.9 kB) .xls (38.4 kB)
The food component in CPI includes both non-manufactured (for example, fresh fruit) and manufactured food (for example, ready meals). This means that the price of food faced by consumers could also be directly affected by the depreciation of sterling putting upward price pressure on imported non-manufactured food. However, it is also possible that annual falls in food prices may be slowing as the effects from previous years (such as supermarket price wars) may be lessening. The smaller negative contribution from food could therefore also be a base effect.
Nôl i'r tabl cynnwys7. Rental prices are more stable and tend to lag changes in house prices across England
House prices for the UK rose by 6.7% between November 2015 and November 2016. This compares with average rental prices in Great Britain, which rose 2.3% over the same period. The latest average rental price growth for the 12 months to December 2016 is also 2.3%.
Changes in house prices are thought to partially determine movements in private rental prices, with rents required to generate a competitive yield against the purchase price of the property compared with other sources of income for landlords.
Figure 5 shows the 12-month growth rate of the House Price Index (HPI) on the left-hand scale and the Index of Private Housing Rental Prices (IPHRP) on the right-hand scale for England between January 2006 and October 2015. This is the latest comparable period that the data are available as the IPHRP data for December 2016 has been lagged by 14 months to October 20151.
Figure 5: Comparison of annual growth in HPI (left hand axis) and IPHRP (lagged 14 months) (right hand axis)
England, January 2006 and October 2015

Source: Office for National Statistics, Land Registry
Download this image Figure 5: Comparison of annual growth in HPI (left hand axis) and IPHRP (lagged 14 months) (right hand axis)
.png (19.1 kB) .xls (24.6 kB)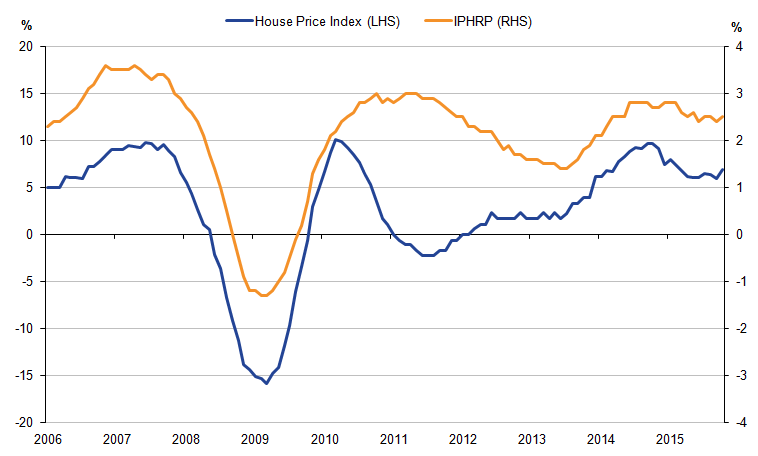
Adjusting for the 14-month lag, the movements in the IPHRP closely track movements in the HPI until a divergence occurs from March 2010 to early 2013. This divergence may reflect changing housing tenure patterns, with increases in the proportion of households renting properties. In turn, this might reflect credit constraints arising from limited mortgage availability or wider economic and social changes (Annex C – Improvements to the measurement of owner occupiers’ housing costs and private housing rental prices). The divergence began to reduce during 2012 and as the HPI began to rise in 2013 the positive association between the 2 series can be seen again.
Analysis of the same data for the constituent regions of England show similar results. Over the period from January 2006 to October 2015, the correlation coefficient for the HPI and IPHRP for English regions ranges from 0.92 for the East of England to 0.64 for the North East. Fourteen-month lags produced the highest overall correlation coefficient values for each region excluding the North East. This period is in line with the assumed validity period of 14 months in IPHRP. The correlation coefficient for the HPI and lagged IPHRP series for London is 0.71, which is a lower value than most other English regions. This is because the magnitude of the divergence between the 2 series from mid-2010 to early-2013 was much greater in London than for the other regions. The correlation coefficient does increase, however, to 0.90 for the period from August 2013 to October 2015.
Notes for: Rental prices are more stable and tend to lag changes in house prices across England
- The 14-month lag period allows for the flow of rental properties to change contract terms. Previous analysis by ONS also considers a 14 months lag to be the appropriate validity period when calculating the rental equivalence measure of owner occupiers’ housing costs (OOH) in CPIH.