Cynnwys
1. Main points
The 12-month growth rate for the Consumer Prices Index including owner occupiers’ housing costs (CPIH) has remained flat at 2.8% for the third consecutive month, while the growth rate for the Consumer Prices Index (CPI) – which does not include owner occupiers’ housing costs – has risen slightly to 3.1%.
The 12-month growth rate for the input Producer Price Index has risen to 7.3%, from 4.8% in October 2017; recent increases have been driven by an increasing contribution from crude oil.
The London property market has continued to grow at a slower rate in comparison with the UK as a whole since mid-2015, with transactions for both remaining relatively flat since May 2016.
2. Statistician’s comment
Commenting on today's inflation figures, ONS Head of Inflation Mike Prestwood said:
"CPI inflation edged above 3% for the first time in nearly six years, with the price of computer games rising and airfares falling more slowly than this time last year. These upward pressures were partly offset by falling costs of computer equipment.
"The prices of raw materials and goods leaving factories continued to increase as oil and petrol prices continued to rise.
"Annual rises in house prices and rents continued to slow, with London seeing house price falls for the second month running."
Nôl i'r tabl cynnwys3. Summary
The Consumer Prices Index (CPI) 12-month growth rate edged up slightly to 3.1% in November 2017. This is significant as it means that the Governor of the Bank of England is required to write a letter to the Chancellor of the Exchequer to explain why the CPI is more than 1 percentage point above the inflation target, which has been set by the government.
The reason that CPI has moved above the 2% target, and the Consumer Prices Index including owner occupiers’ housing costs (CPIH) – the Office for National Statistics’ lead measure of inflation – remains at 2.8%, is explored in Section 4 of this article.
In summary, the CPIH extends the goods and services included within CPI to also incorporate a measure of owner occupiers’ housing costs. These are the costs of housing services associated with owning, maintaining and living in one’s home. These have shown weaker growth than other areas of the basket of goods and services that are covered in both the CPI and the CPIH. This has a direct dampening effect on CPIH, and also an indirect effect because it reduces the weight applied to other components that may otherwise push up the growth rate, such as airfares this month.
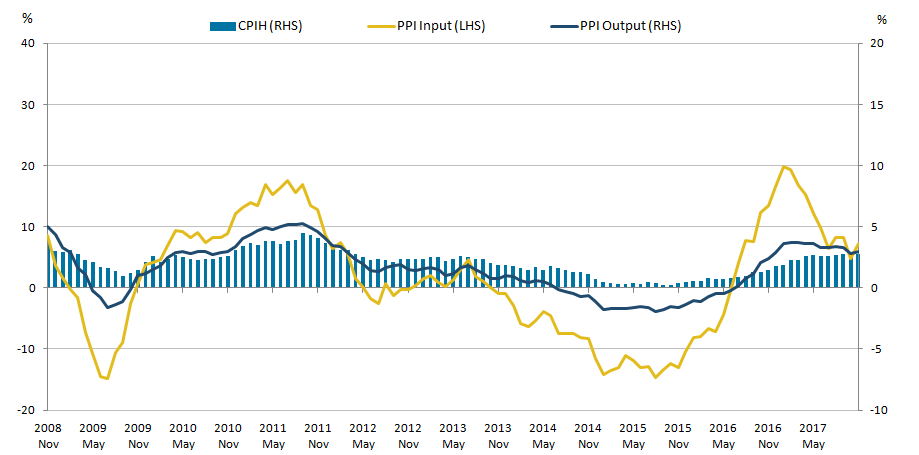
Figure 1 shows the 12-month growth in the Consumer Prices Index including owner occupiers’ housing costs (CPIH) remained unchanged at 2.8% in November 2017. The input Producer Price Index (input PPI) grew by 7.3% in the 12 months to November 2017, up from 4.8% in the 12 months to October 2017. The output Producer Price Index (output PPI) grew by 3.0% in the 12 months to November 2017, up from 2.8% in the 12 months to October 2017.
Figure 1: Annual growth rate for Producer Price Index (PPI) input (left-hand side), PPI output and Consumer Prices Index including owner occupiers' housing costs (CPIH) (right-hand side)
UK, November 2008 to November 2017
Source: Office for National Statistics
Notes:
- These data are also available within the Dashboard: Understanding the UK economy.
Download this image Figure 1: Annual growth rate for Producer Price Index (PPI) input (left-hand side), PPI output and Consumer Prices Index including owner occupiers' housing costs (CPIH) (right-hand side)
.png (28.4 kB) .xls (30.7 kB)
Data tables accompanying this commentary include contributions to the 12-month growth rate of output PPI and input PPI, and contributions to the 12-month growth rate of CPIH and CPI by import intensity of goods and services.
Nôl i'r tabl cynnwys4. Differences between CPI and CPIH reflect movements in owner occupiers’ housing costs
Figure 2 shows the 12-month growth rate in the Consumer Prices Index including owner occupiers’ housing costs (CPIH), the Consumer Prices Index (CPI) and owner occupiers’ housing costs (OOH). OOH are the costs of housing services associated with owning, maintaining and living in one’s home. OOH and Council Tax payments are present in CPIH but are excluded from the CPI measure.
The inclusion of OOH and Council Tax causes the “housing, water, electricity, gas and other fuels” component to have a higher expenditure weight in CPIH compared with CPI, and consequently the contributions from this category are generally higher for CPIH compared with CPI.
Figure 2: 12-month growth rates in the Consumer Prices Index (CPI), the Consumer Prices Index including owner occupiers’ housing costs (CPIH) and owner occupiers’ housing costs (OOH)
UK, January 2008 to November 2017
Source: Office for National Statistics
Download this chart Figure 2: 12-month growth rates in the Consumer Prices Index (CPI), the Consumer Prices Index including owner occupiers’ housing costs (CPIH) and owner occupiers’ housing costs (OOH)
Image .csv .xlsFigure 2 illustrates that when the OOH 12-month growth rate is less than the CPI 12-month rate, as was the case between April 2008 and July 2014, CPIH also grows at a lower rate than CPI. Conversely, when OOH are growing at a faster rate than the CPI, as was the case between August 2014 and March 2017, it has an upward effect that pushes the CPIH 12-month rate above that of the CPI.
Since April 2017, OOH have been growing more slowly than CPI, resulting in the CPI 12-month rate being above that of CPIH. In November 2017, the 12-month rate of CPI was 3.1% while CPIH was 2.8% and owner occupiers’ housing costs grew by 1.5%.
Figures 3a and 3b present the contributions to the 12-month rate of CPI and CPIH from selected components. The dark blue bars represent the “housing, water, electricity, gas and other fuels” component and highlight the difference that the inclusion of owner occupiers’ housing costs makes to CPIH. This difference has been particularly pronounced since early 2015, with the broader component having little or no impact on CPI, while the inclusion of OOH and Council Tax meant that the component contributed between 0.3 and 0.7 percentage points to the CPIH 12-month growth rate.
Figure 3a: Contributions to the Consumer Prices Index including owner occupiers’ housing costs (CPIH) 12-month growth rate
UK, January 2008 to November 2017
Source: Office for National Statistics
Download this chart Figure 3a: Contributions to the Consumer Prices Index including owner occupiers’ housing costs (CPIH) 12-month growth rate
Image .csv .xlsFigure 3b: Contributions to the Consumer Prices Index (CPI) 12-month growth rate
UK, January 2008 to November 2017
Source: Office for National Statistics
Download this chart Figure 3b: Contributions to the Consumer Prices Index (CPI) 12-month growth rate
Image .csv .xlsBoth measures of inflation have been broadly increasing since autumn 2015, with the 12-month growth rate of CPIH being higher than CPI until February 2017. The inclusion of owner occupiers’ housing costs and Council Tax have a direct effect on CPIH but they also result in other components having a lower weight within the index. This means that the effects of other drivers of price growth, such as food and energy prices, can be more muted.
For example, following the referendum in June 2016 on the UK’s exit from the EU the value of sterling fell, putting upward pressure on the cost of those goods and services imported into the UK. The effect of the different expenditure weighting applied to non-housing components can be seen in the way these exchange rate effects feed through into CPI and CPIH respectively. Transport, a relatively import-intensive category, has consistently made a higher contribution to headline CPI compared with CPIH in the period since July 2016. However, for the period from late 2014 to June 2016, transport had a downward pull on both CPI and CPIH, but the downward pull on CPI was greater due to its larger expenditure weight.
The differences between CPI and CPIH are therefore seen in both the direct effect of owner occupiers’ housing costs, which have had a dampening effect recently on CPIH, and in the indirect effect of reducing the weight applied to other components that may otherwise push up the growth rate, such as imported goods. This can partly explain the difference in the rate of change of CPI and CPIH, with CPI having increased by 3.2 percentage points between October 2015 and November 2017, while CPIH has only increased by 2.6 percentage points over the same period.
Nôl i'r tabl cynnwys5. Input PPI is being driven by world prices for crude oil and exchange rates
Figure 4 shows the contribution that different components of the input Producer Price Index (PPI) have made to the headline 12-month rate between March 2013 and November 2017. It also shows 12-month growth rates in the inverted sterling effective exchange rate (ERI) and the dollar price of Brent crude oil over the same period.
Following a period of sustained increases, the 12-month growth rate in input PPI has generally been weakening, from a peak of 20.1% in January 2017 to a recent low of 4.8% in October 2017. It has risen again in the most recent month, to 7.3% in November 2017. These recent changes are driven mainly by the contributions of crude oil to the headline rate. These fell over much of the first half of 2017, reflecting a gradual strengthening of sterling and falling flat world prices for Brent crude oil. However, the contribution increased slightly in November 2017, reflecting the gradual increases in crude oil prices over the second half of 2017.
More generally, crude oil has tended to make a large contribution to the input PPI rate – both positive and negative – over the whole period since March 2013. Between March 2013 and June 2016, this meant that headline input PPI was following a broadly similar trend to the US dollar price for Brent crude oil. However, following the sharp depreciation of sterling in the period since June 2016, other components have made a larger contribution to input PPI, most notably imported components.
For example, imported metals contributed only 0.9 percentage points to input PPI in July 2016, but at its peak contributed 2.6 percentage points to input PPI in January 2017. In the most recent month, as the contribution from crude oil has increased, other components have again contributed less to the aggregate measure. The PPI bulletin this month includes some additional analysis on metal prices.
Figure 4: Contributions to input Producer Price Index (PPI) (left-hand side), sterling effective exchange rates (ERI) (left-hand side) and Brent crude oil (US dollars) (right-hand side)
UK, March 2013 to November 2017
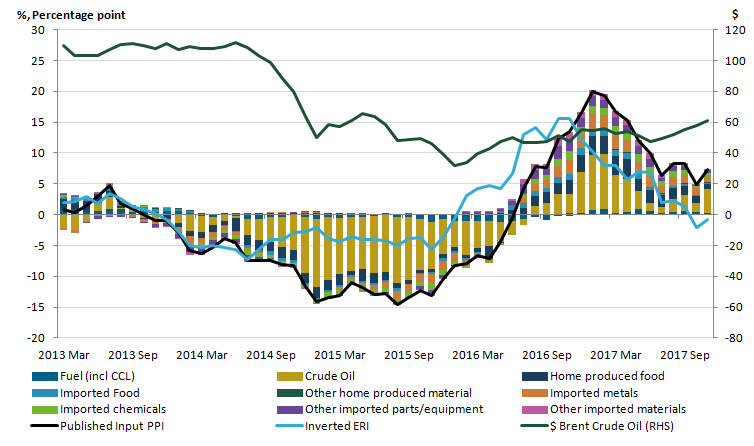
Source: Office for National Statistics, Bank of England, Financial Times
Download this image Figure 4: Contributions to input Producer Price Index (PPI) (left-hand side), sterling effective exchange rates (ERI) (left-hand side) and Brent crude oil (US dollars) (right-hand side)
.png (41.5 kB) .xls (41.0 kB)
6. Trends in property transactions remained lower in London than the UK as a whole since April 2016
Figure 5 shows the long-term trend in the volume of property transactions in London and the UK as a whole, indexed to January 2005.
Property transactions for both series have followed broadly consistent trends over the majority of the period. In mid-2015, the volume of property transactions in London began to slow compared with the UK as a whole. Apart from the spike in March 2016, associated with the introduction of higher tax rates on additional properties introduced from 1 April 2016, this gap has been maintained over the period. In particular, the spike in March was followed by a sharp fall in transactions in April 2016, when the new charges came into force, however, both the spike and subsequent dip were more pronounced in London than in the UK as a whole.
Since April 2016, transaction volumes have also recovered more quickly in the UK as a whole than in London, with the gap that emerged in mid-2015 being sustained over the period since. In June 2017, the most recent month for which complete data are available, the volume of transactions in London was only 2.7% higher than in January 2005, while for the UK as a whole the volume of transactions was 44.0% higher.
Figure 5: Volumes of property transactions
UK and London, January 2005 to June 2017
Source: UK House Price Index, Office for National Statistics
Notes:
- Volume of transaction data for recent months are omitted due to incomplete data. The most recent month presented is June 2017.
Download this chart Figure 5: Volumes of property transactions
Image .csv .xlsFigure 6 shows the 12-month growth rate in property transactions compared with the 12-month growth in average prices in the London region. The growth rate of London house prices has been moved back five months, as previous trends suggest that there is a lag of around five months before trends in property transactions feed through to price growth.
Figure 6: London 12-month growth rate in property transactions (left-hand side) and average house prices (moved backwards five months) (right-hand side)
London, January 2006 to March 2017
Source: Office for National Statistics, Land Registry
Download this chart Figure 6: London 12-month growth rate in property transactions (left-hand side) and average house prices (moved backwards five months) (right-hand side)
Image .csv .xlsThe feed-through of changing property transaction volumes to changing house prices is most apparent in the period around the financial crisis, with similar large falls and increases apparent in both series. More recently, the large spike in sales volumes in March 2016 did not feed through into higher prices five months later, which is likely to reflect the fact that the increased sales volumes were not sustained but were followed by a dip and subsequent lower trend in sales volumes.
Looking at the most recent data points, a sharp fall in annual sales growth for March 2017 (negative 51.2%) is followed by positive annual sales growth in April 2017 (21.0%), the first positive figure since March 2016. Both of these growth rates reflect base effects from the spike in March 2016 and subsequent dip in April 2016 – actual transactions were, in fact, lower in April 2017 than in March 2017 but appear to be reversed, as they are being compared with the spike in sales volumes in the previous year.
In general, there is an upwards trend in annual sales growth since April 2016. However, unlike previous periods, this has not yet materialised in the form of an increased annual growth rate for house prices in London. This is reflected in the fact that price growth in London has not only been lower than its long-term trend, but lower than the UK average for much of the past year.
Nôl i'r tabl cynnwys