Cynnwys
- Main points
- Statistician’s comment
- Summary
- Base effects on input producer prices associated with 2016 sterling depreciation are unwinding
- The three main drivers for food price inflation in July 2017 are bread and cereals, meat, and fruit
- Domestic cost pressures from unit labour costs in manufacturing and services are putting upward pressure on producer output prices
- Average house prices have risen more strongly than CPIH and regular wages in three southern regions since the pre-downturn peak in September 2007
1. Main points
- Growth in manufacturers’ output prices and the Consumer Prices Index including owner occupiers’ housing costs (CPIH) remained stable in the latest month, July 2017.
- Within the CPIH food and non-alcoholic drinks category, the main contributors to the 12-month growth rate of 2.6% in July 2017 were bread and cereals, meat, and fruit.
- Base effects on input producer prices associated with the sterling depreciation during 2016 are unwinding, leading to a sharp moderation in the 12-month growth rate of input producer prices from 10.0% in June 2017 to 6.5% in July.
- Services producer prices grew 0.8% between Quarter 2 (Apr to June) 2016 and Quarter 2 2017, in line with recent moderate growth in unit labour costs for the services sector.
- The recovery of average house prices from the pre-downturn peak varies significantly across the UK, with only three southern regions having grown more strongly than general consumer price inflation and regular wages by June 2017.
2. Statistician’s comment
Commenting on today’s inflation figures, Head of Consumer Price Inflation James Tucker said:
“Falling fuel prices offset by the costs of food, clothing and household goods left the headline rate of inflation unchanged in July.
We know there will be a focus on the RPI this month, but the National Statistician has been clear it is not a good measure and we do not recommend its use.
Meanwhile, chemical and vehicle prices helped push down factory gate inflation.
Annual house price growth again slipped back, mainly due to the south and east of England, which have seen particularly pronounced slowdowns in the last year.”
Nôl i'r tabl cynnwys3. Summary
Figure 1 shows that the input Producer Price Index (input PPI) grew by 6.5% in the 12 months to July 2017, down from 10.0% in the 12 months to June 2017. The output Producer Price Index (output PPI) grew by 3.2% in the 12 months to July 2017, down from 3.3% in the 12 months to June 2017.
Figure 1 also shows the 12-month growth in the Consumer Prices Index including owner occupiers’ housing costs (CPIH) remained at 2.6% in July 2017.
These data are the first full year comparison of prices (from July 2016 to July 2017) for consumers and manufacturers covering the period after the EU referendum vote held in June 2016. The next section contains some analysis of the effects of movements of sterling last year compared with this year, and equivalent movements in PPI input prices. For more information about what has changed in the year since the referendum, please see our article on Visual.ONS.
Figure 1: Annual growth rate for Producer Price Index (PPI) input (left-hand side), PPI output and Consumer Prices Index including owner occupiers' housing costs (CPIH) (right-hand side)
UK, July 2008 to July 2017

Source: Office for National Statistics
Notes:
- These data are also available within the Dashboard: Understanding the UK economy.
Download this image Figure 1: Annual growth rate for Producer Price Index (PPI) input (left-hand side), PPI output and Consumer Prices Index including owner occupiers' housing costs (CPIH) (right-hand side)
.png (24.1 kB) .xls (41.5 kB)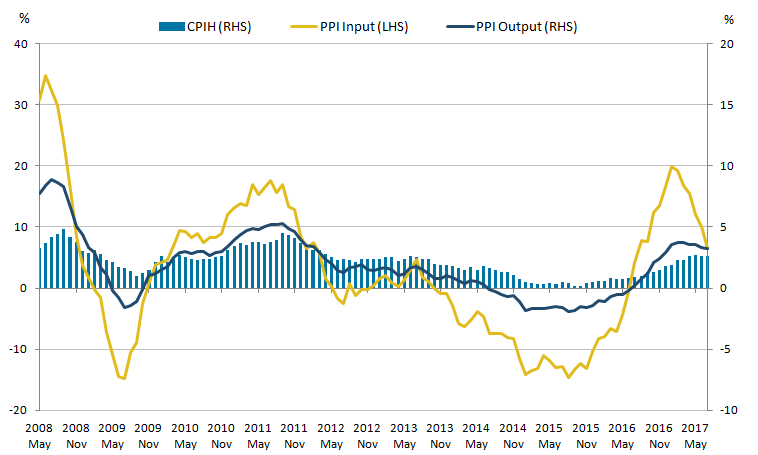
4. Base effects on input producer prices associated with 2016 sterling depreciation are unwinding
Figure 2a shows the 12-month growth rate in the inverted sterling effective exchange rate (ERI) since January 2015, broken down into the percentage point contribution from movement in the current month (darker blue bars) and the remaining contribution from the comparison with the base index, assuming no change in the current month (a form of base effect). This enables some insight into how movements in the 12-month growth rate are decomposed into current month and base effects.
Figure 2a: 12-month growth rate in the inverted sterling effective exchange rate, by current month and base effects
UK, January 2015 to July 2017
Source: Bank of England and Office for National Statistics calculations
Download this chart Figure 2a: 12-month growth rate in the inverted sterling effective exchange rate, by current month and base effects
Image .csv .xlsFor example, movement in the current month particularly affected the ERI 12-month growth rate in July 2016 and again in October 2016 when sterling depreciated sharply in the period following the EU referendum vote (shown as relatively large, positive darker blue bars). Since then, current month contributions to the 12-month growth rate have been more subdued, including in July 2017 when there was very little movement in the average sterling ERI in the month. Of the 2.0% growth in the (inverted) index between July 2016 (120.6) and July 2017 (123.0), only 0.1 percentage points was accounted for by change between June and July in 2017, and 1.9 percentage points came from the comparison with the base index.
The slowdown in the 12-month growth rate in the inverted ERI since November 2016 is therefore driven largely by the unwinding of changes from the base index a year earlier – when the currency was also depreciating. Twelve-month percentage change comparisons for each month since November 2016 therefore show a narrowing gap between a relatively stable exchange rate now and a depreciating one last year (smaller lighter yellow bars). Base effects will become zero, or drop out, when the index level from a year ago matches the index level now.
Similar analysis can be shown for the input PPI 12-month growth rate, which shows a relatively strong correlation with changes in the sterling ERI (inverted) as shown in Figure 2b.
Figure 2b: 12-month growth rate in PPI input prices, by current month and base effects, and inverted 12-month sterling effective exchange rate growth rate
UK, January 2015 to July 2017
Source: Bank of England and Office for National Statistics calculations
Download this chart Figure 2b: 12-month growth rate in PPI input prices, by current month and base effects, and inverted 12-month sterling effective exchange rate growth rate
Image .csv .xlsAgain, movements in input PPI 12-month growth rate in most periods are driven by movements in the base year index (size of the lighter yellow bars), rather than seeing strong movements in the current month itself (darker blue bars). Since January 2017, Figure 2b shows a similar pattern of base effects unwinding as in Figure 2a, which had previously built up during the second half of 2016 (falling size of the lighter yellow bars during 2017).
For example, in July 2017, the PPI input index was 106.0, identical to the June index of 106.0, meaning there was no contribution to the 12-month growth rate from the current month (no darker blue bar in the chart). However, the index in July 2016 was 99.5, which generates a growth rate of 6.5% comparing July 2016 with July 2017.
Nôl i'r tabl cynnwys5. The three main drivers for food price inflation in July 2017 are bread and cereals, meat, and fruit
In July 2017, food and non-alcoholic beverages contributed 0.2 percentage points to the 12-month growth rate of Consumer Prices Index including owner occupiers’ housing costs (CPIH) (2.6%) and this contribution has been increasing for the past 9 months. Within the food and non-alcoholic beverages category, Figure 3 shows the contributions to the 12-month growth rate of food and non-alcoholic beverages in July 2017 by COICOP class (COICOP stands for Classification of Individual Consumption according to Purpose, and is the standard aggregation structure used for CPIH).
Figure 3: 12-month growth rate for food and non-alcoholic beverages, by COICOP class
UK, July 2017

Source: Office for National Statistics
Download this image Figure 3: 12-month growth rate for food and non-alcoholic beverages, by COICOP class
.png (19.1 kB) .xls (18.9 kB)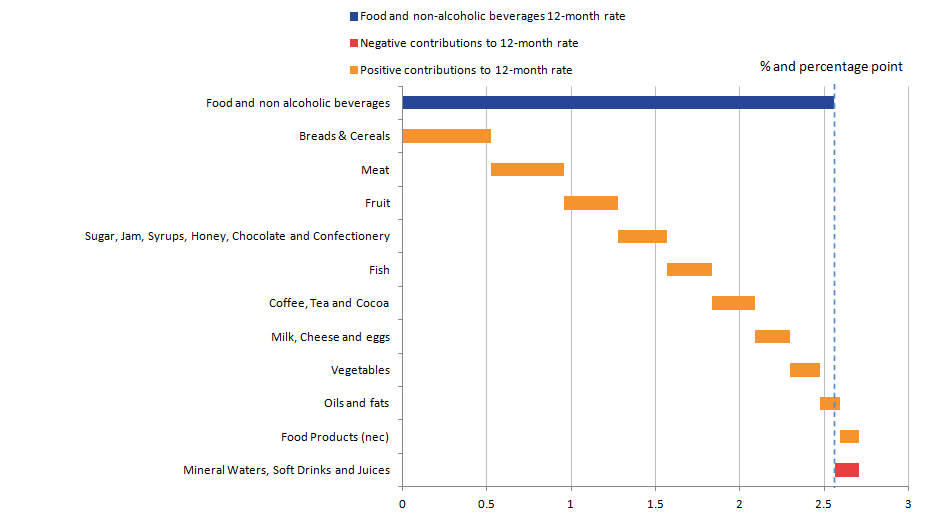
The 12-month growth rate of food and non-alcoholic beverages was 2.6%. Bread and cereals made the largest positive contribution of 0.5 percentage points, around a fifth of the overall increase. Mineral waters, soft drinks and juices made the only negative contribution to the category of negative 0.1 percentage points. This highlights a recent trend of increasing food prices, in the past 3 months every category has been positively contributing to food inflation except for mineral waters, soft drinks and juices.
The steady increase in food inflation rates may be linked to the recent relative weakness of sterling. This is because food products are quite import-dependent, shown by the fact that the majority of the food and non-alcoholic beverages classes are in the 30 to 40% import penetration grouping used in previous analysis. There are also likely to be other factors specific to the food and farming industry, for example, poor weather in some areas and limited supply of some products in the dairy sector that are adding to price pressures for this group. Recent analysis showed that the practice of shrinkflation, the business practice of changing product pack size, while keeping its price the same, had no impact on the overall rate of inflation.
Nôl i'r tabl cynnwys6. Domestic cost pressures from unit labour costs in manufacturing and services are putting upward pressure on producer output prices
Unit labour costs (ULCs) reflect the full labour costs, including social security and employers’ pension contributions, incurred in the production of a unit of economic output. Unit labour costs are calculated by dividing total labour costs (compensation of employees plus the labour share of mixed income) by output (as measured by gross value added).
There is likely to be a relationship between unit labour costs and output producer price inflation (PPI) as labour costs are a primary input to the production process particularly in the services sector. The relationship between unit labour costs and PPI output prices for the manufacturing sector is shown in Figure 4a and for services in Figure 4b. Quarter 2 (Apr to June) 2017 data for services producer prices (UK Services Producer Prices) are now available, although ULC figures are only available to Quarter 1 (Jan to Mar) 2017.
Figure 4a: Unit labour costs and output producer price inflation (PPI) for the manufacturing sector
UK, Quarter 1 (Jan to Mar) 1998 to Quarter 2 (Apr to June) 2017
Source: Office for National Statistics
Notes:
- Unit labour costs (ULC) data are not yet available for Quarter 2 (Apr to June) 2017.
Download this chart Figure 4a: Unit labour costs and output producer price inflation (PPI) for the manufacturing sector
Image .csv .xlsFigure 4a shows that there is a broad upward trend in labour costs and output prices for the manufacturing sector, particularly from 2007 onwards. Unit labour costs for manufacturing remained relatively subdued during the economic downturn until the labour market recovery began in around 2012. Output producer prices continued to grow during this period, potentially leading to increased profit margins for manufacturers. There is, for example, an increase in annual growth in the gross operating surplus (GOS) for the manufacturing sector recorded between Quarter 1 2010 and Quarter 1 2015.
This trend has, however, reversed in the more recent periods as unit labour costs have grown more strongly than PPI output prices between Quarter 1 2015 and Quarter 1 2017.
Figure 4b shows unit labour costs for the services sector of the economy and services producer price inflation (SPPI) between Quarter 1 1998 and Quarter 2 2017. Output prices and unit labour costs in this sector have also followed an upward trend but there has not been as large a divergence between relative growth in labour costs and output prices when compared with the manufacturing sector.
Figure 4b: Unit labour costs for the services sector and services producer price inflation (SPPI)
UK, Quarter 1 (Jan to Mar) 1998 to Quarter 2 (Apr to June) 2017
Source: Office for National Statistics
Notes:
- It should be noted that SPPI measures prices received by businesses supplying services to other business and government. It does not measure prices received for consumer-focused services. It is a partial, best estimate, measure of overall inflation to UK businesses in the services sector, but does not cover every industry in the services sector. SPPI is estimated to represent 59% of the total service sector at industry level.
- Unit labour costs (ULC) data are not yet available for Quarter 2 (Apr to June) 2017.
Download this chart Figure 4b: Unit labour costs for the services sector and services producer price inflation (SPPI)
Image .csv .xlsFigure 4b shows that there has been very little upward pressure on costs in the services sector generated by unit labour costs since the economic downturn (2009 onwards), including during recent periods when there has been strong employment growth. In contrast, there has been more upward cost pressure in manufacturing from unit labour costs over the same period. This could potentially indicate a greater range of skill shortages in manufacturing, which require firms to increase wages to attract these workers. Vacancy to employee ratios are, for example, tighter in the manufacturing sector at 2.1 job vacancies per 100 filled employee jobs for April to June 2017, compared with the average for the services sector (2.7) and economy as a whole (2.6).
Nôl i'r tabl cynnwys7. Average house prices have risen more strongly than CPIH and regular wages in three southern regions since the pre-downturn peak in September 2007
Average house prices measured by the UK house price index (HPI) fell significantly during the economic downturn but have grown relatively strongly since around 2013 to the end of 2016. Figure 5 shows the top and bottom three regional house price indices in June 2017, compared with the Consumer Prices Index including owner occupiers’ housing costs (CPIH) and average weekly regular earnings (AWE) between January 2005 and June 2017. These are all referenced to the UK’s pre-downturn house price peak in September 2007.
Figure 5: Selected house price indices by region and country of the UK, average weekly regular earnings (AWE) for Great Britain and the Consumer Prices Index including owner occupiers' housing costs (CPIH)
Jan 2005 to June 2017
Source: Office for National Statistics, Land Registry
Notes:
- The CPIH and AWE data are for the UK and Great Britain respectively.
Download this chart Figure 5: Selected house price indices by region and country of the UK, average weekly regular earnings (AWE) for Great Britain and the Consumer Prices Index including owner occupiers' housing costs (CPIH)
Image .csv .xlsThe only region where house prices have still not recovered to the pre-downturn peak is the North East, where they remain 6% below their September 2007 level. In contrast, London has seen the largest growth in average house prices of 61% between September 2007 and June 2017.
Given the large variation in the rate of growth of average house prices since the pre-downturn peak across the country, it is interesting to compare these data with the average growth in consumer prices over the same period, as well as average growth in nominal regular wages – also shown in Figure 5. It should be noted that these price and wage increases are for the UK and Great Britain as a whole respectively. Regional price and monthly wage data are not available.
Figure 5 shows that average house prices in London, the South East and the East of England have grown more strongly than the overall basket of goods and services measured by the CPIH and average weekly earnings (AWE) since September 2007. It should be noted that there will be some circularity in making this comparison as owner occupiers’ housing costs are captured in CPIH.
For people living in these three southern regions of England, assuming that they experienced these national rises in wages, house prices have become increasingly hard to afford since the economic downturn in terms of price to earnings ratios. Similarly, for the majority of regions where house prices have risen slower than overall wage growth, it is possible that people are more able to afford to purchase a house, in terms of price to earnings ratios, compared with the pre-downturn peak in the housing market.
Nôl i'r tabl cynnwys