1. Overview
Alternative data sources, namely scanner and web-scraped data, and methods to utilise these data sources, are being introduced into the production of UK consumer price statistics from 2023.
These new data sources will result in millions more prices being processed each month; therefore, for the Consumer Prices Index including owner occupiers' housing costs (CPIH) and Consumer Prices Index (CPI), changes are required at the lowest level of aggregation to integrate these new data, while ensuring that they are appropriately represented within our price indices.
This article details our proposed hierarchy and methods that are to be implemented as we begin to incorporate scanner and web-scraped data from 2023; details on our existing hierarchy and methods can be found in Consumer Prices Indices Technical Manual, 2019.
2. Proposed aggregation structure
Our proposed aggregation structure from 2023 (Figure 1) has been developed taking into account four key considerations:
we have the flexibility to use alternative data in combination with, or in place of, traditionally collected data, weighted according to our best information on retailer market share
we can realise more potential from alternative data sources, while keeping the traditional collection as stable as possible
we can more readily calculate regional consumer price statistics
we enable transition towards the latest iteration of Classification of Individual Consumption According to Purpose (COICOP) (2018), while also realigning our detailed (COICOP 6) level of the hierarchy coding with higher COICOP levels
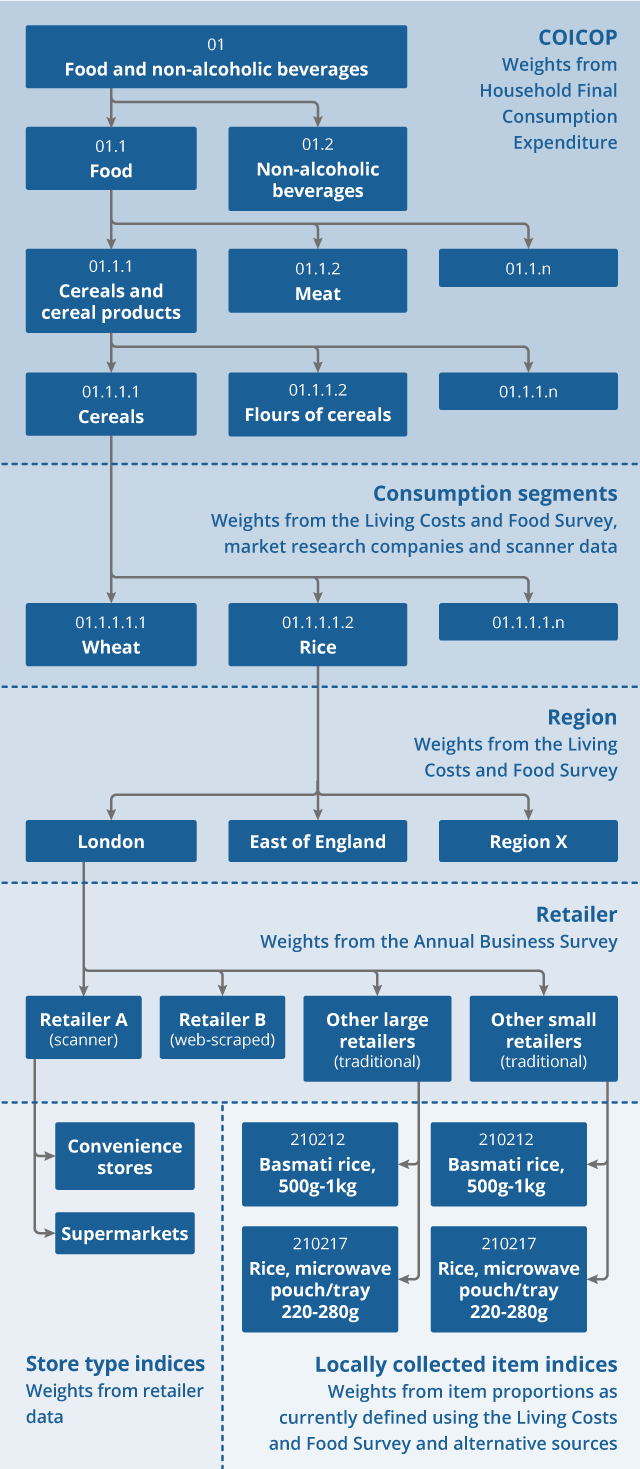
Figure 1: Illustrative example of how the future aggregation structure could look for the “Rice” consumption segment

Download this image Figure 1: Illustrative example of how the future aggregation structure could look for the “Rice” consumption segment
.png (141.9 kB)Notes
This example is illustrative. There will be consumption segments for which we do not have scanner data or web-scraped data, and will continue to use traditionally-collected data to produce price indices. There will also be consumption segments that we will not stratify into groups based on market share, as large retailers dominate the market for some products. Finally, sometimes there may be greater or fewer locally collected item indices to represent each consumption segment, depending on the range of product varieties in each consumption segment, and the amount of expenditure each consumption segment accounts for. There may be consumption segments where we choose to rely entirely on alternative data sources, such as used cars or rail fares.
Large retailers are defined as having greater than 2% market share; small retailers are defined as having less than 2% market share.
3. Introduction of consumption segments
A key change in the proposed price aggregation structure from 2023 comes with the introduction of "consumption segments". Currently, price indices produced at this detailed level in the hierarchy are referred to as "item indices".
Items are selected for the consumer price statistics basket to be representative of a broader group. For example, we collect peanuts to represent price movements for nuts, and garden spades to represent price movements for garden tools. For retailers for whom we have alternative data, we have access to prices for a near-census of products. We are therefore introducing consumption segment level indices to realise greater potential from these new data.
Consumption segments are broader than the current item definitions, though still defined based on a relatively homogeneous set of products. Broadening the definitions allows us to make better use of the alternative data. For example, one current item definition is for "Basmati rice 500g-1kg"; by broadening the consumption segment definition to "Rice" we will be able to use data for long-grain, short-grain, white, brown, and flavoured rice, weighted according to popularity.
However, when collecting prices using traditional methods, the current item level definitions will be maintained. This is because sample sizes are smaller and index methods may be more sensitive to heterogeneous prices. These item indices will be treated explicitly as being representative of the broader consumption segment. For example, "Basmati rice 500g-1kg" and "Rice, microwave pouch/tray 220-280g" will be aggregated together to form a rice index for traditionally collected data within each region. These will then be aggregated with "Rice" indices from retailers for whom we have alternative data, based on their respective market shares, to form regional and higher-level rice indices (see Figure 1).
New consumption segments will only be included in the consumer prices basket of goods and services if there are corresponding items in the sample of representative goods from the traditional collection. This ensures that retailers for whom we have alternative data are proportionately represented within our consumer price indices. Mappings between item and consumption segment categories will be released alongside the experimental indices in 2022.
Nôl i'r tabl cynnwys4. New index number methods
The index methods used at the lowest level of aggregation will differ, according to the data source. Prices collected using traditional methods will continue to be aggregated using existing index number methods, such as Jevons and Dutot methods. We are investigating the use of multilateral methods for scanner and web-scraped data, as discussed in New index number methods in consumer price statistics. Once elementary aggregate indices are formed, these indices will be aggregated together using existing aggregation methods: weighting the indices together according to our most recent, accurate information on expenditure shares in the base period (using a Lowe index).
Nôl i'r tabl cynnwys5. New methods for the calculation of retailer weights
Traditionally, to distinguish between different shop types in consumer price indices, some items are stratified further. The current shop type definitions are "multiples" (those who have more than 10 stores in the UK) and independents (those who have fewer than 10 stores in the UK).
This current stratification has limitations: it gives equal weight to retailers that may have quite different levels of expenditure (for example, we may be giving an equal weight to a regional chain of convenience stores and large national supermarket chains, as both are classed as "multiples"); it also misrepresents the expenditure of predominantly online retailers who have no physical outlets but a large market share (for example, a prominent online-only clothing retailer would receive the same weight as an independent clothing store, as they are both classed as "independents"). This stratification also does not provide an easy means to integrate indices from retailers for whom we have scanner and web-scraped data with indices produced using prices collected physically from stores.
However, giving every retailer a unique weight based on their market share within each region would result in small sample sizes and issues with product availability, particularly for retailers for whom we rely on traditional data collection methods. Explicit market share weighting will therefore only be used for retailers for whom we have alternative data sources. These retailers have been chosen because of their market dominance and have proven sufficient sample sizes and ongoing availability of data.
For retailers where prices are collected using traditional methods and for items that are stratified by shop type, and for whom we don't have alternative data, we plan to aggregate price quotes for retailers with greater than 2% market share into a single "other large retailers" stratum, and aggregate price quotes for retailers with less than 2% market share into a single "other small retailers" stratum (see Figure 1).
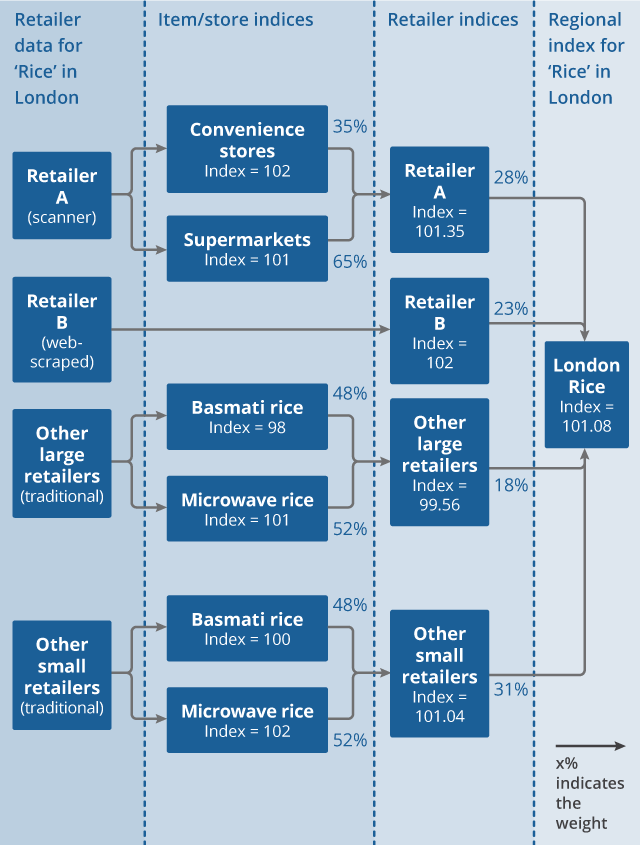
This allows us to more readily integrate retailers for which we use explicit market share weighting and to better account for online-only retailers, without substantially reducing sample sizes within each stratum based on our traditional collection. A stylised example of how data are aggregated at this lowest level in the hierarchy is provided in Figure 2.
Figure 2: Illustrative example of elementary aggregation for the “Rice” consumption segment in the London region

Download this image Figure 2: Illustrative example of elementary aggregation for the “Rice” consumption segment in the London region
.png (101.1 kB)Notes
- Large retailers are defined as having greater than 2% market share; small retailers are defined as having less than 2% market share.
6. Improvements to imputation methods
It is likely that in certain scenarios we will have missing data. This could be at the individual price quote level (for example, a product temporarily out of stock), or at a higher level of aggregation such as a missing retailer, region, or consumption segment level index (for example, unavailable goods and services during the coronavirus (COVID-19) lockdowns). Imputation can be used to ensure these missing data do not have a significant impact on the headline inflation rate.
While updating our hierarchy and systems to incorporate new data sources from 2023, we will also be looking to make changes to our imputation calculations:
imputation for missing prices will be based on the inflation rate of all available products within the same strata
imputation for missing strata will be based on the monthly inflation rate of all available strata within the consumption segment
imputation for missing consumption segments (because of seasonal unavailability or collection difficulties) will be based on the monthly growth rate of all other consumption segments within the same class (COICOP4)
imputation for missing consumption segments because of unavailability will follow the same principles as set out in Coronavirus and the effects on UK prices
7. Publication of indices and microdata availability
We will continue to primarily publish indices at the Classification of Individual Consumption According to Purpose COICOP5 (subclass) level and above. Index microdata will be made available for the consumption segment level indices (provided they are not disclosive of individual retailers), as they currently are for the item level indices. Price quote microdata will continue to be available for prices collected from physical stores but will not be made available for retailer data collected through web-scraping or provided to us as scanner data.
Nôl i'r tabl cynnwys