1. Overview of the classification project
Consumer price inflation is the rate at which the prices of goods and services bought by households rise and fall and is estimated by using price indices. One way to understand a price index is to think of a very large shopping basket containing all the goods and services typically bought by households. Movements in price indices represent the changing cost of this basket.
New data sources and methods are being introduced into the production of consumer price statistics from 2023. The new data sources, namely web-scraped and scanner data, have the potential to improve the quality of UK consumer price statistics through increased coverage and more timely data. Both these new data sources cover a much wider range of products, and at larger frequencies and quantities, than is possible with any form of manual price collection. However, with these benefits, there are also challenges, and new methods are required to fully utilise these new data sources.
In a previous article in this series, we introduced the concept of "consumption segments", that partition the consumption basket into groups of similar (homogeneous) products. Price changes are measured within each consumption segment, then aggregated through an international classification system known as Classification of individual consumption according to purpose (COICOP). An example of a consumption segment may include "Women's t-shirts", which is in turn aggregated into "Garments for women" and then into "Clothing".
The goal of classification is to ensure that products are assigned to the correct consumption segment. This can be a complex task when working with alternative data sources given their size and complexity relative to traditional survey-type data.
Previously we have focused on the automated classification of web scraped clothing data. In this article, we:
outline a broad strategy for how we decide which classification method is suitable for a range of different data sources with different properties (section 2)
detail our progress for the classification of grocery scanner data (section 3)
provide an overview of future developments in this research area (section 4)
2. Classification as a suite of methods for use with new data sources
The new data sources that we are acquiring comprise a variety of different product categories, including goods such as groceries, clothing and laptops, and services such as rail fares, air fares and package holidays. Each category (and the data collection method for each category) has different characteristics that can affect how classification should be performed. In Figure 1 we present a broad overview of the data properties that may lead to a different choice of classification strategy.
Figure 1: The classification of new data sources requires a suite of methods

Source: Office for National Statistics
Download this image Figure 1: The classification of new data sources requires a suite of methods
.png (55.7 kB)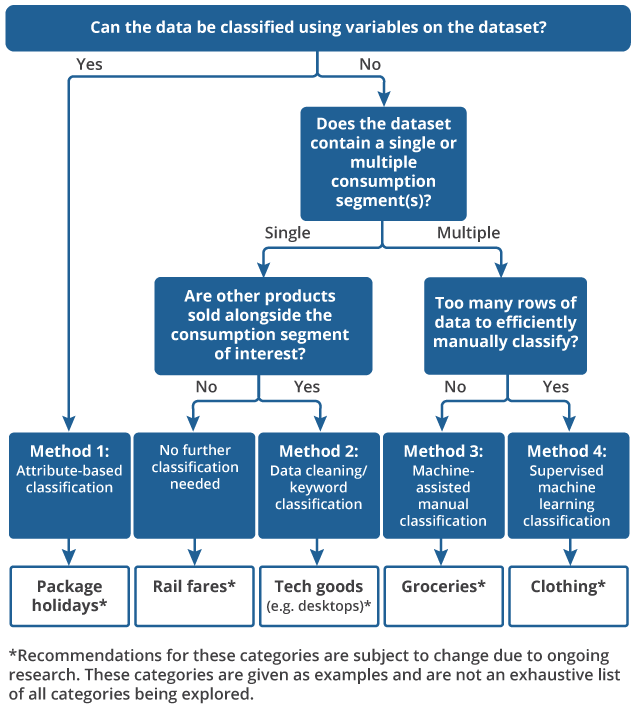
Method 1: attribute-based
Some datasets may contain an attribute which can be directly used to break the dataset up into consumption segments. For example, for a package holidays dataset, if we were to have a consumption segment for weekend city breaks within the UK, and one for weekend city breaks in Europe, then we can use a destination variable to split the dataset in the way that we need.
This method is only feasible if the attribute partitions the dataset to the level of detail required of the consumption segments. For example, although it may seem intuitive to use a clothing retailer's website hierarchy to split clothing data into consumption segments, this may lead to consumption segments that are too broad. If the lowest level of their hierarchy includes a "sportswear" section, then our corresponding consumption segment may contain anything from sports shorts to ski jackets. Different retailers may also have different hierarchies that could lead to inconsistencies in what products are included in each consumption segment.
The attribute must also be well-populated to ensure that all products can be classified according to the strategy. This approach may not be viable if the retailer cross-sells other products alongside the products of interest, leading to possible contamination. This is discussed further in the binary classification section.
Method 2: binary classification
Some datasets that we are collecting consist mostly of data from a single consumption segment that we are interested in measuring inflation for (such as desktops), but the retailer also cross-sells other products alongside this consumption segment (such as keyboards). Our goal is to remove cross-sold products that should not be included when measuring inflation for the consumption segment of interest. This is therefore a binary classification task where we wish to separate the products that we are interested in keeping from those that we wish to remove. We have started the development of a keyword classifier to be able to do this, although this remains a topic of ongoing research and will not be covered further in this article.
Some datasets may cover a single consumption segment and contain no cross-sold products. There is no classification work required in this instance.
Methods 3 and 4: multiclass classification
Some of the datasets that we are intending to use in the construction of UK consumer price statistics are extremely large and contain multiple consumption segments. These data can also display a high rate of product churn, where products enter and leave the market rapidly due to emerging technologies or fashion trends. In these cases, a more automated approach to classification is required to ensure large amounts of data can be classified rapidly. Supervised machine learning provides a potential method for carrying out this classification work, as discussed in Automated classification of web-scraped clothing data in consumer price statistics.
However, machine learning often requires a lot of labelled data to train and test the algorithms. Labelled data can be expensive to collate and quality assure on an ongoing basis, so it is important to understand when this approach is necessary compared to a more manual classification approach.
In contrast, some datasets pertaining to multiple classes contain fewer unique products or a much lower product churn rate. A manual-based approach is therefore more maintainable for these datasets and provides additional reassurance in the accuracy of our classifications. In these cases, coding efforts should instead be focussed on machine-assistance techniques that improve the efficiency of manual classification and the quality assurance procedure. This is the approach that we intend to take for grocery classification; in the next section, we discuss how we may approach grocery classification in more detail.
Nôl i'r tabl cynnwys3. A classification strategy for grocery scanner datasets
Grocery scanner datasets are big data, containing tens to hundreds of millions of rows per retailer per month. The size of these datasets is because of the repetition of products across the dataset. Each row on a scanner dataset represents aggregate sales information for a specific product in an individual store for a single day or week (data frequency can change dependent on what the retailer is able to provide). For example, if a monthly scanner dataset contains four weeks of data for 1,000 stores, then each unique product may have up to 4,000 rows in the dataset to account for the weeks and stores that that product is sold in.
Classification does not need to be performed on each individual row, but rather on each unique product independently of where or when it has been bought. Once classified for the first time, the classification can be propagated to all other stores and times where the product appears in the dataset. The classification can often even be propagated across retailers where many retailers may sell the same brand of product. This means that the scale of the classification task is much smaller than the size of the dataset may suggest. Upon acquisition of scanner data for a new retailer, we need to perform a one-time effort of initially classifying all unique products within the first data delivery. Retailers sell on the scale of tens of thousands of unique grocery products in a month so, while feasible, this is a time costly process.
The next step is to keep an ongoing classification of new emerging products. For the grocery retailers we have looked at so far, new products account for approximately 5% of the dataset, meaning a scale of hundreds to the low-thousands of products need to be classified per retailer per month. Therefore, once products are classified initially, the monthly maintenance rate for classification of grocery data is relatively low. This is a much smaller scale than for goods with high fashionability or technological advancement, such as clothing and laptops. For example, our clothing dataset has a new product rate of approximately 30% per month. This means around 160, 000 products require classification each month - hence the necessity for a more-automated supervised machine learning approach.
We will likely include a limited number of consumption segments when we first integrate grocery scanner data with our traditional collection methods, in line with the grocery items currently collected within the inflation basket. However, to ensure that we have readily classified data for any consumption segments introduced in the future, we are classifying all the data to consumption segments as detailed in the optional high-detail structure of COICOP 2018 for food and drink (PDF, 2.5MB). This means that we are classifying to hundreds of consumption segments, even though not all will be used in the first instance.
While manual classification is more feasible for grocery scanner data than for some of our other datasets, there are several techniques that we can use to improve the efficacy of manual classification, as outlined in the following sections.
Direct mappings from retailer hierarchies
Where there is a direct mapping between the lowest level in the retailer hierarchy and our consumption segment, we are exploring whether it is suitable to apply classifications en masse using basic hierarchical mappings. For example, if the retailer has a 'courgette' entry in their hierarchy, then all courgette products can be simultaneously mapped to the courgette consumption segment, without manually classifying each individual product. This approach is recommended as a potential shortcut in Eurostat guidance (2017, PDF, 943KB).
However, this approach leads to the potential for erroneous classifications to be made if the retailer has miscategorised products. Since classification will occur as products enter the dataset for the first time, it may be that products are more prone to being miscategorised by the retailer at the point at which we classify. Therefore, products mapped would need to be quality-assured to ensure that all products classified in this way are appropriate and it may simply be more straightforward to classify manually if it is efficient to do so.
Linking relaunches prior to classification
Scanner datasets usually contain a GTIN (a global code) and an SKU (a retailer-specific code), as discussed in Research into the use of scanner data for constructing UK consumer price statistics. GTIN codes are managed by GS1 (a non-profit organisation) and new GTINs can be launched for a product line following changes to weights and packaging of products. For example, "Brand XYZ Lasagna 400g" may be reduced to "Brand XYZ Lasagna 390g" and launched under a new GTIN. The retailer specific SKU code typically links these products, but this linking is retailer dependent. By using the SKU as the identifier, in most cases we can link the relaunched product with the original variant, capturing the effect of weight changes, particularly in the case of "shrinkflation". The new variant can therefore automatically obtain the original product's classification.
Linking products between retailers
Although SKUs are likely to be treated as the identifier, it is valuable to retain global GTINs. If two or more retailers sell the same product, and the first retailer has already been classified, then the second retailer can inherit its classification from the first retailer by linking on the GTIN code. Note that own-brand products cannot be classified in this way as they are distinct to individual retailers.
Using a labelling dashboard
A bespoke application has been developed to enable efficient manual classification of grocery data. Due to the large number of categories, the application dynamically serves the user with different sets of consumption segments based on an earlier hierarchy mapping from the retailer. For example, if the labeller is labelling a product where the lowest level of the retailer hierarchy is "fruit", then all the fruit-related consumption segments will be made available in the application to pick from. This makes manual classification more efficient.
Using confidence markers
As the manual classification occurs, we are asking labellers to provide a level of confidence in their designation of classification. For example, a "royal gala apple" may be classified by the labeller as an apple with high confidence, whereas a "Jaffa cake" may be classified as a chocolate biscuit with low confidence. This allows our quality assurance procedures to be focussed on the most difficult products that labellers came across.
Nôl i'r tabl cynnwys4. Future developments
In the long-term, manual classification will produce a large, labelled dataset and from clothing classification we already have a system that can be readily adapted to perform supervised machine learning methods on grocery data. As the number of retailers whom we obtain scanner data from increases we might find that manual classification becomes an unmanageable task. In that situation, we may therefore look to use machine learning for groceries.
Machine learning can be used to assist grocery labelling at different intensities, for example we could:
make automatic classifications for all new products;
make automatic classifications for new products, subject to the confidence of the machine learning algorithm being above a suitable threshold, with the remaining products being manually classified;
use results from machine learning models to provide the labeller with a set of recommended consumption segments, making navigation of consumption segments more efficient
Whether or not we choose to implement machine learning is dependent on whether maintaining a machine learning system is more efficient than simply manually classifying the new products as they come in and is shown to perform to a similar (or more precise) level of accuracy.
Note that when used with scanner data, international literature suggests that machine learning is better used as part of a machine-assistance procedure (options 2 or 3) rather than used to make all predictions automatically. Mehrhoff (2017, PDF, 586KB) observed that around 20% of products were misclassified by a classification algorithm and therefore recommended that machines are used to offer reasonable suggestions with assistance from humans. Similarly, Statbel (Belgium) have started using machine learning as part of a machine-assisted procedure: the classification algorithm makes a prediction which is manually inspected and corrected if the prediction is wrong (Van Loon, 2020, PDF, 475KB).
Our proposals are in-line with international best practice provided on classification in the HICP Practical Guide for Processing Supermarket Scanner Data (Eurostat, 2017, PDF, 943KB).
We are also continuing research into the methods of classification for data with different properties as outlined in Section 2 and will update users on progress for these items and datasets in due course.
Nôl i'r tabl cynnwys