Cynnwys
1. Main points
Gross fixed capital formation (GFCF) in volume terms was estimated to have decreased by 0.1% between Quarter 4 (Oct to Dec) 2015 and Quarter 1 (Jan to Mar) 2016 to £77.1 billion. Previously GFCF was estimated to be £76.9 billion in Quarter 1 2016 and to have risen by 0.5% compared with the previous quarter.
Between Quarter 4 2015 and Quarter 1 2016, business investment, in volume terms, was estimated to have decreased by 0.6% from £43.9 billion to £43.7 billion, revised down 0.1 percentage points from the previously estimated 0.5% decrease.
Between Quarter 1 2015 and Quarter 1 2016, GFCF was estimated to have increased by 0.7%, from £76.5 billion to £77.1 billion, revised down from the previously estimated 1.1% increase.
Business investment was estimated to have decreased by 0.8% between Quarter 1 2015 and Quarter 1 2016, from £44.0 billion to £43.7 billion, revised down from the previously estimated 0.4% decrease.
GFCF increased by 3.3% between 2014 and 2015. Business investment increased by 5.0% in the same period. Previously, GFCF was estimated to have risen by 4.1% between 2014 and 2015 and business investment to have increased by 5.2%.
GFCF for Quarter 1 2016 was 0.7% above the pre-economic downturn peak for GDP of Quarter 1 2008, while business investment was 6.7% above the same peak.
Estimates in this bulletin are consistent with the United Kingdom National Accounts The Blue Book 2016 Edition to be published on 29 July 2016. All data have been revised from their start point and the reference year for the chained volume estimates has now moved on from 2012 to 2013.
Nôl i'r tabl cynnwys2. About this release
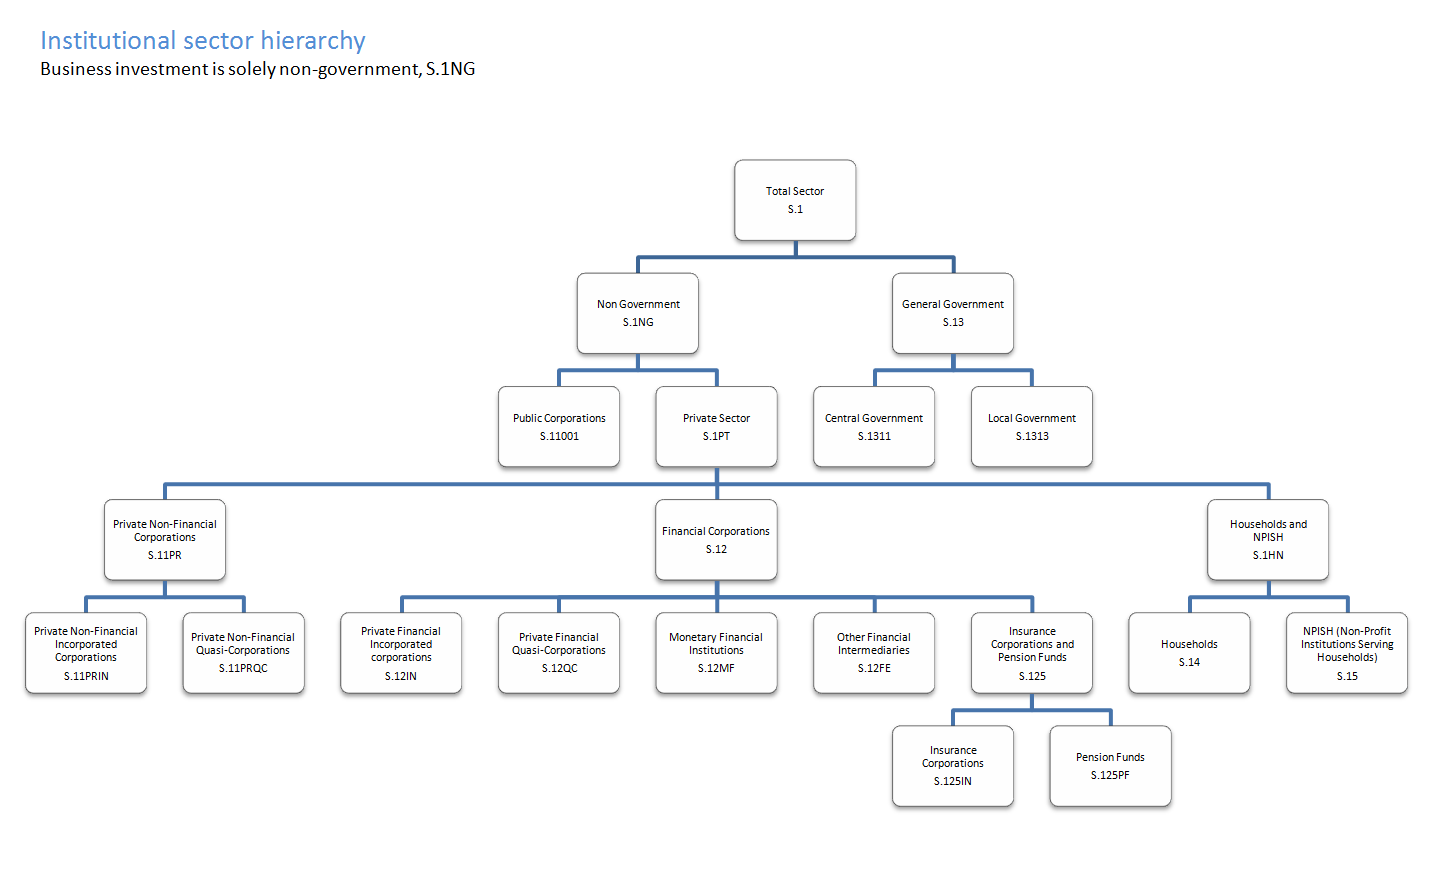
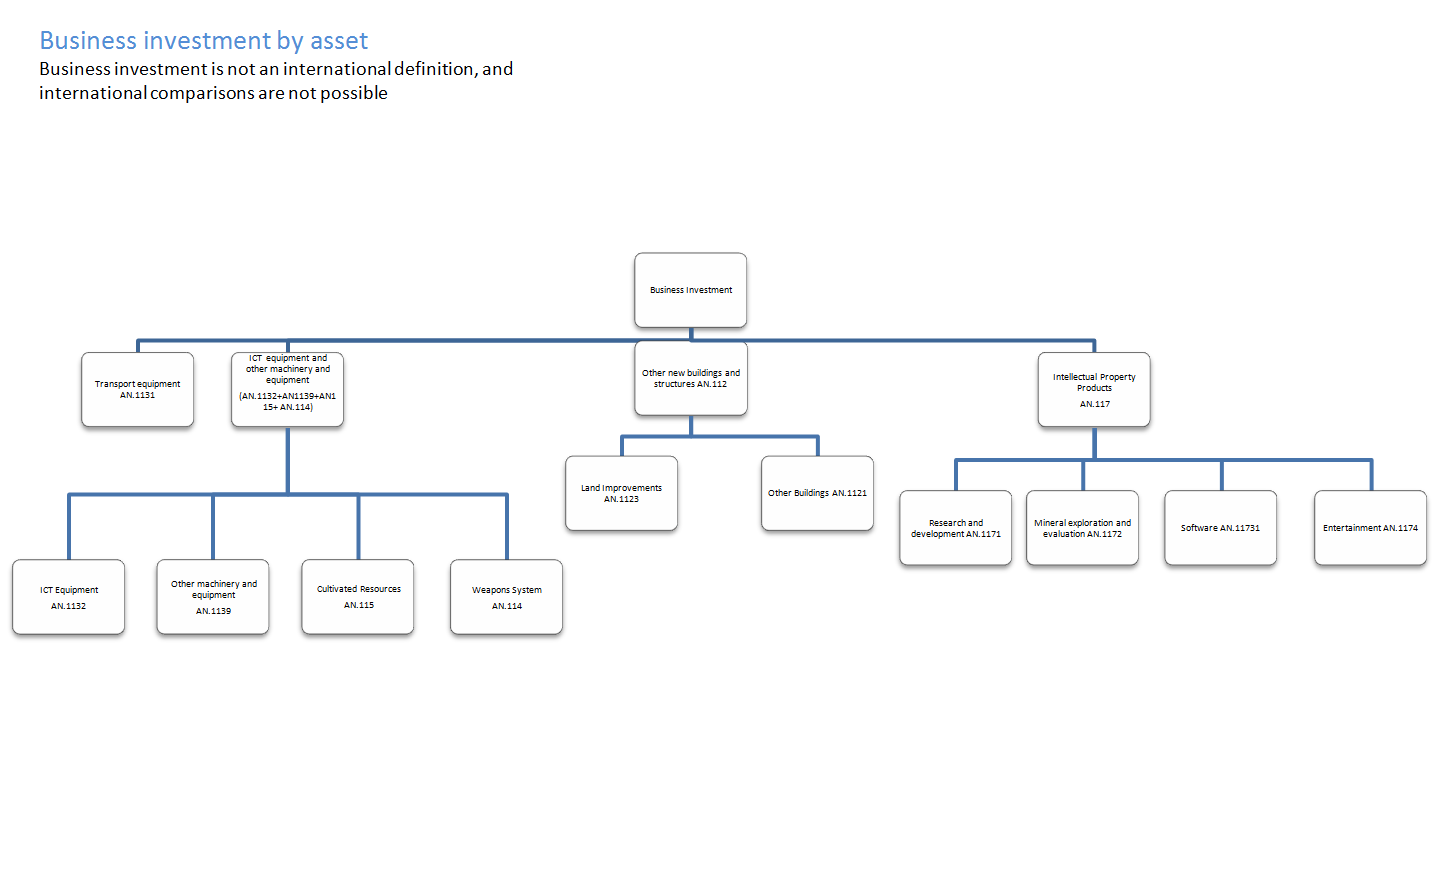
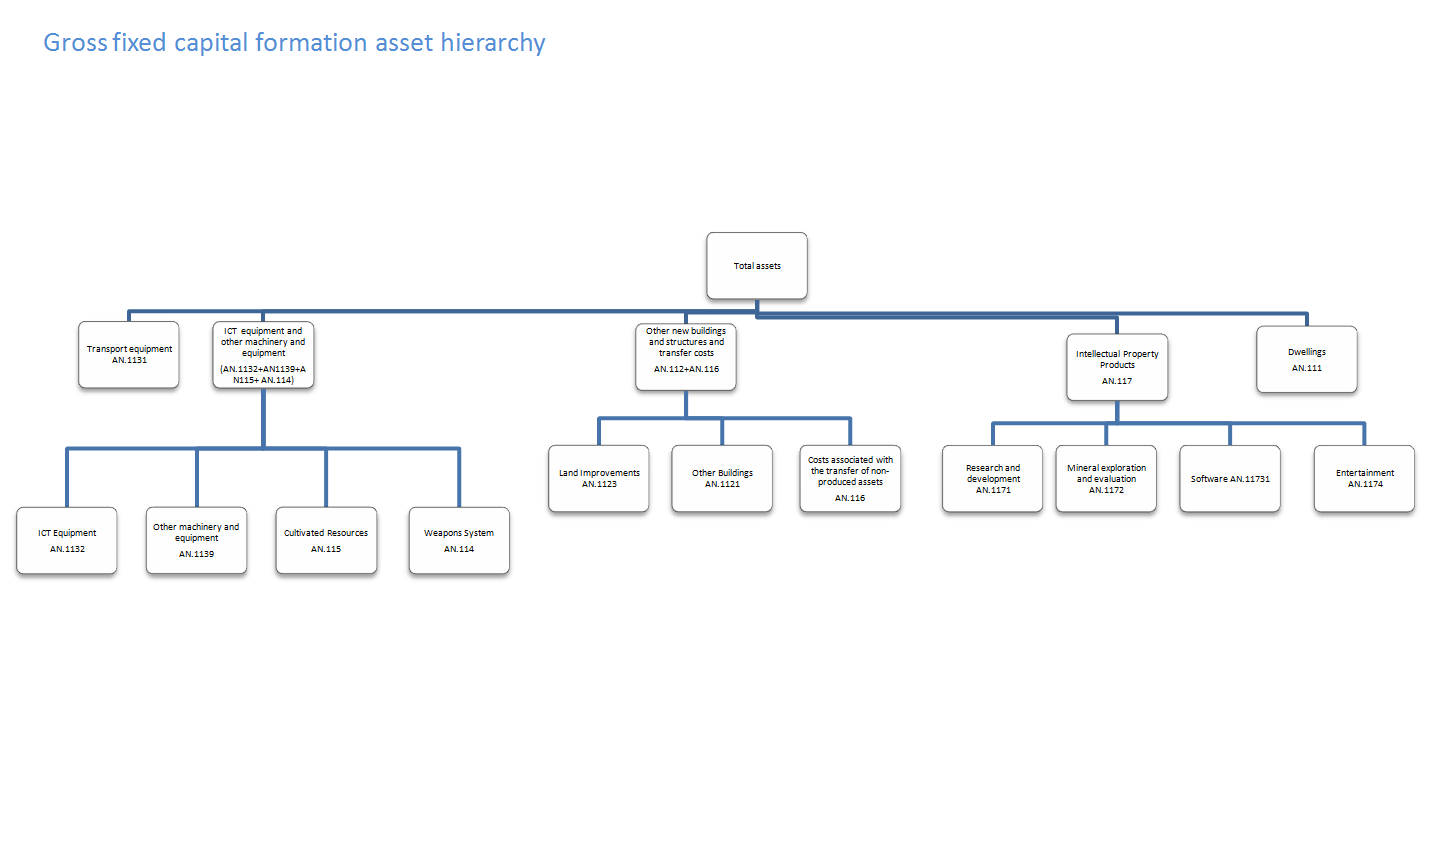
The estimates in this release are short-term indicators of investment in non-financial assets in the UK, such as dwellings, transport equipment, machinery, buildings and intellectual property products. This release covers not only business investment, but asset and sector breakdowns of total gross fixed capital formation (GFCF), of which business investment is 1 component.
Business investment is net investment by private and public corporations. These include investments in:
transport
information and communication technology (ICT) equipment
other machinery and equipment
cultivated assets
intellectual property products (IPP, which includes investment in software, research and development, artistic originals and mineral exploration)
buildings and other structures
It does not include investment by central or local government, investment in dwellings, or the costs associated with the transfer of non-produced assets (such as land). A full sector and asset hierarchy can be found in the background notes. Business investment is not an internationally recognised concept and therefore it should not be used to make international comparisons.
All investment data referred to in this bulletin are estimates of seasonally adjusted chained volume measures.
Nôl i'r tabl cynnwys3. Gross fixed capital formation and business investment
Figure 1 shows the level of annual gross fixed capital formation (GFCF) since 1997. GFCF has increased to £308.9 billion in 2015.
Figure 1: Annual gross fixed capital formation, chained volume measure
Reference year: 2013 Coverage: UK
Source: Office for National Statistics
Notes:
- The data in this chart covers 1997 to 2016.
Download this chart Figure 1: Annual gross fixed capital formation, chained volume measure
Image .csv .xlsFigure 2 shows annual growth of GFCF since 1997. GFCF has increased by 3.3% between 2014 and 2015.
Figure 2: Annual growth of currently published gross fixed capital formation, chained volume measures
Reference year: 2013 Coverage: UK
Source: Office for National Statistics
Notes:
- The data in this chart covers 1997 to 2016.
Download this chart Figure 2: Annual growth of currently published gross fixed capital formation, chained volume measures
Image .csv .xlsGFCF in Quarter 1 (Jan to Mar) 2016 was £77.1 billion, having decreased by 0.1% when compared with the previous quarter (Figures 3 and 4). Previously GFCF was estimated to be £76.9 billion and to have risen by 0.5%. The fall in Quarter 1 2016 follows a decrease of 1.0% in Quarter 4 (Oct to Dec) 2015, the first consecutive two quarter fall in GFCF since Quarter 3 2012. Prior to Quarter 4 2015, GFCF had increased each quarter since Quarter 2 (Apr to June) 2014. The main contributor to the fall in GFCF in Quarter 1 2016 was a fall in investment in other buildings and structures and transfer costs, down 4.6% on the previous quarter. This is a downward revision compared with the provisional estimate when the same asset fell by 0.7%. The main cause of this revision is the availability of improved estimates of government investment. GFCF increased by 0.7% between Quarter 1 2015 and Quarter 1 2016.
Figure 3: Quarterly levels of gross fixed capital formation, chained volume measure, seasonally adjusted
Reference year: 2013 Coverage: UK
Source: Office for National Statistics
Notes:
Q1 = Quarter 1 (January to March), Q2 = Quarter 2 (April to June), Q3 = Quarter 3 (July to September), Q4 = Quarter 4 (October to December)
The data in this chart covers Quarter 1 (January to March) 2008 to Quarter 1 (January to March) 2016
Download this chart Figure 3: Quarterly levels of gross fixed capital formation, chained volume measure, seasonally adjusted
Image .csv .xls
Figure 4: Quarterly growth of gross fixed capital formation, chained volume measure, seasonally adjusted
Reference year: 2013 Coverage: UK
Source: Office for National Statistics
Notes:
The data in this chart covers Quarter 1 (January to March) 2008 to Quarter 1(January to March) 2016.
-
- Q1 = Quarter 1 (January to March), Q2 = Quarter 2 (April to June), Q3 = Quarter 3 (July to September), Q4 = Quarter 4 (October to December
Download this chart Figure 4: Quarterly growth of gross fixed capital formation, chained volume measure, seasonally adjusted
Image .csv .xlsThe largest contributor to the fall of GFCF was other buildings and structures and transfer costs. Most of this fall is due to other buildings and structures. Partially offsetting this was private sector costs of ownership transfer on non-produced assets, which was estimated to have grown by 8.4% since Quarter 4 2015. Although the level has been revised down by £0.1 billion compared with the provisional estimate, this is still the highest level of private sector costs of ownership transfer on non-produced assets since Quarter 2 2008. The Bank of England’s latest Summary of Business Conditions suggests this could be owing to the bringing forward of buy-to-let purchases, ahead of the introduction of the rise in Stamp Duty on additional properties in April 2016.
Figure 5 shows the level of annual business investment since 1997. Business investment has increased to £177.1 billion in 2015
Figure 5: Annual levels of business investment, chained volume measure
Reference year: 2013 Coverage: UK
Source: Office for National Statistics
Notes:
- The data in this chart covers 1997 to 2015
Download this chart Figure 5: Annual levels of business investment, chained volume measure
Image .csv .xlsFigure 6 shows annual growth of business investment since 1997. Business investment has grown by 5.0% between 2014 and 2015.
Figure 6: Annual growth of business investment, chained volume measure
Reference year: 2013 Coverage: UK
Source: Office for National Statistics
Notes:
- The data in this chart covers 1997 to 2015.
Download this chart Figure 6: Annual growth of business investment, chained volume measure
Image .csv .xlsThe level of business investment in Quarter 1 2016 was £43.7 billion, a fall of 0.6% when compared with the previous quarter and a downward revision from the previously estimated 0.5% fall when business investment was estimated to be £43.1 billion. This takes business investment to its lowest level since Quarter 4 2014 when it was £43.1 billion. Business investment is now 6.7% above the pre-economic downturn peak of Quarter 1 2008 (£40.9 billion).
As illustrated in Figures 7 and 8 there have now been 2 consecutive periods of contraction, quarter on quarter, in business investment. The last time this happened was in Quarter 1 and Quarter 2 2013.
Figure 7: Quarterly levels of business investment, chained volume measure, seasonally adjusted
Reference year: 2013 Coverage: UK
Source: Office for National Statistics
Notes:
Q1 = Quarter 1 (January to March), Q2 = Quarter 2 (April to June), Q3 = Quarter 3 (July to September), Q4 = Quarter 4 (October to December)
The data in this chart covers Quarter 1 (January to March) 2008 to Quarter 1(January to March) 2016
Download this chart Figure 7: Quarterly levels of business investment, chained volume measure, seasonally adjusted
Image .csv .xls
Figure 8: Quarterly growth of business investment, chained volume measure, seasonally adjusted
Reference year: 2013 Coverage: UK
Source: Office for National Statistics
Notes:
Q1 = Quarter 1 (January to March), Q2 = Quarter 2 (April to June), Q3 = Quarter 3 (July to September), Q4 = Quarter 4 (October to December)
The data in this chart covers Quarter 1 (January to March) 2008 to Quarter 1(January to March) 2016
Download this chart Figure 8: Quarterly growth of business investment, chained volume measure, seasonally adjusted
Image .csv .xlsBusiness investment fell by 0.8% when compared with the same quarter a year ago. The last time business investment decreased when compared with the same quarter a year ago was in Quarter 1 2010, when it fell by 1.0%.
Nôl i'r tabl cynnwys4. Summary tables
Table 1 shows that in Quarter 1 (Jan to Mar) 2016, the largest increase seen in level terms was in private sector cost of ownership transfer on non-produced assets. This grew by £0.4 billion (8.4%) to £5.7 billion from Quarter 4 (Oct to Dec) 2015. General government saw the largest decrease in level terms, falling £0.3 billion (6.5%) from £11.6 billion in Quarter 4 2015 to £11.3 billion in Quarter 1 2016.
Between Quarter 1 2015 and Quarter 1 2016, private sector cost of ownership transfer on non-produced assets showed the largest level increase, having grown by £1.1 billion (25.1%). Private sector dwellings saw the second-largest level increase having grown £0.8 billion (5.4%) to £15.7 billion.
Table 1: Total gross fixed capital formation in the UK by institutional sector, Quarter 1 (Jan to Mar) 2016
| % change | % change | £ million | £ million | £ million | |
| Most recent quarter on previous quarter | Most recent quarter on same quarter a year earlier | Most recent level ** | Level change from previous quarter | Level change on same quarter a year earlier | |
| Gross fixed capital formation | -0.1 | 0.7 | 77,059 | -40 | 567 |
| Business investment | -0.6 | -0.8 | 43,651 | -269 | -363 |
| General government | -2.7 | -6.5 | 11,325 | -313 | -792 |
| Public corporations dwellings | -13.3 | -18.4 | 861 | -132 | -194 |
| Public corporations cost of ownership transfer on non-produced assets | 10.3 | 26.4 | -182 | -17 | -38 |
| Private sector dwellings | 1.6 | 5.4 | 15,696 | 251 | 809 |
| Private sector cost of ownership transfer on non-produced assets | 8.4 | 25.1 | 5,708 | 440 | 1145 |
| Source: Office for National Statistics | |||||
| Notes: | |||||
| 1. ** Series may not sum to totals due to rounding. | |||||
Download this table Table 1: Total gross fixed capital formation in the UK by institutional sector, Quarter 1 (Jan to Mar) 2016
.xls (28.7 kB)Table 2 shows that in Quarter 1 2016, the largest increase in level terms was in transport equipment, which grew by £733 million (18.7%) to £4.7 billion from Quarter 4 2015. Other buildings and structures and transfer costs saw the largest decrease in level terms, falling £1.2 billion (4.6%) from £25.1 billion in Quarter 4 2015 to £23.9 billion in Quarter 1 2016.
Between Quarter 1 2015 and Quarter 1 2016, information and communication technology equipment and other machinery and equipment showed the largest level increase, having grown by £0.9 billion (6.2%) to £15.1 billion. Dwellings saw the second-largest level increase, having grown by £0.6 billion (3.8%) to £16.6 billion.
Table 2: Total gross fixed capital formation in the UK by asset, Quarter 1 (Jan to Mar) 2016
| % change | % change | £ million | £ million | £ million | |
| Most recent quarter on previous quarter | Most recent quarter on same quarter a year earlier | Most recent level ** | Level change from previous quarter | Level change on same quarter a year earlier | |
| Gross fixed capital formation | -0.1 | 0.7 | 77,059 | -40 | 567 |
| Transport equipment | 18.7 | 0.3 | 4,658 | 733 | 14 |
| ICT equipment and other machinery and equipment | 0.1 | 6.2 | 15,101 | 20 | 881 |
| Dwellings | 0.7 | 3.8 | 16,608 | 120 | 609 |
| Other buildings and structures and transfer costs | -4.6 | -2.9 | 23,925 | -1,155 | -706 |
| Intellectual property products | 1.5 | -1.4 | 16,767 | 242 | -231 |
| Source: Office for National Statistics | |||||
| Notes: | |||||
| 1. ** Series may not sum to totals due to rounding. | |||||
Download this table Table 2: Total gross fixed capital formation in the UK by asset, Quarter 1 (Jan to Mar) 2016
.xls (28.2 kB)5. Revisions to gross fixed capital formation (GFCF) and business investment
Each year in the Blue Book-consistent publications of business investment we incorporate methodological and data changes that will impact on the business investment and GFCF datasets.
This business investment publication is the first to include Blue Book 2016 data. The regular annual changes include:
- seasonal adjustment reviews
- moving on the reference year by a year (to 2013)
- updating annual benchmark data from the Annual Business Survey (ABS) for 2012 and 2013
- annual supply-use balancing
This year we are also taking the opportunity to correct processing errors identified after Blue Book 2015 as this is our earliest opportunity to do so. These impact on both the dwellings and agricultural estimates within the GFCF and business investment estimates. We have also made improvements to our estimates of own account construction data within GFCF, and improved estimates for Value Added Tax fraud and the exhaustiveness adjustment for concealed income.
As can be seen in Figure 9, the changes to GFCF introduced for Blue Book 2016 have resulted in revisions to annual growth, more noticeable in later years. The largest positive revision to annual growth is in 2012, which has been revised up by 0.8 percentage points (1.5% to 2.3%). The largest negative revisions can be found in 2009 and 2015, which have both been revised down by 0.8 percentage points (in 2009 from -14.4% to -15.2% and in 2015 from 4.1% to 3.3%).
Figure 9: Annual growth of current gross fixed capital formation and previously published, chained volume measure
Reference year: 2013 Coverage: UK
Source: Office for National Statistics
Notes:
- The data in this chart covers 1997 to 2015.
Download this chart Figure 9: Annual growth of current gross fixed capital formation and previously published, chained volume measure
Image .csv .xlsRevisions between 1997 and 2011 are mainly due to the correction of processing errors for the agricultural and dwellings data, along with improvements to the measurement of own account construction of dwellings, details of which can be found in National Accounts articles: Impact of Blue Book 2016 Changes on Current Price Gross Domestic Product Estimates, 1997 to 2011.
Revisions between 2012 and 2014 are affected by revised ABS data.
The data for 2015 have been impacted by the corrections and improvements already outlined, as well as revisions coming from the Quarterly Acquisitions and Disposals of Capital Assets Survey (QCAS).
Figure 10 shows annual growth of business investment compared with previously published estimates. Business investment is not affected by revisions to dwellings data as dwellings is not an asset included in the business investment breakdown. The largest positive revision to the annual business investment growth is in 2012, where growth has increased from 5.1% to 7.2%. The main driver of this revision is the availability of improved ABS data. The largest negative revision is in 2014, where annual growth has been revised down from 4.7% to 3.9%. Growth in 2015 has also been revised down, from 5.2% to 5.0%, due to the revision of the benchmarked ABS data and revised QCAS data.
Figure 10: Annual growth of current business investment and previously published, chained volume measure
Reference year: 2013 Coverage: UK
Source: Office for National Statistics
Notes:
- The data in this chart covers 1997 to 2015
Download this chart Figure 10: Annual growth of current business investment and previously published, chained volume measure
Image .csv .xlsTable 3 shows the effect of the revisions to business investment and GFCF on gross domestic product (GDP) growth. The revisions in 2015 have led to GFCF contributing 0.5% to GDP growth compared with 0.7% in our previously published estimate.
Table 3: Percentage point contribution of business investment and gross fixed capital formation to GDP growth, UK, 1998 to 2015, chained volume measures
| Business investment | Gross fixed capital formation | |||||
| Previous estimate1 | Latest estimate2 | Revision3 | Previous estimate1 | Latest estimate2 | Revision3 | |
| 1998 | 1.1 | 1.1 | 0.0 | 1.4 | 1.4 | 0.0 |
| 1999 | 0.1 | 0.2 | 0.0 | 0.4 | 0.5 | 0.0 |
| 2000 | 0.4 | 0.4 | 0.0 | 0.6 | 0.6 | 0.0 |
| 2001 | -0.5 | -0.5 | 0.0 | -0.2 | -0.2 | 0.0 |
| 2002 | 0.0 | 0.0 | 0.0 | 0.5 | 0.5 | 0.0 |
| 2003 | 0.0 | 0.0 | 0.0 | 0.4 | 0.4 | 0.0 |
| 2004 | -0.3 | -0.3 | -0.1 | 0.5 | 0.5 | 0.0 |
| 2005 | 1.2 | 1.4 | 0.1 | 0.6 | 0.6 | 0.0 |
| 2006 | -0.7 | -0.7 | 0.0 | 0.5 | 0.6 | 0.0 |
| 2007 | 0.9 | 0.8 | -0.1 | 1.0 | 1.0 | 0.0 |
| 2008 | -0.1 | -0.1 | 0.0 | -1.1 | -1.2 | -0.1 |
| 2009 | -1.5 | -1.5 | 0.0 | -2.5 | -2.6 | -0.1 |
| 2010 | 0.5 | 0.5 | 0.0 | 0.8 | 0.8 | 0.0 |
| 2011 | 0.4 | 0.4 | -0.1 | 0.3 | 0.3 | 0.0 |
| 2012 | 0.5 | 0.6 | 0.2 | 0.2 | 0.4 | 0.1 |
| 2013 | 0.2 | 0.2 | 0.0 | 0.4 | 0.5 | 0.1 |
| 2014 | 0.4 | 0.4 | -0.1 | 1.2 | 1.1 | -0.1 |
| 2015 | 0.5 | 0.5 | 0.0 | 0.7 | 0.5 | -0.1 |
| Source: Office for National Statistics | ||||||
| Notes: | ||||||
| 1Business investment estimates published on 26 May 2016. | ||||||
| 2Business investment estimates published on 30 June 2016. | ||||||
| 3Revisions may not sum due to rounding. | ||||||
Download this table Table 3: Percentage point contribution of business investment and gross fixed capital formation to GDP growth, UK, 1998 to 2015, chained volume measures
.xls (29.2 kB)Table 4 shows the effect of the revisions to business investment on GFCF growth. The largest revision is in 2012, with the business investment contribution estimated at 4.0 percentage points, 1.2 percentage points higher than our previous estimate. In 2015, the contribution has been revised down by 0.1 percentage points to 2.8 percentage points.
Table 4: Percentage point contribution of business investment to gross fixed capital formation growth, UK, 1998 to 2015, chained volume measures
| Previous estimate1 | Latest estimate2 | Revision3 | |
| 1998 | 6.0 | 6.2 | 0.2 |
| 1999 | 0.7 | 0.8 | 0.1 |
| 2000 | 2.3 | 2.3 | 0.0 |
| 2001 | -2.9 | -3.0 | 0.0 |
| 2002 | 0.1 | 0.0 | -0.1 |
| 2003 | -0.1 | -0.1 | 0.0 |
| 2004 | -1.5 | -1.8 | -0.4 |
| 2005 | 7.0 | 7.8 | 0.8 |
| 2006 | -3.7 | -4.0 | -0.3 |
| 2007 | 4.8 | 4.6 | -0.3 |
| 2008 | -0.3 | -0.6 | -0.2 |
| 2009 | -8.9 | -8.7 | 0.2 |
| 2010 | 3.2 | 3.2 | 0.0 |
| 2011 | 2.7 | 2.3 | -0.3 |
| 2012 | 2.8 | 4.0 | 1.2 |
| 2013 | 1.3 | 1.5 | 0.2 |
| 2014 | 2.7 | 2.2 | -0.5 |
| 2015 | 2.9 | 2.8 | -0.1 |
| Source: Office for National Statistics | |||
| Notes: | |||
| 1 Business investment estimates published on 26 May 2016. | |||
| 2 Business investment estimates published on 30 June 2016. | |||
| 3 Revisions may not sum due to rounding. | |||
Download this table Table 4: Percentage point contribution of business investment to gross fixed capital formation growth, UK, 1998 to 2015, chained volume measures
.xls (28.2 kB)Revisions in this publication are in line with National Accounts revisions policy and declared changes that are part of the Blue Book 16 publication. Revisions occur as far back as data is available, though 1997 onwards is published in this release. To find data prior to 1997, please go to our time series dataset.
More information on these changes can be found in an article released by us on the Impact of Blue Book 2016 changes on current price and chained volume measure Gross Domestic Product and earlier national accounts articles.
Nôl i'r tabl cynnwys6. Economic background
Comparing gross fixed capital formation (GFCF) between Quarter 1 (Jan to Mar) 2016 and Quarter 1 2015, there was an increase of 0.7%. For 12 consecutive periods there has been growth in each quarter compared with the same quarter of the previous year. However, the size of that growth has slowed since the middle of 2015. In Quarter 1 2016, GFCF contracted by 0.1% when compared with Quarter 4 (Oct to Dec) 2015, following a 1.0% contraction between Quarter 3 (July to Sept) 2015 and Quarter 4 2015.
The fall in GFCF in Quarter 1 2016 was driven by a fall in general government and business investment, which contributed -0.4 and -0.3 percentage points to overall GFCF respectively. Investment in private sector dwellings and private sector cost of ownership transfer on non-produced assets were the only positive contributions to total GFCF in Quarter 1 2016. This coincided with a 20% increase in residential transactions, preceding the pre-announced change in stamp duty on additional properties in April 2016 (Bank of England’s Inflation Report).
Comparing Quarter 1 2016 with the previous quarter, business investment contracted by 0.6% following a 2.2% contraction between Quarter 3 2015 and Quarter 4 2015. This movement in business investment in the latest quarter has led to a reduction in its share of GFCF to 56.6%, its lowest share since Quarter 3 2014. In its latest Inflation Report, the Bank of England (BoE) noted that investment in the oil and gas industries has fallen in recent quarters. In 2015, our data shows that investment in “other production” (which includes mining and quarrying) fell when compared with 2014. This fall coincided with a 41.6% fall in oil prices over 2015.
Movements in business investment can sometimes be explained by lending conditions, found in the BoE’s Inflation Report, which highlights the state of lending conditions in the recent period. The fall in loans was due to decreasing demand rather than a contraction in supply. There has been a softening demand for loans by large companies, coupled with a slowdown in the commercial real estate market. Business investment also contracted on a quarter-on-quarter a year ago basis in Quarter 1 2016, which is the first quarter-on-quarter a year ago contraction since Quarter 1 2010.
By asset the contraction in GFCF was driven by other buildings and structures and transfer costs, which contributed -1.5 percentage points to the decrease. In contrast, transport equipment investment had a positive contribution to GFCF and grew by 18.7% in Quarter 1 2016.
Nôl i'r tabl cynnwys7. Where to find more of our data
We also publish additional analyses of GFCF, business investment and the Quarterly Acquisitions and Disposals of Capital Assets Survey, which have been created in response to user requests. For enquiries about user-requested data email gcf@ons.gov.uk.
Nôl i'r tabl cynnwys8. Adjustments, revisions and response rates
Adjustments
Large capital expenditure tends to be reported later in the data collection period than smaller capital expenditure. This means that larger expenditures are often included in the revised (month 3) results, but are not reported in time for the provisional (month 2) results, leading to a tendency towards upwards revisions in the later estimates for business investment and gross fixed capital formation (GFCF). Following investigation of the impact of this effect, from Quarter 3 (July to Sept) 2013, a bias adjustment was introduced to GFCF and its components in the revised estimate. A bias adjustment of £0.6 billion has been included in the revised (month 3) release for Quarter 1 (Jan to Mar) 2016. This adjustment will be reassessed in line with previous revisions and will be updated when Quarter 1 2016 is next revised in the Quarter 2 (Apr to June) 2016 revised release.
To try and improve the quality of the response from our respondents, clearer instructions were added to the Quarterly Survey of Capital Expenditure. These updates are outlined in the provisional Quarter 1 2015 business investment release. Feedback from some respondents indicated that they had been misreporting their asset breakdown and were correcting this on the new questionnaire. We found that some respondents were reporting new construction work (NCW) as other capital equipment (OCE). From Quarter 1 2015, respondents to the survey are now reporting more in NCW at the expense of OCE. To remain consistent with the previous data, we have made some adjustments to the assets in the current price series in Quarter 1 2015, Quarter 2 2015, Quarter 3 2015, Quarter 4 (Oct to Dec) 2015 and Quarter 1 2016. These adjustments are shown in Table 5.
Table 5: Adjustments made to buildings and other machinery to account for improved survey information, UK, Quarter 1 (Jan to Mar) 2015 to Quarter 1 (Jan to Mar) 2016
| Period | Adjustment to buildings (£ billion) | Adjustment to machinery (£ billion) |
| Q1 2015 | -1.5 | 1.5 |
| Q2 2015 | -2.1 | 2.1 |
| Q3 2015 | -1.9 | 1.9 |
| Q4 2015 | -1.9 | 1.9 |
| Q1 2016 | -1.9 | 1.9 |
| Source: Office for National Statistics | ||
| Notes: | ||
| 1. Q1 is Quarter 1 (Jan to Mar) | ||
| 2. Q2 is Quarter 2 (Apr to June) | ||
| 3. Q3 is Quarter 3 (July to Sept) | ||
| 4. Q4 is Quarter 4 (Oct to Dec) | ||
Download this table Table 5: Adjustments made to buildings and other machinery to account for improved survey information, UK, Quarter 1 (Jan to Mar) 2015 to Quarter 1 (Jan to Mar) 2016
.xls (27.1 kB)Survey response rates
Table 6 presents the provisional (month 2) and revised (month 3) response rates for the Quarterly Acquisitions and Disposals of Capital Assets Survey (QCAS). The estimates in this release are based on the Quarter 1 2016 month 3 (revised) survey results.
Table 6: UK response rates for quarterly acquisitions and disposals of capital assets survey. Quarter 1 (Jan to Mar) 2015 to Quarter 1 (Jan to Mar) 2016
| At month 2 (provisional) | At month 3 (revised) | |||||
| Period | Survey response rates / % | Period | Survey response rates / % | |||
| 2015 | Q1 | 67.3 | 2015 | Q1 | 88.8 | |
| Q2 | 70.8 | Q2 | 88.5 | |||
| Q3 | 72.1 | Q3 | 88.4 | |||
| Q4 | 68.6 | Q4 | 89.8 | |||
| 2016 | Q1 | 69.2 | 2016 | Q1 | 85.1 | |
| Source: Office for National Statistics | ||||||
| Notes: | ||||||
| 1. Q1 is Quarter 1 (Jan to Mar) | ||||||
| 2. Q2 is Quarter 2 (Apr to June) | ||||||
| 3. Q3 is Quarter 3 (July to Sept) | ||||||
| 4. Q4 is Quarter 4 (Oct to Dec) | ||||||
