Cynnwys
- Authors
- Executive summary
- Concepts
- Background
- Changes for Blue Book 2017
- Choice of last base year and reference year
- Treatment of other national accounts consistent outputs
- Consequences of new method
- Illustration of new approach
- Conclusion
- References
- Annex A: Illustrative month-by-month changes for 2017
2. Executive summary
As announced in Latest developments to national accounts and balance of payments – changes to be implemented for Blue Book 2017 and Pink Book 2017, this article describes the methods improvements required to deliver against our principles for measuring prices and volumes.
The practice, up until Blue Book 2016, has been to set the last base year to the reference year. From Blue Book 2017 onwards, the UK will separate the reference year from the last base year and set the reference year to the latest balanced year through the Supply and Use Framework. The reference year would subsequently be moved on each year in line with the most recently balanced year in the Supply and Use Balance.
This change to the calculation of chained volume measure (CVM) data brings the UK in line with international best practice and improves the international comparability for the tail of the series. The current practice of keeping the last base year and reference year at t-3 years will change so that:
the last base year is the latest full year before the reference period, in effect t-1 year
the reference year moves to t-2 years, the first balanced year of Supply and Use Tables (SUT) data
The trade-off with the improved methodology is that additivity is lost in the tail. Users should also be aware of the revised process so that the last base year is changed in the Quarter 1 (Jan to Mar) release.
Nôl i'r tabl cynnwys3. Concepts
While aggregating national accounts data in current prices is a straightforward case of adding transactions together, the aggregation of volume data is more complicated. The value of a single product is described by both its price and quantity. The price of a product is defined as the value of 1 unit of that product. Hence the value of a transaction is equal to the price per unit of quantity multiplied by the number of units of quantity (also known as current prices).
Although quantities work for single products, aggregating products together is a problem as you cannot, for example, add apples and pears together. In order to combine the series you need to use a weighting method. The simplest method of aggregating quantities to volumes is by using the prices of the base period, where the volume data is divided by the average prices of the base period.
This method is acceptable in the short-term, but over time the weighting structure becomes less accurate as the volume series moves away from the base period. This is because the relative value of the components may change over time. For example, at time t, the base year, it may be possible to purchase 2 apples for the price of 1 pear. If at time t+5, the price of apples has not changed, and nor has the amount of money spent in current prices, but now it is possible to buy 5 pears for the price of 2 apples, using the same weighting at time t+5 as for time t will underestimate the volume of pears. To resolve this issue, it was standard practice to update the base period every 5 years and link the resultant volume series together. This method was used in the UK until 2002.
However, current best practice, as set out in System of National Accounts 2008 (UN, 2009) and European System of Accounts 2010 (Eurostat 2013a), is to express the volume series in the prices of the previous year. Each volume series is then linked together to form what is known as chained volume measure (CVM) – to reflect the fact that the volume series, expressed in previous years’ prices, are linked together to form a consistent chain-linked series. The Explanation of terms section explains the terms mentioned throughout this paper. It is the detail of the CVM method that is discussed in this article.
Explanation of terms
Current prices
Estimates valued in the prices of the period when the activity occurred. Also referred to as “nominal prices”.
Volume index
At the elementary level (that is, detailed disaggregated level) a volume index is most commonly presented as a weighted average of the proportionate changes in the quantities of a specified set of goods or services between 2 periods of time. In a volume measure, the estimates for all periods are in the same price.
Chain volume measures
The result of joining together 2 indices that overlap in 1 period by rescaling one of them to make its value equal to that of the other in the same period, thus combining them into a single time series. Also referred to as “chain-linked values”.
Chain-linking
The process of linking together volume series using link factors to form a consistent chain volume measure time series. There are 3 main linking methods: quarterly overlap, annual overlap and over the year.
Constant prices
Term referring to expressing values in terms of a base period. Also used to refer to the practice of 5-yearly chain-linking as used before 2003 in the UK. Also referred to as “fixed base”.
Previous years’ prices
The average price in the year preceding the period in which the activity took place. The series derived from multiplying the volume series in the current period, by the average price of the previous year. This process is also known as unchaining. Previous years’ prices are additive and are the method by which volume series can be aggregated together.
Tail
Used to refer to the fixed base volume calculation used after the last base year for a CVM series – also referred to as “fixed base tail”. In effect, 2 methods joined together in the last base year.
Base year or period
The year or period in which volume series are expressed using the value of the average prices.
Last base year or period
This is the last year or period in a chain volume series which is used as a base year or period. Series in the last base year are additive.
Reference year or period
The year or period in which the chain volume measure is equal to the current price value or for index numbers, where index number is 100. In the reference year, the implied deflator is equal to 1, and series are additive.
Additivity
The property pertaining to a set of interdependent index numbers, levels or growth rates related by definition or by accounting constraints under which an aggregate is defined as the sum of its components; additivity requires this identity to be preserved when the values of both an aggregate and its components in some reference period are extrapolated over time using a set of volume index numbers. In the case of chain volume measures, additivity is lost for all years up to the last base year.
Quarterly overlap
Linking method where the links apply to the volumes of the fourth quarter in the previous year at average prices of the year – this requires the resultant series to be benchmarked to the annual volume series. This method preserves the quarter-on-quarter growth rates over the link period.
Annual overlap
Linking method where the links apply to the volumes of the previous year at average prices of the year. This method distorts the quarter-on-quarter growth over the link period.
Over-the-year method
The over-the-year method requires compiling a separate link factor for each type of quarter. Each of the quarterly values in year y-1 in the average prices of year y-2 is multiplied by its own link factor. This method distorts all the quarter-on-quarter growth rates but not the quarter on the same quarter a year ago growth rates. This method should be avoided.
More details on these terms can be found in the Handbook on Quarterly National Accounts (Eurostat, 2013b) and the Handbook on Price and Volume (Eurostat, 2016).
Nôl i'r tabl cynnwys4. Background
The UK first introduced annual chain-linking of volume data in 2003. At that time, the UK chose the following approach for calculating chained volume measure (CVM) data (see section 3.1 for terms used in this paper).
The year selected to act as “last base year” was aligned to the “reference year”; that is, the most recent period which had undergone rebalancing (had gone through balancing twice) through the Supply and Use Framework. Typically this year has a 3-year lag (t-3). The year selected is updated annually for both “reference year” and “last base year”. Therefore, as at Blue Book 2016, the UK has a “last base year” and “reference year” of 2013.
Under this model, volume data for years later than the last base year was calculated using the prices of the last base year – rather than previous years’ prices. As a consequence, the tail of the CVM series has a fixed base year and the data are additive in these periods. The UK uses the quarterly overlap method for linking quarterly and monthly data (this method, as well as the alternatives, is explained in section 3.1)
Figure 1: Illustration of current treatment of last base year and reference year

Source: Office for National Statistics
Download this image Figure 1: Illustration of current treatment of last base year and reference year
.png (8.4 kB)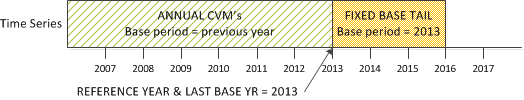
This article is accompanied by a full methodology article explaining the UK methodology in detail.
Nôl i'r tabl cynnwys5. Changes for Blue Book 2017
Following a quality review of the methodology for calculating chained-volume measures (CVMs) against the recent European System of Accounts 2010 Manual (Eurostat 2013a), the UK method from 2003 is inconsistent with the treatment in the tail of the series. Specifically, in section 10.20:
The issue of previous years’ prices was not included in European System of Accounts 1995 Manual (Eurostat, 1996), but was later covered in the Commission Decisions 715/98 and 2002/990 which addressed the principles for measuring prices and volumes.
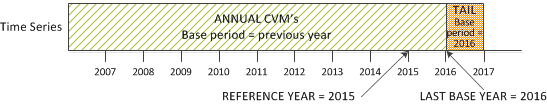
To ensure consistency with international best practice, the planned improvements will be to update the volume series calculation to the latest last base year as soon as data for it are available. Using 2018 as an illustration, this would mean that when the UK publishes preliminary gross domestic product (GDP) in April 2018 for Quarter 1 (Jan to Mar) 2018, the annual data for 2017 would be available and should be used for calculating the volume data using the prices of the newly available previous year. This is illustrated in Figure 3 later in this article.
It is worth noting that once the full year of data is available, for example when the 2017 Quarter 4 (Oct to Dec) data are released in January to March 2018, the last base year is not moved on as the previous year is still 2016. It is only once the first quarter of 2018 is published that the last base year moves on to 2017. The UK approach has historically been justified on the grounds of data availability and quality, as the first re-balanced year of data through the Supply and Use Framework are used as the last base year at t-3. The new approach would involve using the first balanced year for current price data and unbalanced data (see section 6.1 for details).
Figure 2: Treatment of last base year and reference year from September 2017
Source: Office for National Statistics
Download this image Figure 2: Treatment of last base year and reference year from September 2017
.png (8.5 kB)
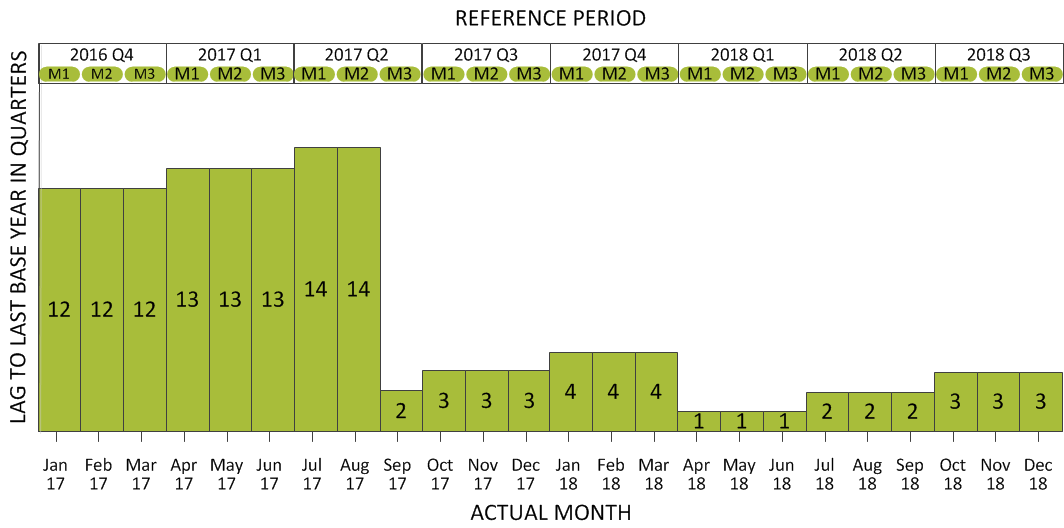
Figure 3 shows the impact of the new methodology in terms of the lag from the latest quarter to the last base year. Under the current method, the lag will be 14 quarters at the 2017 Quarter 2 (Apr to June) second estimate in August 2017. Under the new method from September 2017 onwards, the maximum lag to the last base year will be 4 quarters.
Figure 3: Illustration of lag to last base year from latest quarterly release
Source: Office for National Statistics
Download this image Figure 3: Illustration of lag to last base year from latest quarterly release
.png (37.0 kB)
6. Choice of last base year and reference year
As previously noted, the practice, up until Blue Book 2016, had been to set the last base year to the same year as the reference year. From Blue Book 2017 onwards, the UK will separate the reference year from the last base year and set it to the latest balanced year through the Supply and Use Framework. The reference year would subsequently be moved on each year at the Blue Book Quarterly National Accounts in line with the latest balanced year in the Supply and Use Balance.
These stages are explained in more detail below.
Annual GDP process including Supply and Use Tables
Stage One: Unbalanced
Annual data sources, as they become available, provide more detail than the short-term indicators which inform the quarterly releases and are published and incorporated the following year. This is known as “Blue Book One stage”. In this stage, the latest complete year is year (t-1), where t is the year of our Blue Book. This revision will take place 6 to 18 months after the month 3 estimate has been published. For the year t-1 in this stage, the 3 approaches to measuring GDP are not fully balanced, and statistical discrepancies are published for the expenditure and income measures.
Stage Two: First balance
The “Blue Book One stage” estimates are again revised at the “Blue Book Two stage”, typically 18 to 30 months after the preliminary GDP estimate is published. The first annual supply and use tables are produced for the year t-2 using annual sources such as the Annual Business Survey (ABS) together with a range of other benchmark sources and revised data. So, for example, the 2016 Blue Book included the first such table for the year 2014, incorporating the first set of results from the ABS for that year. When balanced, the Annual Supply and Use Tables have removed the need for any annual statistical discrepancies between the 3 measures of GDP.
Stage Three: First rebalance
The UK policy for annual chain-linking was to use the first rebalanced set of SUT data as the last base year.
Abridged from Mahajan (2006)
Nôl i'r tabl cynnwys7. Treatment of other national accounts consistent outputs
The national accounts are fully integrated in the UK, which means that short-term indicators (such as the Index of Production, Index of Services, retail sales and construction) trade statistics, balance of payments, government finance statistics and regional accounts are all consistent. As a result, the same methodological change will be made at the same time as the national accounts changes.
Nôl i'r tabl cynnwys8. Consequences of new method
The introduction of this change raises a number of issues for users of chained volume measure (CVM) data to note. Consistent method: The current approach of using 2 different methods for calculating volumes will be removed and the whole volume time series will be calculated using the prices of the previous year. This provides a better calculation of growth as volume series are based on the previous years’ prices for all years rather than the current practice of having a 3-year lag until the previous years’ prices are adopted.
International comparability:
The method change brings the UK data in line with other countries and the best practice set out in ESA 2010.
Loss of additivity:
CVM data are currently additive for the last base year onwards. The new method means that after re-referencing, CVM data are only additive for annual data in the last base year and reference year.
Timing of introducing last base year:
Currently, the last base year is moved on during the annual update at the time of the Blue Book. If this process was maintained, for a September Blue Book Quarterly National Accounts release, it would mean that the last base year was not being used. For this reason, the last base year will be moved on as soon as it is available. In practice, this would be at the first preliminary estimate of GDP for Quarter 1 (Jan to Mar) released each April.
Reference year:
The reference year will be separated from the last base year and will continue to be updated during the annual balance, which the UK typically set to t-2 years. This is because the reference year has to be outside the open period window used in a normal quarterly release (that is, non Blue Book quarterly releases). This is to avoid revisions to the levels of the entire back series occurring every time the reference year was revised (if the reference year was in the quarterly GDP revisions period). It is also worth noting that the reference year and last base year won’t always be 1 year different, at some points they will be 2 years apart. For example, the reference year will be updated at the Blue Book Quarterly National Accounts so for a period of time each year the reference year and the last base year will be 2 years apart.
Nôl i'r tabl cynnwys9. Illustration of new approach
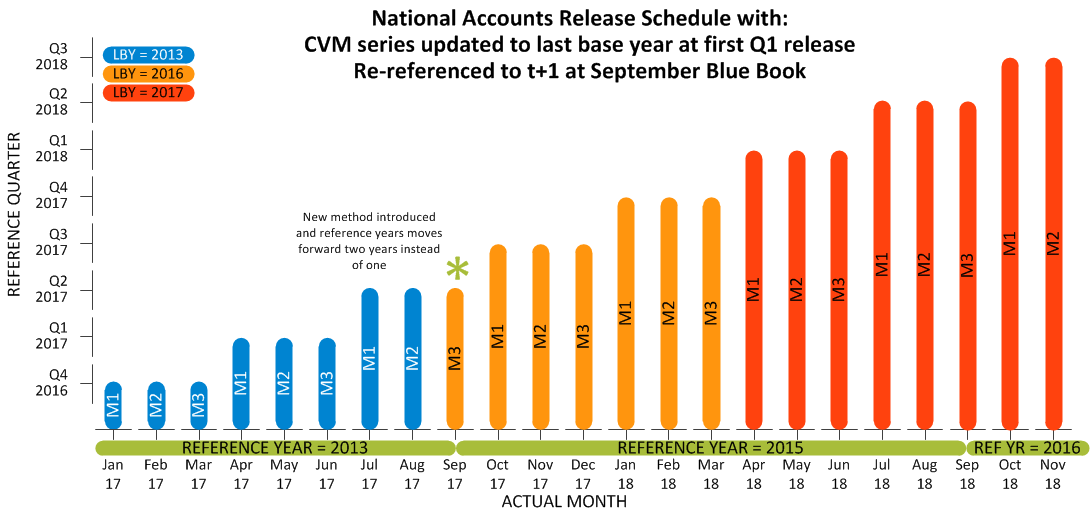
The changes are illustrated in Figure 4, which shows the GDP publications and also reflects the proposed publication schedule (of introducing this change in September 2017).
Figure 4: Illustration of last base year and reference year changes by each GDP release
Source: Office for National Statistics
Download this image Figure 4: Illustration of last base year and reference year changes by each GDP release
.png (65.4 kB)
In Figure 4, the x-axis shows the actual month, and the y-axis shows the reference period. For example, the first observation shows that the first estimate of Quarter 4 (Oct to Dec) 2016 will be published in January 2017. The graph shows how the method will change in September 2017. The colour of each observation reflects the last base year used; the reference year used is indicated underneath the x-axis.
Nôl i'r tabl cynnwys10. Conclusion
This change to the calculation of chained volume measure (CVM) data brings the UK in line with international best practice and improves the international comparability for the tail of the series. The current practice of keeping the last base year and reference year at t-3 years will change so that:
the last base year is the latest full year before the reference period, in effect t-1 year
the reference year moves to t-2 years, the first balanced year of Supply and Use Table SUT data
The trade-off with the improved methodology is that additivity is lost in the tail. Users should also be aware of the revised process so that the last base year is changed in the Quarter 1 (Jan to Mar) release.
A methodological paper explaining the process of chain-linking accompanies this article and an article will follow illustrating the impact of introducing the revised method. Annex A sets out what the last base year and reference year will be for each release until the end of 2018.
Nôl i'r tabl cynnwys11. References
Drew S, Lewis P & McLaren C (2016) Chain-linking methods used within the United Kingdom National Accounts
European Commission (1996) Commission Decision clarifying Annex A to Council Regulation (EC) No 2223/96 on the European system of national and regional accounts in the Community as concerns the principles for measuring prices and volumes (98/715/EC)
European Commission (2002) Commission Decision of 17 December 2002 further clarifying Annex A to Council Regulation (EC) No 2223/96 as concerns the principles for measuring prices and volumes in national accounts (2002/990)
Eurostat (1996) European System of Accounts 1995 Manual
Eurostat (2001) Handbook on Price and Volume 2001
Eurostat (2013a) European System of Accounts 2010 Manual
Eurostat (2013b) Handbook on quarterly national accounts – 2013 edition
Eurostat (2016) Handbook on Price and Volume 2016 edition
Hughes M (2016) Latest developments to national accounts and balance of payments - changes to be implemented for Blue Book 2017 and Pink Book 2017
Mahajan S (2006) Development, Compilation and Use of Input-Output Supply and Use Tables in the UK National Account, Economic Trends 634
United Nations (2009) System of National Accounts 2008
Our previous articles on chain-linking:
Robjohns J (2006) Methodology Notes: Annual chain-linking, Economic Trends 630, pp 25–28
Ruffles D and Tuke A (2002) The effect of annual chain-linking on components of the expenditure measure of GDP, Economic Trends 587, pp 39–43
Soo A and Charmokly Z (2003) The application of annual chain-linking to the Gross National Income system, Economic Trends 593, pp 41–47
Tuke A and Beadle J (2003) The effect of annual chain-linking on Blue Book 2002 annual growth estimates, Economic Trends 593, pp 29–40
Tuke A (2002) Analysing the effects of annual chain-linking on the output measure of GDP, Economic Trends 581
Tuke A and Reed G (2001) The effects of annual chain-linking on the output measure of GDP, Economic Trends 575, pp 37–53
Nôl i'r tabl cynnwys12. Annex A: Illustrative month-by-month changes for 2017
The following table provides an illustration based on implementing the change at Blue Book 2017 in September 2017 and the following Blue Book being in September.
Table 1: Reference Period, Last Base Year and Reference Year by GDP Release Month
| Calendar Month | Reference Period | Last Base Year | Reference Year |
| May-17 | Q1 2017 | 2013 | 2013 |
| Jun-17 | Q1 2017 | 2013 | 2013 |
| Jul-17 | Q2 2017 | 2013 | 2013 |
| Aug-17 | Q2 2017 | 2013 | 2013 |
| Sep-17 | Q2 2017 | 2016 | 2015 |
| Oct-17 | Q3 2017 | 2016 | 2015 |
| Nov-17 | Q3 2017 | 2016 | 2015 |
| Dec-17 | Q3 2017 | 2016 | 2015 |
| Jan-18 | Q4 2017 | 2016 | 2015 |
| Feb-18 | Q4 2017 | 2016 | 2015 |
| Mar-18 | Q4 2017 | 2016 | 2015 |
| Apr-18 | Q1 2018 | 2017 | 2015 |
| May-18 | Q1 2018 | 2017 | 2015 |
| Jun-18 | Q1 2018 | 2017 | 2015 |
| Jul-18 | Q2 2018 | 2017 | 2015 |
| Aug-18 | Q2 2018 | 2017 | 2015 |
| Sep-18 | Q2 2018 | 2017 | 2016 |
| Oct-18 | Q3 2018 | 2017 | 2016 |
| Nov-18 | Q3 2018 | 2017 | 2016 |
| Dec-18 | Q3 2018 | 2017 | 2016 |