Cynnwys
- Main findings
- Background
- Introduction
- Content
- Where to find more general information on GDP
- How do other countries implement GDP revisions?
- How does the UK revisions performance compare with other countries?
- Testing GDP revisions for bias
- Removing the UK RPI to CPI methodological change
- GDP revisions during the economic downturn and recovery – a country comparison
- Alternative ways of assessing GDP revisions performance
- Conclusions
- Next steps
1. Main findings
Confirmation of the recent Organisation for Economic Co-operation and Development (OECD) report which stated that the UK was amongst the best performing nations when it came to the size of gross domestic product (GDP) revisions.
There is no statistically significant bias to the UK GDP revisions at 1 year, 2 years or 3 years after the initial estimates at the 10% significance level.
Longer-term structural revisions to GDP in the UK, such as the move to the European System of Accounts 2010, are in line with most other countries if the UK’s unique deflator methodological improvement is removed.
The implementation of European System of Accounts 2010 (ESA 2010) and a period of addressing gross national income reservations in each year from 2012 to 2015 does seem to have had slightly more of an impact on the UK revisions performance during the economic downturn and recovery period than for some other countries, but the UK revisions performance overall remains good.
While there are slightly more revisions in the UK in the first and last quarters of the year on average, as a result of the methods used to compile the quarterly path, the differences between the quarters are no larger than for many other countries.
Despite the increased variability in GDP growth seen as the UK entered and gradually exited from the economic downturn of 2008 to 2009, the mean squared revision has remained comparable with the previous period from 1997 to 2006.
Nôl i'r tabl cynnwys2. Background
Revisions to GDP are inevitable at some point in the lifetime of economic statistics. It is the role of the Office for National Statistics (ONS) to produce the best possible estimate of United Kingdom (UK) gross domestic product (GDP) using all of the available information at that time. Therefore the only way to avoid subsequent revisions to GDP as more information becomes available would be to either delay publication until all the relevant information has been received, which could be up to 3 years after the reference period, or to publish a first estimate and then ignore any subsequent new data and any methodological improvements. So revisions should be treated as generally a good thing, as long as the reasons for them are documented by ONS and communicated to users.
The balance between necessary revisions and revisions for minor issues is achieved through a published revisions policy which has now been updated to reflect a National Statistics Quality Review: Review of National Accounts and Balance of Payments recommendation (page 11) by grouping annual benchmark revisions into a single GDP publication, and limiting revisions in other quarters.
Nôl i'r tabl cynnwys3. Introduction
In July 2015 the Organisation for Economic Co-operation and Development (OECD) published a report titled Revisions of quarterly GDP in selected OECD Countries to investigate and compare the revisions performance across a group of OECD member countries. In January 2016 we published the article Revisions to GDP and components in Blue Books 2014 and 2015. This provided users with an update on the GDP chained volume measure (CVM) revisions performance following the introduction of the European System of Accounts 2010 (ESA 2010) in September 2014 and the completion of the remaining ESA 1995 (ESA 95) gross national income (GNI) reservations, some in September 2014 (as part of Blue Book 2014) and the remainder in September 2015 as part of Blue Book 2015.
Our article showed that GDP revisions remain small and unbiased over the initial Blue Book revisions periods, and noted the July 2015 comments by the OECD that “France, Italy, Norway and the United Kingdom record the lowest mean revisions for both quarter on quarter and year on year growth rates”. However, our article also acknowledged the perception that the UK has seen more upward revisions beyond the typical 5-year revisions analysis period than many other countries, in part due to the move in 2011 from using the Retail Price Indices (RPI) to using the Consumer Price Indices (CPI) as the main source for deflation for the expenditure measure of GDP. The article stated that further work was ongoing within ONS, both on international comparisons of GDP revisions and on estimating the impact on the UK revisions performance of the move from using RPI to CPI for deflation.
In March 2016 we published a short article titled International comparison of revisions to GDP (chained volume measure) within the March Economic Review. Today’s article presents in full the findings of that article as well as looking in more depth at the revisions profile of some of the countries selected for the OECD report.
Nôl i'r tabl cynnwys4. Content
This article will:
- describe how other countries implement GDP revisions
- compare the UK GDP revisions performance with other countries
- test the GDP revisions for the UK and of all these countries for bias
- assess the impact on UK revisions from removing the major UK methodological change of deflating using the Consumer Price Indices (CPI) rather than the Retail Prices Indices (RPI), which was unique to the UK
- look at the GDP revisions performance across countries during the 2008 to 2009 economic downturn and recovery
- assess some alternative ways of measuring GDP revisions
- draw conclusions and recommend next steps
5. Where to find more general information on GDP
This version of the article assumes that you are familiar with the approach used to compile the various vintages of GDP, but the Revisions to GDP and components in Blue Books 2014 and 2015 (Long version) gives much more information on the changes, or you can follow the reference links provided at the end of this article to find all the details.
Nôl i'r tabl cynnwys6. How do other countries implement GDP revisions?
Most countries publish a revisions policy on their website, although it is not always obvious when it was last updated, or indeed that it is being followed. Several of the countries in this study described annual revisions as always happening in a certain quarter, but the OECD dataset showed revisions occurring in different quarters and to different frequencies. Therefore the links to revisions policies provided in the reference section of this article should be treated with some caution but they do show a consistent theme with most countries using quarterly rounds to revise their GDP estimates within the current year (sometimes also the 1 previous year). Annual benchmarking was almost unanimously contained within a single quarterly publication each year. Larger scale revisions to methodology and concepts vary by country, with some countries opening up the back history as and when required, while other countries had a more rigid policy of large scale methodological changes only every 4 or 5 years.
Where a country’s revisions policy explains a feature of their revisions performance in this article, this has been noted. Some of the revisions policies have been sourced from the Eurostat website where countries have submitted their quarterly national accounts inventory documents describing all the quality measures for their quarterly datasets.
Nôl i'r tabl cynnwys7. How does the UK revisions performance compare with other countries?
This section focuses on the UK’s revisions performance for GDP in chained volume measures. It expands the OECD’s comparison across countries by adding the latest quarterly data up to January 2015 publications to the comparative analysis and by looking at particular aspects of the UK revisions performance. It is based on data from the OECD real-time data and revisions database.
Figure 1 contrasts the mean revisions to GDP growth (quarter on quarter) for a selection of OECD countries, as well as some other G20 countries, at 4 stages in the estimation process: 5 months, 1 year, 2 years and 3 years after the period in question. Although the OECD analysis for many countries covers a period starting in 1994, incomplete data in some periods limits the number of countries that can be included in the analysis. Hence the comparison covers GDP estimates between the fourth quarter of 1998 and the second quarter of 2015, in order to include as many countries as possible in the comparison. Figure 2 shows similar comparative analysis but for GDP growth of quarter on the same quarter a year ago.
Figure 1: Chained Volume Measure, GDP growth, quarter on quarter, quarter 4 (October to December) 1998 to quarter 2 (April to June) 2015, selected OECD and G20 countries
Source: OECD real time data and revisions database
Download this chart Figure 1: Chained Volume Measure, GDP growth, quarter on quarter, quarter 4 (October to December) 1998 to quarter 2 (April to June) 2015, selected OECD and G20 countries
Image .csv .xls
Figure 2: Chained Volume Measure, GDP growth, quarter on same quarter a year ago, quarter 4 (October to December) 1998 to quarter 2 (April to June) 2015, selected OECD and G20 countries
Source: OECD real time data and revisions database
Download this chart Figure 2: Chained Volume Measure, GDP growth, quarter on same quarter a year ago, quarter 4 (October to December) 1998 to quarter 2 (April to June) 2015, selected OECD and G20 countries
Image .csv .xlsThese figures show that most countries have upwards revisions across all data vintages, meaning that most countries underestimate GDP growth in their early estimates. The exceptions to this are Japan, Norway and the USA; France and New Zealand tend to see negative revisions to earlier estimates, followed by upward revisions to later estimates.
In Figure 1 for quarter on quarter revisions, the UK is, as stated by the OECD, in the group of countries with the lowest mean revisions, alongside Belgium, Finland, France, Italy, Portugal and Spain; all of these countries have mean revisions of less than +/- 0.05 percentage points across all vintages up to 3 years after first publication. Denmark has the unusual situation where the first revisions are larger than later revisions. The highest mean revisions are reported by Australia, Denmark, Korea and the USA, with at least 1 revision vintage for each of these countries over the +/- 0.10 percentage point threshold.
Figure 2 shows the mean revisions for quarter on the same quarter of a year ago GDP growth, and the pattern is similar. The UK’s 2 and 3 year revisions performance is slightly worse than in the quarter on quarter analysis (Figure 1) but, with revisions below the +0.20 percentage point category, the UK revisions performance remains good and broadly similar to most countries. The top performing countries here are Belgium, France, Germany, Italy, Norway and Spain at less than +/- 0.10 percentage points.
As well as looking at the mean revision, the mean absolute revision is a useful indicator as to the size of revisions. This is because it avoids the offsetting contributions on the mean revision from negative and positive revisions. Therefore if a country has large revisions which can be both positive and negative in equal measure then it can have a small mean revision, but it will show a substantial mean absolute revision. A downside to the mean absolute revision however is that because it does not show the sign of revisions, it does not give an indication of any possible directional bias.
For completeness Figures 3 and 4 show the absolute mean revisions for the same time periods and countries as Figures 1 and 2.
Figure 3: Chained Volume Measure, GDP growth Absolute revision, quarter on quarter, quarter 4 (October to December) 1998 to quarter 2 (April to June) 2015, selected OECD and G20 countries
Source: OECD real time data and revisions database
Download this chart Figure 3: Chained Volume Measure, GDP growth Absolute revision, quarter on quarter, quarter 4 (October to December) 1998 to quarter 2 (April to June) 2015, selected OECD and G20 countries
Image .csv .xls
Figure 4: Chained Volume Measure, GDP growth Absolute revision, quarter on same quarter a year ago, quarter 4 (October to December) 1998 to quarter 2 (April to June) 2015, selected OECD and G20 countries
Source: OECD real time data and revisions database
Download this chart Figure 4: Chained Volume Measure, GDP growth Absolute revision, quarter on same quarter a year ago, quarter 4 (October to December) 1998 to quarter 2 (April to June) 2015, selected OECD and G20 countries
Image .csv .xlsThese figures show that the UK mean absolute revision performance in relation to other countries is comparable with the mean revision performance, and the UK is still in the better performing group for quarter on quarter and quarter on the same quarter a year ago revisions performance under this measure.
Nôl i'r tabl cynnwys8. Testing GDP revisions for bias
While the magnitude and direction of revisions is important, it is also important to identify if there is a bias within a country’s revisions. Table 1 shows the mean revisions at different intervals, as per Figures 1 and 2, and indicates where the mean revision is statistically significant at the 10%, 5% and 1% level.
Table 1: Mean revison and assessment of statistical significance at different revision intervals for quarter on quarter and quarter on the same quarter a year ago CVM GDP growth rates, percentage points, quarter 4 (October to December) 1998 to quarter 2 (April to June) 2015
| UK | ||||||||
| Country | 5 months later | 1 year later | 2 years later | 3 years later | ||||
| QoQ | QoY | QoQ | QoY | QoQ | QoY | QoQ | QoY | |
| Australia | *0.06 | 0.01 | *0.11 | 0.07 | **0.01 | **0.19 | *0.13 | **0.28 |
| Belgium | 0.01 | 0.04 | 0.03 | 0.05 | 0.01 | 0.03 | 0.05 | 0.08 |
| Canada | 0.01 | 0.00 | 0.00 | 0.05 | ***0.04 | **0.17 | 0.06 | **0.22 |
| Denmark | **0.11 | **0.15 | 0.04 | 0.10 | 0.01 | 0.03 | 0.02 | -0.02 |
| Finland | 0.03 | 0.09 | -0.03 | 0.14 | 0.02 | 0.16 | 0.01 | 0.19 |
| France | **-0.03 | -0.02 | -0.03 | 0.01 | -0.01 | ***0.17 | 0.02 | ***0.21 |
| Germany | 0.03 | 0.03 | 0.04 | 0.05 | **0.07 | 0.08 | 0.06 | 0.11 |
| Italy | 0.00 | 0.00 | 0.00 | 0.00 | -0.01 | 0.03 | 0.00 | 0.06 |
| Japan | -0.05 | -0.06 | -0.05 | -0.10 | -0.08 | -0.01 | -0.03 | 0.03 |
| Korea | 0.03 | 0.02 | 0.04 | 0.05 | 0.10 | *0.23 | 0.10 | *0.23 |
| Netherlands | 0.04 | **0.09 | 0.03 | 0.09 | 0.04 | **0.21 | 0.06 | *0.35 |
| New Zealand | -0.03 | -0.05 | -0.02 | -0.03 | 0.00 | 0.16 | 0.07 | 0.33 |
| Norway | -0.03 | -0.01 | -0.07 | 0.02 | -0.04 | -0.05 | -0.08 | -0.09 |
| Portugal | 0.03 | 0.01 | 0.02 | 0.04 | 0.03 | **0.18 | 0.03 | **0.24 |
| Spain | 0.00 | 0.01 | 0.00 | 0.03 | 0.01 | 0.00 | 0.02 | 0.07 |
| Switzerland | 0.02 | 0.01 | 0.01 | 0.00 | 0.00 | 0.07 | 0.06 | 0.19 |
| UK | 0.02 | 0.04 | 0.01 | 0.06 | 0.03 | 0.17 | 0.04 | 0.17 |
| USA | 0.00 | -0.01 | -0.01 | -0.09 | **-0.01 | *-0.46 | *-0.14 | *-0.56 |
| Average | 0.01 | 0.02 | 0.01 | 0.03 | 0.01 | 0.07 | 0.03 | 0.12 |
| Source: OECD real time data and revisions database | ||||||||
| Notes: | ||||||||
| 1. Statistical significance levels 1%* 5%** 10%*** | ||||||||
Download this table Table 1: Mean revison and assessment of statistical significance at different revision intervals for quarter on quarter and quarter on the same quarter a year ago CVM GDP growth rates, percentage points, quarter 4 (October to December) 1998 to quarter 2 (April to June) 2015
.xls (29.7 kB)Table 1 presents the data behind Figures 1 and 2 and confirms that the UK is amongst a group of countries with no statistically significant revisions across these 4 revision vintages. Other countries with a similar performance are Finland, Italy, Japan, Norway, Spain and Switzerland. Countries with some bias in some of their estimates at the 5% or 10% significance level include Canada, Denmark, France, New Zealand and Portugal. The countries with the highest levels of bias, often at the 1% significance level include Australia, Korea, the Netherlands and the USA.
So in terms of statistical significance of revisions, as well as absolute revisions, the UK revisions performance up to 3 years after the first GDP estimates is at least as good as most other countries, and better than many, and shows no systematic bias. It should be noted that major benchmarks are more likely to affect the longer time span revisions so countries such as the Netherlands who only benchmark periodically may not be showing true “bias” in their quarterly GDP growth estimates.
How does the revisions performance change when latest estimates are included?
Major benchmarks and longer-term methods improvements become even more relevant if we expand the analysis to include all revisions right up to the latest GDP releases of data in December 2015 for the time span Quarter 4 (Oct to Dec) 1998 to Quarter 2 (Jan to Mar) 2015. The same GDP growth revisions for quarter on quarter and quarter on the same quarter a year ago are shown in Figures 5 and 6, with revisions from the first estimate to the latest included.
Figure 5: Mean GDP growth revisions, including latest estimates, for quarter on quarter growth, chained volume measure, for selected OECD and G20 countries quarter 4 (October to December) 1998 to quarter 2 (April to June) 2015
Source: OECD real time data and revisions database
Download this chart Figure 5: Mean GDP growth revisions, including latest estimates, for quarter on quarter growth, chained volume measure, for selected OECD and G20 countries quarter 4 (October to December) 1998 to quarter 2 (April to June) 2015
Image .csv .xls
Figure 6: Mean GDP growth revisions, including latest estimates, for quarter on quarter a year ago growth, chained volume measure, for selected OECD and G20 countries quarter 4 (October to December) 1998 to quarter 2 (April to June) 2015
Source: OECD real time data and revisions database
Download this chart Figure 6: Mean GDP growth revisions, including latest estimates, for quarter on quarter a year ago growth, chained volume measure, for selected OECD and G20 countries quarter 4 (October to December) 1998 to quarter 2 (April to June) 2015
Image .csv .xlsFigures 5 and 6 show that the “latest” bar for most countries is by far the biggest revision, suggesting that revisions for many countries go on beyond the initial 3 year period of the OECD analysis. This can be explained by the later revisions being caused by more fundamental methodological improvements and changes to the national accounts framework, which tend to improve the accounts by identifying new concepts which can add to both GDP levels and, sometimes, to growth. For the UK, this was picked up by the recent Independent Review of UK Economic Statistics which gave similar possible explanations for the tendency for GDP to be revised up beyond the 3 to 4 year window of source data revisions. For many European countries the later revisions may also be explained in part by the completion of the European System of Accounts 1995 (ESA 95) gross national income (GNI) reservations, where many countries implemented a large number of improvements ahead of the October 2015 deadline.
The UK “latest” bars in Figures 5 and 6 are particularly noticeable, and are second only to the Netherlands in size. This is partly due to a number of GNI ESA 95 reservations being completed in recent years in the UK’s national accounts. However, within the January 2016 article we also noted that a further, important reason for the UK revisions performance being below average when looking beyond the initial data revisions could be the switch from using the RPI to the CPI as the main source of deflators for the expenditure approach to GDP, in Blue Book 2011. The next section looks at this aspect of UK GDP revisions.
Nôl i'r tabl cynnwys9. Removing the UK RPI to CPI methodological change
The switch from using the Retail Price Indices (RPI) to the Consumer Price Indices (CPI) as the main source of deflators for the expenditure approach to GDP was an improvement which the UK decided to implement in Blue Book 2011 as it was demanded by users and is in line with international best practice. However, this change would not have happened in other countries and so is a source of an one-off upward revision which is unique to the UK. The growth rate in RPI is typically higher than CPI. This "wedge" in the annual growth rates of quarterly data averaged just under 0.1 percentage points per quarter over the period 1997 to 2010. The use of a deflator with a lower growth rate would, all else being equal, tend to produce higher growth rates in the volume estimates of the statistic that is being deflated – in this case consumption, and hence the expenditure estimates of GDP.
To assess the impact of this improvement that was unique to the UK, we have isolated and removed GDP revisions caused by the switch from RPI to CPI deflation. Figures 7 and 8 show the same analyses as Figures 5 and 6 but the UK bars have been replaced with a version of GDP without the CPI switch included.
Figure 7: Mean GDP growth revisions, including latest estimates but removing the impact of the switch to CPI for the UK, for quarter on quarter growth, chained volume measure, for selected OECD and G20 countries quarter 4 (October to December) 1998 to quarter 2 (April to June) 2015
Source: OECD real time data and revisions database
Download this chart Figure 7: Mean GDP growth revisions, including latest estimates but removing the impact of the switch to CPI for the UK, for quarter on quarter growth, chained volume measure, for selected OECD and G20 countries quarter 4 (October to December) 1998 to quarter 2 (April to June) 2015
Image .csv .xls
Figure 8: Mean GDP growth revisions, including latest estimates but removing the impact of the switch to CPI for the UK, for quarter on quarter a year ago growth, chained volume measure, for selected OECD and G20 countries quarter 4 (October to December) 1998 to quarter 2 (April to June) 2015
Source: OECD real time data and revisions database
Download this chart Figure 8: Mean GDP growth revisions, including latest estimates but removing the impact of the switch to CPI for the UK, for quarter on quarter a year ago growth, chained volume measure, for selected OECD and G20 countries quarter 4 (October to December) 1998 to quarter 2 (April to June) 2015
Image .csv .xlsThis shows that when revisions for the UK are expressed on a more comparable basis the outcome is to reduce the size of the revisions for the “latest” vintage. Indeed without the revisions caused by the switch from RPI to CPI, the UK quarter on quarter performance for first estimate to “latest” is better than that for Australia, Belgium, Denmark, Korea, the Netherlands, New Zealand, Switzerland and the US. For completeness Table 2 shows the same analysis as Table 1, highlighting statistical significance, except that the “3 years later” columns have been replaced with the revisions to the very latest estimate, and the UK now has 2 rows in the table, the first using published GDP and the second using the GDP estimates adjusted to remove the CPI revision.
Table 2: Mean revision and statistical significance at different revision intervals for quarter on quarter (QoQ) and quarter on the same quarter a year ago (QoY) GDP growth rates, quarter 4 (October to December) 1998 to quarter 2 (April to June) 2015 (chained volume measure, percentage points)
| UK | ||||||||
| Country | 5 months later | 1 year later | 2 years later | To latest (Dec 2015) | ||||
| QoQ | QoY | QoQ | QoY | QoQ | QoY | QoQ | QoY | |
| Australia | *0.06 | 0.01 | *0.11 | 0.07 | **0.10 | **0.19 | **0.09 | 0.17 |
| Belgium | 0.01 | 0.04 | 0.03 | 0.05 | 0.01 | 0.03 | ***0.09 | **0.28 |
| Canada | 0.01 | 0.00 | 0.00 | 0.05 | ***0.04 | **0.17 | 0.05 | ***0.18 |
| Denmark | **0.11 | **0.15 | 0.04 | 0.10 | 0.01 | 0.03 | 0.09 | 0.13 |
| Finland | 0.03 | 0.09 | -0.03 | 0.14 | 0.02 | 0.16 | 0.02 | 0.14 |
| France | **-0.03 | -0.02 | -0.03 | 0.01 | -0.01 | ***0.17 | 0.03 | **0.22 |
| Germany | 0.03 | 0.03 | 0.04 | 0.05 | **0.07 | 0.08 | 0.07 | 0.16 |
| Italy | 0.00 | 0.00 | 0.00 | 0.00 | -0.01 | 0.03 | 0.03 | 0.11 |
| Japan | -0.05 | -0.06 | -0.05 | -0.10 | -0.08 | -0.01 | -0.04 | -0.10 |
| Korea | 0.03 | 0.02 | 0.04 | 0.05 | 0.10 | *0.23 | 0.10 | *0.39 |
| Netherlands | 0.04 | **0.09 | 0.03 | 0.09 | 0.04 | **0.21 | *0.14 | *0.51 |
| New Zealand | -0.03 | -0.05 | -0.02 | -0.03 | 0.00 | 0.16 | 0.09 | **0.46 |
| Norway | -0.03 | -0.01 | -0.07 | 0.02 | -0.04 | -0.05 | 0.01 | 0.16 |
| Portugal | 0.03 | 0.01 | 0.02 | 0.04 | 0.03 | **0.18 | 0.06 | **0.29 |
| Spain | 0.00 | 0.01 | 0.00 | 0.03 | 0.01 | 0.00 | 0.05 | 0.19 |
| Switzerland | 0.02 | 0.01 | 0.01 | 0.00 | 0.00 | 0.07 | 0.10 | **0.36 |
| UK | 0.02 | 0.04 | 0.01 | 0.06 | 0.03 | 0.17 | ***0.12 | **0.46 |
| UK excluding CPI | 0.02 | 0.03 | 0.00 | 0.04 | 0.02 | 0.13 | 0.08 | 0.32 |
| USA | 0.00 | -0.01 | -0.01 | -0.09 | **-0.10 | *-0.46 | **-0.09 | *-0.35 |
| Average less UK excluding CPI) | 0.01 | 0.02 | 0.01 | 0.03 | 0.01 | 0.07 | 0.05 | 0.21 |
| Source: OECD real time data and revisions database | ||||||||
| Notes: | ||||||||
| 1) Statistical significance levels 1%* 5%** 10%*** | ||||||||
Download this table Table 2: Mean revision and statistical significance at different revision intervals for quarter on quarter (QoQ) and quarter on the same quarter a year ago (QoY) GDP growth rates, quarter 4 (October to December) 1998 to quarter 2 (April to June) 2015 (chained volume measure, percentage points)
.xls (30.2 kB)Table 2 shows that most countries have larger revisions when expressed relative to the latest position and that for many countries these revisions are significant, especially for quarter on the same quarter of a year ago growth rates. So, while the comment that the long-term revisions for the UK are larger than our initial revisions is correct, the same can be said of most other countries and the UK revisions are only significant for quarter on quarter GDP growth at the 10% significance level. Importantly, after the RPI to CPI deflator improvement is removed, the UK’s mean revision for quarter on quarter GDP growth is no longer statistically significant, and the quarter on quarter a year ago revision in no longer significant at the 5% level but does remain significant at the 10% level.
Our analysis confirms the recent OECD report which stated that the UK was amongst the best performing nations when it came to the size of gross domestic product GDP revisions. The UK GDP revisions show no signs of statistically significant bias at 1 year, 2 years or 3 years after the initial estimates at the 10% significance level. The UK GDP revisions performance is not as good once the revisions period is extended to include longer-term structural revisions, such as the move to ESA 2010. However, once the UK’s unique deflator methodological improvement is removed the revisions again become much more in line.
Nôl i'r tabl cynnwys10. GDP revisions during the economic downturn and recovery – a country comparison
Measuring GDP during turning points in the economic cycle can be particularly problematic. It is easier to estimate GDP when the economy is growing to trend, but periods of declines in GDP and the initial quarter of any downturn are harder to measure. Additionally where annual GDP growths change signs between consecutive years it can be difficult to fit a quarterly path through the data and any subsequent revision to the annual level in either year can have an undue impact on the quarters (especially the first and last quarters of the year).
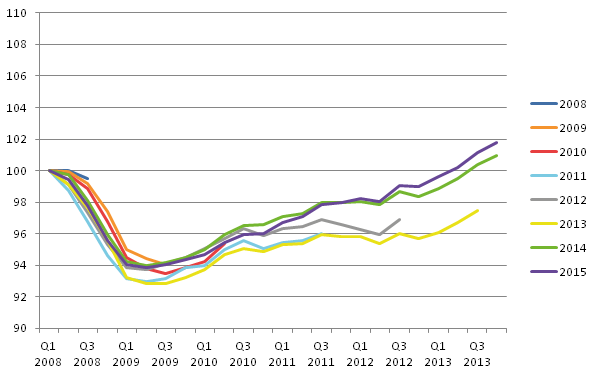
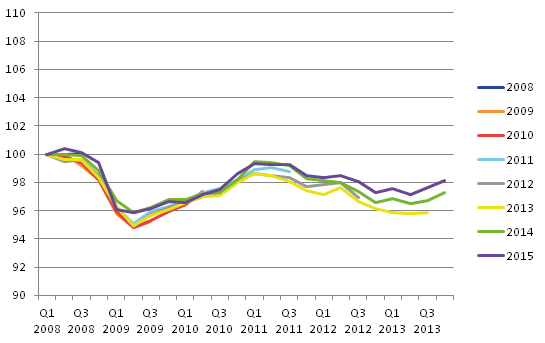
The UK GDP performance during the economic downturn and recovery has been covered in several of the previous revisions articles. Figure 9 shows the various vintages of the economic downturn of 2008 to 2009 and the subsequent recovery, with all vintages indexed so that the first quarter of 2008 equals 100.
Figure 9: Chained volume measure GDP at market prices Quarter 1 (Jan to Mar) 2008 to Quarter 4 (Oct to Dec) 2013 (Blue Book 2008 to 2015), UK
Source: Office for National Statistics
Download this image Figure 9: Chained volume measure GDP at market prices Quarter 1 (Jan to Mar) 2008 to Quarter 4 (Oct to Dec) 2013 (Blue Book 2008 to 2015), UK
.png (28.1 kB) .xls (34.8 kB)
The UK performance over this period was fairly typical of most countries in the study. The initial estimate of the UK GDP decline from peak to trough was -5.9%, and subsequent updates have revised this to be weaker, although the range has been broadly between -6.0% and -7.0%, and it now stands at -6.1%. As has previously been noted, the implementation of ESA 2010 and the completion of a number of ESA 95 gross national income reservations in 2014 led to a much improved growth picture in the period from 2011 to 2013. When the same analysis is applied to other countries the results are very interesting.
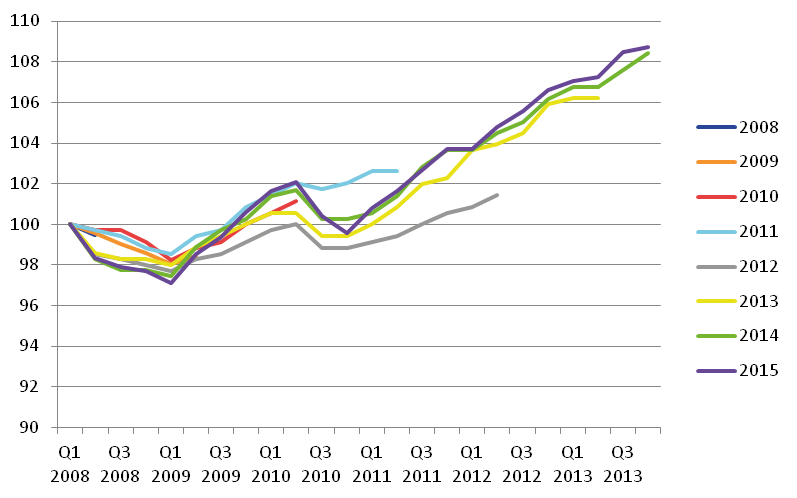
Some countries avoided the 2008 to 2009 economic downturn almost completely, such as Australia where there was just 1 quarter of negative growth in Quarter 4 (Oct to Dec) 2008. New Zealand had a much shallower downturn than the UK so although they experienced 4 consecutive quarters of declining GDP, the overall peak to trough fall across these 4 quarters has been estimated at -2.9%. This figure has itself been revised weaker through a number of vintages – initially the decline was estimated at -1.9% using the quarterly estimates, but subsequent annual revisions reduced the fall to -1.4% before the peak to trough then became more negative at -2.3%, -2.0%, -2.5% and then -2.9%. If some of the figures presented in this section look out of proportion it is because the scales have been made the same on all the figures to aid comparisons.
Figure 10: Chained volume measure GDP at market prices Quarter 1 (Jan to Mar) 2008 to Quarter 4 (Oct to Dec) 2013 (2008 to 2015 annual updates), New Zealand
Source: OECD real time data and revisions database
Download this image Figure 10: Chained volume measure GDP at market prices Quarter 1 (Jan to Mar) 2008 to Quarter 4 (Oct to Dec) 2013 (2008 to 2015 annual updates), New Zealand
.png (38.8 kB) .xls (34.8 kB)
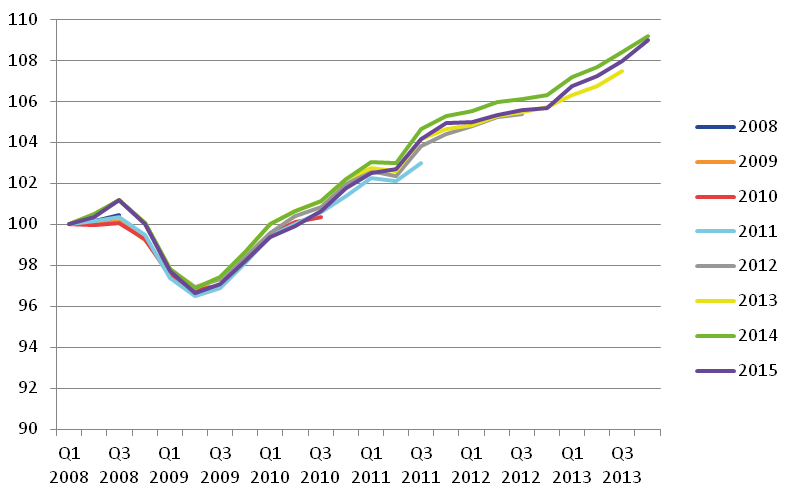
Canada is another example of the economic downturn becoming weaker through subsequent revisions. Initially their 4 quarter downturn was estimated as a fall of -3.3%. By 2011 this had been revised to -3.9% with a slightly stronger Quarter 3 (July to Sep) 2008 peak and a deeper trough. Then the implementation of the System of National Accounts 2008 (SNA 2008) in 2012 strengthened 2008 more than 2009, giving a fall of -4.2% mainly due to the upward revision in Quarter 3 (July to Sep) 2008. The economic downturn in Canada now stands at -4.5% after the 2015 vintage revised the 2009 trough to be slightly weaker than previously thought.
Figure 11: Chained volume measure GDP at market prices Quarter 1 (Jan to Mar) 2008 to Quarter 4 (Oct to Dec) 2013 (2008 to 2015 annual updates), Canada
Source: OECD real time data and revisions database
Download this image Figure 11: Chained volume measure GDP at market prices Quarter 1 (Jan to Mar) 2008 to Quarter 4 (Oct to Dec) 2013 (2008 to 2015 annual updates), Canada
.png (35.1 kB) .xls (35.3 kB)
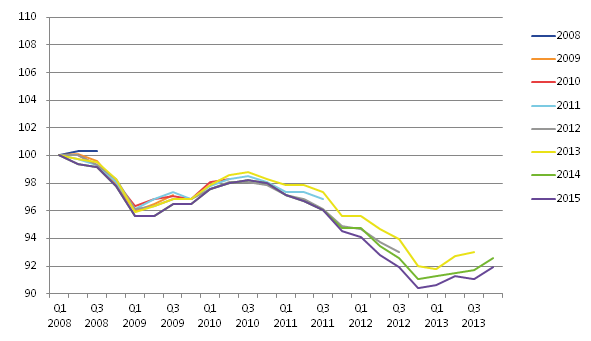
France also shows an interesting revisions profile with the 2008 first estimate of Quarter 3 (July to Sep) 2008 showing a slight increase, but this was soon revised to a fall. The same happened with the first estimate of Quarter 3 (July to Sep) 2009 growth. The 2012 and 2013 vintages of data moved the downturn deeper (from -3.5% first estimated to -4.4% by 2013) and longer (from 4 to 5 quarters in length of decline). The move to ESA 2010 in 2014 moved the peak to trough back to -4.0% with the trough being revised back up. The stronger growth out of the downturn can be seen in these figures as well with the ESA 2010 methodological changes likely to be leading to stronger growth than previously estimated in 2012 and 2013. Unfortunately the use of a consistent scale here doesn’t do justice to the French movements which are quite narrow in range.
Figure 12: Chained volume measure GDP at market prices Quarter 1 (Jan to Mar) 2008 to Quarter 4 (Oct to Dec) 2013 (2008 to 2015 annual updates), France

Source: OECD real time data and revisions database
Download this image Figure 12: Chained volume measure GDP at market prices Quarter 1 (Jan to Mar) 2008 to Quarter 4 (Oct to Dec) 2013 (2008 to 2015 annual updates), France
.png (18.8 kB) .xls (35.3 kB)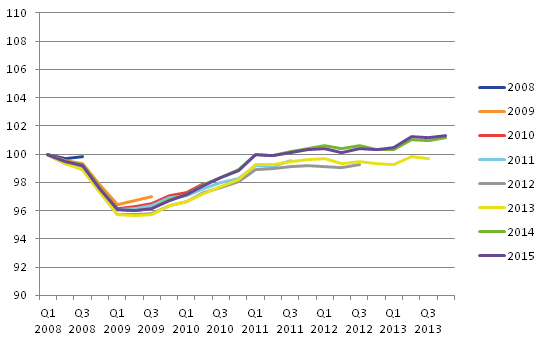
So France is typical of many European countries and indeed of the UK. The latest years have been revised on an annual basis to bring in new data, annual benchmarks and improved methodology. Each of these improvements have been included at the next opportunity which, for these recent periods, is at the annual update stage when annual data sources are included. The Netherlands has a more controlled delayed implementation of revisions, usually storing up major changes for a single large update each 5 to 7 years. But even in the Netherlands for these more recent periods we can see some significant revisions to the economic downturn and especially to the subsequent recovery with the revisions introduced in 2013, 2014 and 2015 being particularly noticeable in determining the level of GDP at the end of 2013. For the downturn though, the revisions seen in the Netherlands are fairly typical, with the initial estimate of the peak to trough of -5.2% being gradually revised upwards over the following iterations to -4.1%, with only 2015 weakening the picture slightly to -4.5%.
Figure 13: Chained volume measure GDP at market prices Quarter 1 (Jan to Mar) 2008 to Quarter 4 (Oct to Dec) 2013 (2008 to 2015 annual updates), The Netherlands
Source: OECD real time data and revisions database
Download this image Figure 13: Chained volume measure GDP at market prices Quarter 1 (Jan to Mar) 2008 to Quarter 4 (Oct to Dec) 2013 (2008 to 2015 annual updates), The Netherlands
.png (21.2 kB) .xls (35.3 kB)
The other main finding here is for the years following the economic downturn in countries where the recovery phase was less predictable. Italy, at almost every annual revision point, has made their peak to trough more negative, from the initial estimate of -6.5% to the latest estimate of -7.6%. This is probably one of the better revisions performances seen in this study, and this continues into the 2010 to 2013 period as well, confirming the OECD findings that Italy was in the group of countries with the lowest mean revisions on a quarter on quarter basis.
Figure 14: Chained volume measure GDP at market prices Quarter 1 (Jan to Mar) 2008 to Quarter 4 (Oct to Dec) 2013 (2008 to 2015 annual updates), Italy

Source: OECD real time data and revisions database
Download this image Figure 14: Chained volume measure GDP at market prices Quarter 1 (Jan to Mar) 2008 to Quarter 4 (Oct to Dec) 2013 (2008 to 2015 annual updates), Italy
.png (24.5 kB) .xls (35.3 kB)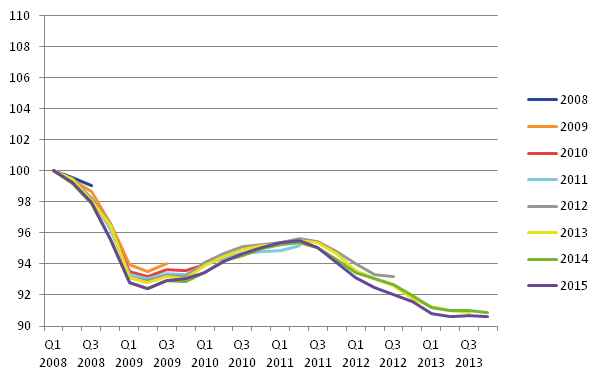
Spain has also shown very little revision in their peak to trough, with the initial estimate of -4.9% touching -5.0% before ending up at -4.6%. However, the revisions performance in more recent periods has been more varied, with each subsequent annual update for 2013, 2014 and 2015 weakening the position at the end of 2013. This picture has also been replicated in Portugal as well with slightly more volatile movements but the same direction of revisions.
Figure 15: Chained volume measure GDP at market prices Quarter 1 (Jan to Mar) 2008 to Quarter 4 (Oct to Dec) 2013 (2008 to 2015 annual updates), Spain

Source: OECD real time data and revisions database
Download this image Figure 15: Chained volume measure GDP at market prices Quarter 1 (Jan to Mar) 2008 to Quarter 4 (Oct to Dec) 2013 (2008 to 2015 annual updates), Spain
.png (19.7 kB) .xls (35.3 kB)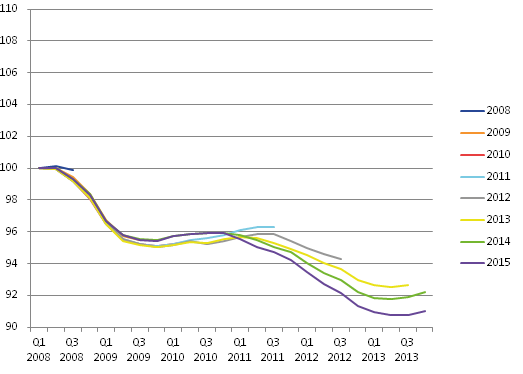
Figure 16: Chained volume measure GDP at market prices Quarter 1 (Jan to Mar) 2008 to Quarter 4 (Oct to Dec) 2013 (2008 to 2015 annual updates), Portugal
Source: OECD real time data and revisions database
Download this image Figure 16: Chained volume measure GDP at market prices Quarter 1 (Jan to Mar) 2008 to Quarter 4 (Oct to Dec) 2013 (2008 to 2015 annual updates), Portugal
.png (23.1 kB) .xls (35.3 kB)
In conclusion; the implementation of ESA 2010 and a period of addressing gross national income reservations in each year from 2012 to 2015 does seem to have had slightly more of an impact on the UK revisions performance during the economic downturn and recovery than for some other countries. All countries seem to have been impacted by the introduction of ESA 2010 (or SNA 2008 outside of Europe) but the resultant impact is not always to increase growth. Turning points in the economy have been shown to be difficult to measure in a number of countries and we are looking at way of improving the estimation of GDP at these points for the UK. This work will include investigating making more use of expenditure and income signals in the initial estimates and we plan to report back later in the year.
The next section focuses on some alternative ways of assessing GDP revisions performance using the analytical tools of previous UK GDP revisions articles, as well as some other techniques from the OECD.
Nôl i'r tabl cynnwys11. Alternative ways of assessing GDP revisions performance
The previous section focused on the revisions performance of countries during the economic downturn of 2008 to 2009 and the subsequent recovery. This section widens out the span of data used in the analyses to include the period of generally more stable growth prior to the downturn. The increased numbers of observations also make some of the revisions statistics more robust, and provide the opportunity to divide the time span into 2 groups of years to see if revisions performance has improved or worsened through time.
Changing signs
One of the tests the Organisation for Economic Co-operation and Development (OECD) applies to assess revisions performance is around predicting turning points. The OECD looks at the first published quarterly GDP growth rate and compares this with the latest estimate to see what percentage of first estimates have a different sign from the final estimates (for an early estimate to be useful it needs to provide quick signals of where the economy is heading). For the UK, over the last 127 quarterly estimates the sign of the initial estimates has ultimately been changed in 13 of these estimates, meaning that the sign of the initial estimate is correct just under 90% of the time. This is exactly in line with the average across all the countries studied by the OECD, which also found that on average 90% of initial estimates were of the correct sign.
Preliminary estimates
Many countries, like the UK, produce preliminary or “flash” estimates of GDP before providing a full suite of data in the quarterly national accounts estimates around 60 days later.
The UK revisions performance for each preliminary estimate to quarterly national accounts estimate has been published before. Table 3 repeats the distribution of revisions to the first estimate of GDP for the UK and reiterates that the average revision is 0.00 percentage points with the mean absolute average revision without regard for sign at 0.10 percentage points.
Table 3 – GDP revisions performance between preliminary estimate and first quarterly national accounts, quarter 1 (Jan to Mar) 2007 to quarter 3 (Jul to Sep) 2015, UK
Revision Count <=-0.5% 1 -0.4% 0 -0.3% 0 -0.2% 1 -0.1% 10 0.0% 12 +0.1% 7 +0.2% 2 >=+0.3% 2 Source: Office for National Statistics Download this table Table 3 – GDP revisions performance between preliminary estimate and first quarterly national accounts, quarter 1 (Jan to Mar) 2007 to quarter 3 (Jul to Sep) 2015, UK
.xls (26.1 kB)In the 35 periods observed for the UK, 29 periods had a revision within +/- 0.1 percentage points. The same analysis can be replicated for the other countries of the OECD study – although it should be noted that not all countries routinely revise between the preliminary estimate and the quarterly national accounts stage; for instance Germany makes clear in their revisions policy that the GDP numbers produced at the preliminary stage (45 days after the period in this case) and the more detailed results after 55 days are actually from the same single set of calculations spread over 2 publication days, and that any revision between the 2 estimates would be exceptional. Canada also only produces 1 estimate within the quarterly national accounts cycle, as do Norway and Spain. It is not clear what revisions policy the Republic of Korea operate, but it doesn’t seem to involve revisions between the early estimates, so these 5 countries have been excluded from this analysis.
Table 4: GDP revisions performance between preliminary estimate and first quarterly national accounts, quarter 1 (Jan to Mar) 2007 to quarter 3 (Jul to Sep) 2015, various countries
Revision Australia Belgium Denmark Finland France Italy Japan The Netherlands New Zealand Portugal Switzerland UK USA <=-0.5% 0 0 0 2 0 0 0 0 0 0 0 1 0 -0.4% 0 1 0 1 0 0 2 0 0 0 0 0 1 -0.3% 0 0 2 2 0 0 2 2 1 1 0 0 2 -0.2% 0 2 5 0 1 1 4 0 0 4 0 1 1 -0.1% 1 4 3 1 4 6 5 4 2 3 3 10 4 0.0% 31 19 7 24 24 19 9 9 31 20 30 12 14 +0.1% 2 6 8 2 5 8 2 10 0 3 1 7 8 +0.2% 0 1 1 1 0 0 5 6 0 0 0 2 1 >=+0.3% 0 1 8 1 0 0 5 3 0 3 0 2 3 Mean revision 0.00% 0.00% 0.07% -0.05% -0.01% 0.00% 0.00% 0.06% -0.01% 0.00% -0.01% 0.00% 0.00% Absolute mean revision 0.01% 0.08% 0.18% 0.10% 0.04% 0.05% 0.16% 0.12% 0.01% 0.08% 0.01% 0.10% 0.10% Source: OECD real time data and revisions database Download this table Table 4: GDP revisions performance between preliminary estimate and first quarterly national accounts, quarter 1 (Jan to Mar) 2007 to quarter 3 (Jul to Sep) 2015, various countries
.xls (28.7 kB)Table 4 shows that the UK preliminary GDP performance to the first set of quarterly national accounts revisions is comparable with the USA, Portugal and Belgium, with 0.00% mean revision and a small (0.1% or less) mean absolute revision. Australia, France, Italy, New Zealand and Switzerland have a smaller mean absolute revision, but this could be the consequence of not allowing revisions for some releases at all rather than having small revisions. Denmark, Finland and the Netherlands all show mean revisions which are at least +/-0.05 percentage points, and this can be one indication of potential bias in these countries’ early estimates. However, based on the detailed data, it would appear that Finland have had a couple of very large downward revisions which are unduly influencing their mean revision.
Mean revisions and mean absolute revisions
In the UK we are particularly interested in whether the economic downturn and recovery has led to a deterioration in revisions performance given that it can be harder to estimate GDP during less stable economic times. We have looked before at the relative performance of UK revisions, again in mean and mean absolute terms both pre and post downturn. Figure 17 shows the revision between the preliminary estimate and the estimate made 23 months later (T + 23).
Figure 17: Mean revisions and mean absolute revisions to chained volume measure GDP quarter on quarter between T and T + 23 months, UK
Source: Office for National Statistics
Download this chart Figure 17: Mean revisions and mean absolute revisions to chained volume measure GDP quarter on quarter between T and T + 23 months, UK
Image .csv .xlsSo while on the face of it, Figure 17 could be interpreted as an improvement in revisions performance since 2006 because of the 0.00% mean revision compared with +0.07% before the downturn, in actual fact the 0.00% figure masks the fact that there have been offsetting upward and downward revisions. It is the mean absolute revision which is the better indicator of the revisions performance, and this shows a slightly worse revisions performance for the UK, but this is to be expected. The same can be seen in Figure 18, which looks at the performance at T + 59 months (that is, 5 years after the initial estimate) rather than T + 23 months as in Figure 17.
Figure 18: Mean revisions and mean absolute revisions to chained volume measure GDP quarter on quarter between T and T + 59 months, UK
Source: Office for National Statistics
Download this chart Figure 18: Mean revisions and mean absolute revisions to chained volume measure GDP quarter on quarter between T and T + 59 months, UK
Image .csv .xlsOver the T + 59 month period the mean revisions are of a similar magnitude for both groups of years but in different directions and the mean absolute revisions in the later period are again slightly larger. Figures 19 and 20 show the same analysis for all the countries in the comparison.
Figure 19: Mean revisions to chained volume measure GDP quarter on quarter between T and T + 23 months, all countries
Source: OECD real time data and revisions database
Download this chart Figure 19: Mean revisions to chained volume measure GDP quarter on quarter between T and T + 23 months, all countries
Image .csv .xlsThere are a number of countries where the mean revisions in the period from Quarter 3 (July to Sep) 2006 onwards are better than in the earlier period. This is likely to be because of the economic downturn causing more negative revisions rather than a genuine improvement in revisions performance in most cases. Denmark, Finland, France, Italy, Portugal, Spain and Switzerland have all switched from positive to negative absolute revisions. Belgium appears to have the smallest revisions of any country if we are just looking at the mean revisions, but looking at mean absolute revisions helps us to understand the changes better.
Figure 20: Mean absolute revisions to chained volume measure GDP quarter on quarter between T and T + 23 months, all countries
Source: OECD real time data and revisions database
Download this chart Figure 20: Mean absolute revisions to chained volume measure GDP quarter on quarter between T and T + 23 months, all countries
Image .csv .xlsHere we can see that Belgium’s performance isn’t quite as good as the mean revisions suggested with a lot of positives and negatives cancelling out, but all contributing to the absolute revision, and it is Spain, Canada, France, Italy, Germany and the UK with the better revisions performance up to 2 years after first publication. In total 7 countries have a larger absolute mean revision in the economic downturn period than in the earlier period, but 11 have improved their performance. The T + 59 months will bring more of the longer-term methods changes into the analysis as seen in Figures 21 and 22.
Figure 21: Mean revisions to chained volume measure GDP quarter on quarter between T and T + 59 months, all countries
Source: OECD real time data and revisions database
Download this chart Figure 21: Mean revisions to chained volume measure GDP quarter on quarter between T and T + 59 months, all countries
Image .csv .xlsAt T + 59 months the UK shows the same positive mean revision for the earlier periods and negative in the later periods as many other countries. The biggest difference between the T + 23 months and the T + 59 months though has to be the much more negative figure for Norway in the later periods. This is heavily influenced by a number of significant downward revisions within Norway’s GDP figures – for instance Quarter 1 (Jan to Mar) 2008, which was first estimated as a 0.2% rise, ended up as a 1.8% fall 5 years later. There are several other periods showing movements of a similar magnitude. Interestingly there are almost as many large negatives in the earlier time span, but in these periods Norway also has a number of large upwards revisions which cancel out the negatives.
Figure 22: Mean absolute revisions to chained volume measure GDP quarter on quarter between T and T + 59 months, all countries
Source: OECD real time data and revisions database
Download this chart Figure 22: Mean absolute revisions to chained volume measure GDP quarter on quarter between T and T + 59 months, all countries
Image .csv .xlsUsing the mean absolute revisions we can see Norway’s revisions performance in the earlier period is almost as erratic as in the later period. Again the number of countries with smaller mean absolute revisions in the economic downturn period is surprisingly more than those with increasing mean absolute revisions. Compared with the T + 23 months analysis, mean absolute revisions are quite a bit larger for most countries, showing that revisions continue beyond the initial 2 years and indeed for many countries the revisions after 2 years make up a much larger proportion of the total revision that the revisions in the initial 23 months. This shows that benchmark annual revisions and methodological improvements can have a much larger impact on revisions than the initial "late data" revisions. It is fair to say that on both the T + 23 months and T + 59 months analyses the UK is on a par with many other major economies.
Mean squared errors and variances
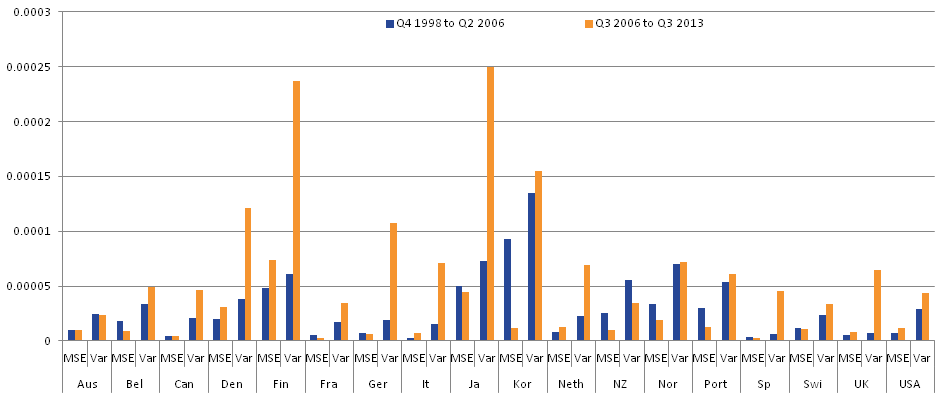
The variance in the GDP estimates can be shown alongside the mean squared revisions to indicate how the revision compares with the size of GDP movement. Again the UK variability and mean squared errors have been shown before and are repeated in Figure 23.
Figure 23: Comparison of the T to T + 23 mean squared revisions with the variance of the T + 23 maturity, quarter on quarter growth of chained volume measure GDP, UK
Source: Office for National Statistics
Download this chart Figure 23: Comparison of the T to T + 23 mean squared revisions with the variance of the T + 23 maturity, quarter on quarter growth of chained volume measure GDP, UK
Image .csv .xlsThis increased variability is reflecting the range of positive and negative growth rates seen as the UK entered and gradually exited from the economic downturn, showing that the economy was harder to measure accurately. Reassuringly the mean squared revision has remained relatively low. This indicates that the revisions performance even in these unusual times stands up favourably to comparison with historic revisions. So while the early estimates of GDP may not be as robust during periods of greater volatility or at turning points in the economy as they were during long periods of stable growth, it does seem increasingly likely that the methods used to estimate GDP have performed well under the circumstances.
Figure 24 includes the mean squared errors and variances for all countries in the study at T + 23 months.
Figure 24: Comparison of the T to T + 23 mean squared revisions with the variance of the T + 23 maturity, quarter on quarter growth of chained volume measure GDP, all countries
Source: OECD real time data and revisions database
Download this image Figure 24: Comparison of the T to T + 23 mean squared revisions with the variance of the T + 23 maturity, quarter on quarter growth of chained volume measure GDP, all countries
.png (10.3 kB) .xls (24.6 kB)In countries which didn’t really feel the economic downturn, such as Australia, the variance is more similar in both periods and the mean squared error remains steady as well. The larger variance in the economic downturn period is shown in many countries, especially Finland, Japan, Denmark, Korea and Germany. Most countries show very little movement in their mean squared errors though, meaning that most countries, including the UK, have not seen a deterioration in their revisions performance during the 2008 to 2009 economic downturn and the subsequent volatility during the economic recovery.
Revisions by calendar quarter
In the past it has been suggested that the UK tends to revise Quarter 1 (Jan to Mar) more than any other quarter, possibly because of the way quarterly paths are produced when benchmarking revisions change the annual position. We have looked at the revisions from preliminary estimate through to the latest publication for all periods from Quarter 4 (Oct to Dec) 1998 to Quarter 2 (Apr to Jun) 2015.
Table 5: GDP mean revisions performance between first estimate and latest estimates, quarter 1 (Jan to Mar) 2007 to quarter 3 (Jul to Sep) 2015 by quarter, various countries
UK Q1 Q2 Q3 Q4 Australia 0.0% 0.0% 0.2% 0.2% Belgium 0.1% 0.1% 0.0% 0.1% Canada -0.1% 0.0% 0.2% 0.1% Denmark 0.2% 0.1% 0.1% 0.1% Finland 0.2% 0.2% -0.3% 0.0% France 0.1% 0.0% 0.0% 0.0% Germany -0.1% 0.1% 0.0% 0.2% Italy 0.0% 0.0% -0.1% 0.1% Japan -0.4% 0.1% -0.1% 0.1% Korea -0.1% 0.2% 0.1% 0.2% Netherlands 0.2% 0.1% 0.2% 0.1% New Zealand 0.0% 0.2% 0.0% 0.2% Norway 0.4% -0.3% -0.1% 0.1% Portugal 0.3% -0.4% 0.3% 0.1% Spain 0.0% 0.0% 0.0% 0.1% Switzerland 0.0% 0.2% 0.1% 0.1% UK 0.2% 0.0% 0.0% 0.2% USA -0.3% 0.1% -0.3% 0.0% Source: OECD real time data and revisions database Download this table Table 5: GDP mean revisions performance between first estimate and latest estimates, quarter 1 (Jan to Mar) 2007 to quarter 3 (Jul to Sep) 2015 by quarter, various countries
.xls (20.0 kB)Norway has an average upward revision of 0.4% in Quarter 1 (Jan to Mar), and -0.3% in Quarter 2 (Apr to June) whereas Portugal has an upward revision of 0.3% in Quarter 1 (Jan to Mar) and -0.4% in Quarter 2 (apr to June). Japan and the USA have more quarters with large negative average revisions and in the UK Quarter 1 (Jan to Mar) and Quarter 4 (Apr to June) both have 0.2% upward revisions. As before the average revision doesn’t show the full picture and a small mean revision could be masking upward and downward offsetting revisions so Table 6 shows the mean absolute revisions by quarter for the same time periods.
Table 6: GDP mean absolute revisions performance between first estimate and latest estimates, quarter 1 (Jan to Mar) 2007 to quarter 3 (Jul to Sep) 2015 by quarter, various countries
UK Q1 Q2 Q3 Q4 Australia 0.3% 0.3% 0.4% 0.3% Belgium 0.4% 0.3% 0.2% 0.3% Canada 0.3% 0.2% 0.3% 0.2% Denmark 0.7% 0.9% 0.7% 0.6% Finland 0.9% 0.9% 0.4% 0.4% France 0.2% 0.2% 0.2% 0.2% Germany 0.5% 0.2% 0.2% 0.3% Italy 0.2% 0.2% 0.3% 0.3% Japan 0.7% 0.5% 0.5% 0.5% Korea 0.5% 0.5% 0.4% 0.6% Netherlands 0.5% 0.3% 0.3% 0.3% New Zealand 0.4% 0.6% 0.5% 0.6% Norway 0.8% 0.7% 0.5% 0.5% Portugal 0.4% 0.5% 0.4% 0.4% Spain 0.2% 0.2% 0.2% 0.2% Switzerland 0.4% 0.2% 0.3% 0.5% UK 0.3% 0.3% 0.3% 0.4% USA 0.4% 0.3% 0.3% 0.2% Source: OECD real time data and revisions database Download this table Table 6: GDP mean absolute revisions performance between first estimate and latest estimates, quarter 1 (Jan to Mar) 2007 to quarter 3 (Jul to Sep) 2015 by quarter, various countries
.xls (20.0 kB)For the UK this shows that all 4 quarters have similar magnitudes of average revision but in Quarters 2 (Apr to June) and 3 (July to Sep) in is more a mixture of upward and downward revisions that it is in Quarters 1 (Jan to Mar) and 4 (Apr to June). This does support the theory that annual revisions tend to impact more on the first and last quarter of the year, and the same pattern is seen in Switzerland. Finland and Norway seem to have larger revisions in Quarters 1 (Jan to Mar) and 2 (Apr to June) on average, and France and Spain both have an even revisions pattern between the quarters both in terms of the mean revision and the mean absolute revisions.
So, while there are slightly more revisions in the UK in the first and last quarters of the year on average, as a result of the methods used to compile the quarterly path, the differences between the quarters are no larger than for many other countries.
12. Conclusions
This article has confirmed the recent Organisation for Economic Co-operation and Development (OECD) report which stated that the UK was amongst the best performing nations when it came to the size of GDP revisions. This has been further supported by the finding that there is no statistically significant bias to the UK GDP revisions at 1 year, 2 years or 3 years after the initial estimates at the 10% significance level.
The UK GDP revisions performance is not as good once the revisions period is extended to include longer term structural revisions, such as the move to European System of Accounts 2010 (ESA 2010). However, once the UK’s unique and one-off deflator methodological improvement is removed the revisions again become much more in line.
The implementation of ESA 2010 and a period of addressing gross national income reservations in each year from 2012 to 2015 does seem to have had slightly more of an impact on the UK revisions performance during the economic downturn and recovery than for some other countries, but the UK revisions performance overall remains good.
Most countries, including the UK, have not seen a deterioration in their revisions performance during the 2008 to 2009 economic downturn and the subsequent volatility during the economic recovery.
There are slightly more revisions in the UK in the first and last quarters of the year on average, as a result of the methods used to compile the quarterly path, however, the differences between the quarters are no larger than for many other countries.
Nôl i'r tabl cynnwys13. Next steps
The main next steps are:
- presenting revisions – we are continuing to investigate ways of presenting revisions information as part of the quarterly round and annual publications
- methodology during a downturn – work continues to see if making more use of the expenditure and income approaches during the initial quarterly estimates could have prevented some of the revisions seen at the turning points of the economic downturn and subsequent recovery
- output revisions by industry - a study to look at the revisions to GDP caused by the output indicators on an industry basis
References
Revisions policy covering the National Accounts, including estimates of GDP
Revisions triangles including real time databases for expenditure and income components
Content of UK National Accounts: Blue Book 2016 (published on 27 November 2015), Richard
Various National Accounts articles, including ‘National Accounts: A short guide’
Understanding the quality of early estimates of GDP (published December 2009)
'Why is GDP revised?’, (published on 13 June 2013)Walton 2013
Revisions to GDP and components, (published on 28 January 2014) Walton 2014
National Statistics Quality Review: Review of National Accounts and Balance of Payments
Independent review of UK economic statistic: interim report Dec 2015
decade of improvements to economic statistics, (published May 2000) Jenkins and Brand 2000
OECD Revisions of quarterly GDP in Selected OECD countries, July 2015
Index of Construction revisions triangles (from 14 February 2014)
21.Revisions policies by country
Nôl i'r tabl cynnwys