Cynnwys
- Main points
- Overview
- Your views matter
- SET expenditure 2013
- SET expenditure by sectors of the UK Government
- Research Councils' expenditure on SET in current prices increased by 11% in 2013
- Civil departments' expenditure on SET in current prices increased by 15% in 2013
- Higher Education Funding Councils' (HEFCs) expenditure on SET in current prices increased by 5% in 2013
- Ministry of Defence (MoD) expenditure on R&D in 2013 decreased by 58% in constant prices from 2002
- Indicative UK contributions to EU R&D expenditure
- Background notes
1. Main points
In 2013, £10.9 billion was spent on Science, Engineering and Technology (SET) by the UK Government, an increase of 9% in current prices compared with 2012. Allowing for inflation (in constant prices), this was a 7% increase compared with 2012, and reversed the downward trend in SET expenditure since 2009
The UK Research Councils contributed the most to expenditure on SET in 2013 at £3.6 billion, 33% of all expenditure on SET
Between 2002 and 2013, defence expenditure on SET decreased by £2.1 billion in constant prices to £1.5 billion. Over the same period there was an increase in Research Councils' expenditure on SET of £1.0 billion
The 2013 SET estimate of £10.9 billion consists of expenditure on Research and Development (R&D) of £9.8 billion, indicative UK contributions to European Union (EU) R&D expenditure of £0.8 billion, and the amount spent on knowledge transfer of £0.3 billion
2. Overview
Science, Engineering and Technology (SET) expenditure by the UK Government covers expenditure by government departments, Research Councils and Higher Education Funding Councils (HEFCs). It also includes indicative UK contributions to the European Union’s (EU) research and development (R&D) expenditure. This should not be confused with the UK Gross Domestic Expenditure on R&D, 2013 (GERD) statistical bulletin, which only includes expenditure on R&D performed within UK borders, but by all sectors of the economy.
GERD only comprises estimates of expenditure on performing in-house R&D by each sector of the UK economy. However, whilst SET includes expenditure on performing in-house R&D, its largest component is expenditure on externally purchased/funding provided for R&D, along with EU budget contributions and knowledge transfer. This is explained in more detail in Background Note 1, which includes graphical representation of the comparable values of GERD and SET. R&D (in-house and purchased/funded) is the main component of the SET statistics.
SET statistics used to be published by the Department for Business, Innovation and Skills (BIS). We took over publishing the statistics for the first time in July 2014 in a new statistical bulletin. BIS included the year of publication in the SET Statistics title, not the year the estimates related to. The title of this SET statistical bulletin includes the reference period, which is 2013.
For the purpose of SET statistics (Tables 1 and 2), UK government expenditure on SET consists of:
expenditure on in-house R&D, purchased R&D and other funding provided to external organisations for R&D (Tables 3 and 4)
indicative UK contributions to the EU's R&D expenditure (Tables 1 to 4)
knowledge transfer activities (including technology transfers) which are associated with research and experimental development, and contribute to the dissemination and application of scientific and technical knowledge. Knowledge transfer estimates which are included in the SET totals in Tables 1 and 2 are separately identified in Tables 5 and 6
Estimates of R&D are on a net expenditure basis and therefore are net of funding received.
This definition of SET excludes all other scientific, technical, commercial and financial steps that are often necessary for the successful development and marketing of new or improved products, processes or services.
Two types of estimates are presented in this release, current and constant prices. Estimates in current prices present the value of expenditure in cash terms. Constant price estimates have been adjusted for inflation between years using the Gross Domestic Product (GDP) deflator. This allows changes in the volume of government expenditure on SET to be examined on a more comparable basis over time.
This release also includes data tables sourced from our Labour Force Survey, referring to personnel associated with scientific and technical postgraduate education and training. These provide estimates of the number of persons with higher education qualifications, their employment status and their type of occupation.
In this statistical bulletin, R&D and related concepts follow internationally agreed standards defined by the Organisation for Economic Cooperation and Development (OECD), as published in the ‘Frascati Manual’ . This manual defines R&D as “creative work undertaken on a systematic basis in order to increase the stock of knowledge, including knowledge of man, culture and society and the use of this stock of knowledge to devise new applications”.
The Frascati Manual was originally written by, and for, the experts in OECD member countries that collect and issue national estimates of R&D. The definitions provided in this manual are internationally accepted and serve as a common language for designing and evaluating science and technology policy.
Estimates in this release have the status of Official Statistics as they have not been assessed by the UK Statistics Authority (see Background Note 2).
The estimates in this bulletin and associated data tables relate to financial years. The main source of estimates for this publication is the annual Government Research and Development survey (GovERD).
Nôl i'r tabl cynnwys3. Your views matter
We are aiming to improve this release and its associated commentary. We would welcome any feedback you might have, and would be particularly interested in knowing how you make use of these estimates to inform your work. Please contact us via email: RandD@ons.gov.uk or telephone Cecil Prescott on +44 (0)1633 456767.
To gauge user opinion we are carrying out an online survey, in order to gather feedback which will enable us to continue to improve this publication
Nôl i'r tabl cynnwys4. SET expenditure 2013
In 2013, £10.9 billion was spent on SET by the UK Government, an increase of 9% in current prices compared with 2012. In constant prices, SET expenditure increased by 7% compared with 2012, the first annual increase since 2009. However, SET expenditure was still 5% below the £11.5 billion seen in 2002. The decrease in SET expenditure in constant prices from 2009 to 2012 was the result of decreases in expenditure by the HEFCs, Research Councils and the Ministry of Defence (Figures 1 and 4).
Figure 1: UK Government expenditure on SET, 2002 to 2013
Source: Office for National Statistics
Download this chart Figure 1: UK Government expenditure on SET, 2002 to 2013
Image .csv .xlsFigure 2 shows UK government expenditure on SET as a percentage of GDP. Total expenditure on SET in 2013 represented 0.63% of GDP. This estimate has seen a downward trend in recent years but is broadly unchanged from 2011.
Figure 2: UK Government expenditure on SET as a percentage of GDP, 2002 to 2013
Source: Office for National Statistics
Download this chart Figure 2: UK Government expenditure on SET as a percentage of GDP, 2002 to 2013
Image .csv .xls5. SET expenditure by sectors of the UK Government
The UK government’s expenditure on SET can be categorised into expenditure by Research Councils, HEFCs, and also into civil and defence departments, all of which include elements of knowledge transfer. The indicative UK contributions to EU R&D expenditure provided by HM Treasury are also included in SET expenditure. Figure 3 shows the contribution each of these made to the 2013 total SET estimate. Almost a third (33%) of UK government expenditure on SET was by Research Councils, with civil departments and HEFCs contributing 25% and 21% respectively. The remaining 21% of the total SET estimate consisted of the Ministry of Defence (MoD) (14%) and contributions to EU R&D expenditure (7%).
Figure 3: The components of UK Government expenditure on SET, 2013
Office for National Statistics
Download this chart Figure 3: The components of UK Government expenditure on SET, 2013
Image .csv .xlsFigure 4 shows changes in SET components between 2002 and 2013 in constant prices. Defence expenditure decreased by £2.1 billion (58%), from £3.6 billion in 2002 to £1.5 billion in 2013. Over the same period there was an increase in Research Councils' expenditure on SET of £1.0 billion.
The defence estimate of £3.6 billion for 2002 was during a time of change for the MoD, with changing internal structures, and the introduction of new accounting systems, as well as a review to ensure that Frascati Manual definitions were being adhered to. Caution is therefore advised when using the SET defence estimate for this period, as it is likely to be overestimated. Please see Background Note 10 for more information on defence statistics.
The UK indicative contributions to EU R&D expenditure increased by 55% between 2007 and 2008 in constant prices. This rise related to member states’ contributions being increased to meet the needs of the growing number of EU member states. They have remained around the same level since then.
Figure 4: The components of UK Government expenditure on SET in constant prices, 2002 to 2013
Source: Office for National Statistics
Download this chart Figure 4: The components of UK Government expenditure on SET in constant prices, 2002 to 2013
Image .csv .xls6. Research Councils' expenditure on SET in current prices increased by 11% in 2013
Research Councils UK (RCUK) is the strategic partnership of the UK's 7 Research Councils. Each year the Research Councils perform research covering the full spectrum of academic disciplines, from the medical and biological sciences to astronomy, physics, chemistry, engineering, social sciences, economics, environmental sciences and the arts and humanities.
In 2013, expenditure on SET by Research Councils was £3.6 billion, an increase of £0.4 billion (11%) in current prices compared with 2012. Allowing for inflation (in constant prices), this was an increase of £0.3 billion (9%) compared with 2012.
The Research Council with the highest expenditure on SET at £1.0 billion in 2013 was the Engineering and Physical Sciences Research Council (EPSRC). This represented 28% of all Research Councils' expenditure on SET.
The Research Councils’ estimated expenditure on SET includes their pension arrangements. These pension contributions are included separately on the data tables associated with this publication (Figure 5).
Figure 5: Breakdown of UK Research Councils’ expenditure on SET, 2013
£3.6 billion
Source: Office for National Statistics
Notes:
- EPSRC = Engineering and Physical Sciences Research Council; MRC = Medical Research Council; BBSRC = Biotechnology and Biological Sciences Research Council; STFC = Science and Technology Facilities Council; NERC = Natural Environment Research Council; ESRC = Economic and Social Research Council; AHRC = Arts and Humanities Research Council
Download this chart Figure 5: Breakdown of UK Research Councils’ expenditure on SET, 2013
Image .csv .xls7. Civil departments' expenditure on SET in current prices increased by 15% in 2013
The UK Government owns many research institutes and laboratories that carry out R&D, which is the largest component of SET. It also uses a range of different suppliers with facilities to carry out research, both inside and outside the UK.
In 2013, expenditure by civil departments on SET was £2.7 billion, an increase of £0.4 billion (15%) in current prices compared with 2012. Five departments contributed £2.6 billion (93%) to the 2013 total. The civil department with the largest expenditure on SET was the Department for Business, Innovation and Skills (BIS) (£1.0 billion) which represented 37% of total civil departments’ expenditure on SET (Figure 6).
Figure 6: Breakdown of UK Government civil departments’ expenditure on SET, 2013
£2.7 billion
Source: Office for National Statistics
Download this chart Figure 6: Breakdown of UK Government civil departments’ expenditure on SET, 2013
Image .csv .xls8. Higher Education Funding Councils' (HEFCs) expenditure on SET in current prices increased by 5% in 2013
HEFCs promote and fund teaching and research in Higher Education Institutions (HEIs).
All HEIs (including universities) provide finance statistics to the Higher Education Statistics Agency (HESA). To estimate government funded R&D expenditure in HEIs, grant income is used as a proxy for expenditure. Please see Background Note 4 for more information.
In 2013, expenditure on SET by HEFCs was £2.3 billion, an increase of £0.1 billion (5%) in current prices compared with 2012. Allowing for inflation (in constant prices) this was an increase of £0.07 billion (3%) compared with 2012 and an increase of £0.2 billion (10%) since 2002. This was in contrast to the decrease from the peak of £2.6 billion in 2009 (Figure 4).
The funding council for England (HEFCE) provides the most research funding as it has the highest number of HEIs. In 2013, expenditure by HEFCE on SET was £1.8 billion. This was 77% of the total HEFCs' expenditure on SET, a similar level to recent years (Figure 7).
Figure 7: Higher Education Funding Councils' (HEFCs) expenditure on SET, 2002 to 2013

Source: Office for National Statistics
Notes:
- The map refers to 2013 estimates.
Download this image Figure 7: Higher Education Funding Councils' (HEFCs) expenditure on SET, 2002 to 2013
.png (67.4 kB) .xls (31.2 kB)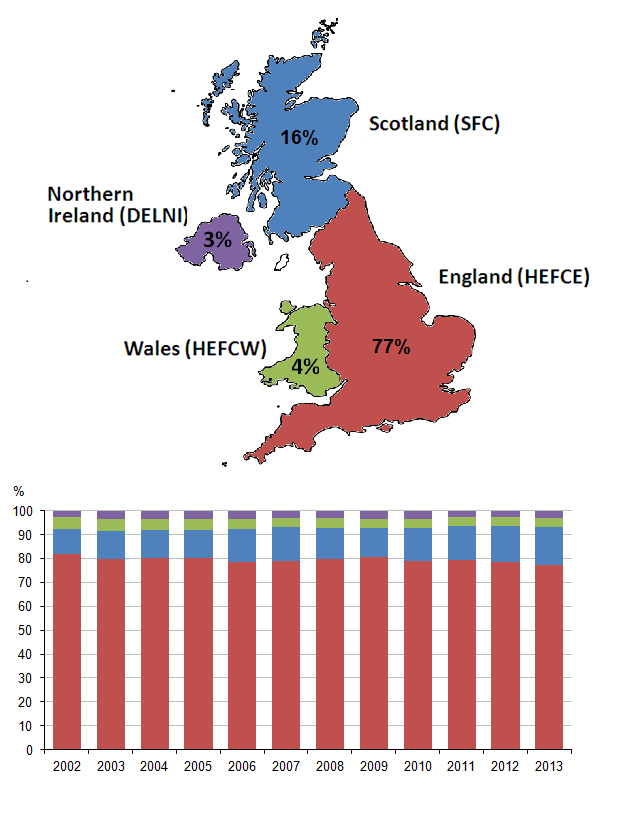
9. Ministry of Defence (MoD) expenditure on R&D in 2013 decreased by 58% in constant prices from 2002
In 2013, expenditure on SET by the MoD was £1.5 billion, an increase of £0.1 billion (4%) in current prices compared with 2012. Allowing for inflation (in constant prices) this was an increase of £0.03 billion (2%) compared with 2012, but a decrease of £2.1 billion (58%) since 2002. This was mainly due to a decrease in development expenditure of £2.0 billion, with some large projects moving from the development phase into the manufacturing stage of their programmes, and not being replaced with other high value projects (Figure 8).
Figure 8: Defence expenditure on SET by research and development, in constant prices, 2002 to 2013
Source: Office for National Statistics
Download this chart Figure 8: Defence expenditure on SET by research and development, in constant prices, 2002 to 2013
Image .csv .xls10. Indicative UK contributions to EU R&D expenditure
In 2013, the indicative contributions that the UK made to EU R&D expenditure totalled £0.8 billion. This is an increase in constant prices of £0.2 billion (32%) since 2002. These figures were provided by HM Treasury and are broad estimates. This is because Member States’ contributions are not made to individual expenditure programmes, but to the EU budget as a whole. They are therefore referred to as the “indicative UK contributions to EU R&D expenditure”.
Nôl i'r tabl cynnwys