Cynnwys
- Main points
- Statistician’s comment
- Things you need to know about this release
- Science, engineering and technology expenditure 2015
- Research Councils account for almost a third of spending on science, engineering and technology
- Decrease in Research Councils' expenditure on science, engineering and technology
- Civil departments' expenditure on science, engineering and technology increases
- Decrease in Higher Education Funding Councils' expenditure on science, engineering and technology
- Defence expenditure on research and development decreases
- UK more than doubles contribution to EU research and development expenditure
- Links to related statistics
- Quality and methodology
1. Main points
The UK government’s expenditure on science, engineering and technology (SET) continued to grow, expanding by £0.2 billion to £11.4 billion in 2015, an increase of 1.4%.
The 2015 SET estimate of £11.4 billion consists of expenditure on research and development (R&D) of £10.2 billion, UK contributions to EU R&D expenditure of £0.9 billion and knowledge transfer of £0.3 billion.
The UK Research Councils contributed the most to expenditure on SET in 2015 at £3.4 billion, 30% of all expenditure on SET.
Civil departments’ expenditure on SET over the long term grew by 27% from £2.5 billion in 2004 in constant prices (adjusted to remove the effects of inflation) to £3.1 billion in 2015.
Defence expenditure on SET over the same period decreased by 39% to £1.7 billion in 2015.
2. Statistician’s comment
“Government spending on science, engineering and technology has been growing over time, in real terms. However, it has been falling as a share of GDP – down from over 0.8% in 2004 to 0.6% in 2015.”
Daniel Groves, National Accounts and Economic Statistics, Office for National Statistics
Nôl i'r tabl cynnwys3. Things you need to know about this release
UK government expenditure on science, engineering and technology (SET) covers estimates of expenditure by government departments, Research Councils and Higher Education Funding Councils (HEFCs). The estimates are on a net expenditure basis. This is defined as in-house research and development (R&D) performed plus purchased or funding provided for R&D, less funding received for R&D. Also included are estimates of knowledge transfer and the UK’s contribution to the EU’s R&D budget.
SET should not be confused with the UK gross domestic expenditure on research and development: 2015 (GERD) statistical bulletin, published on 16 March 2017, which only includes expenditure on R&D performed “in-house”, that is, by organisations themselves, by all sectors of the economy. This is explained in more detail in the UK gross domestic expenditure on research and development Quality and Methodology Information.
In this statistical bulletin, R&D and related concepts follow internationally agreed standards defined by the Organisation for Economic Co-operation and Development (OECD), as published in the Frascati Manual 2015.
The main source of estimates for this publication is the annual Government Research and Development Survey (GovERD).
Please note that £1.0 billion equals £1,000 million in this release and that all figures quoted are in current prices unless otherwise stated.
Nôl i'r tabl cynnwys4. Science, engineering and technology expenditure 2015
Expenditure on science, engineering and technology (SET) by the UK government was £11.4 billion in 2015. This was up from £11.2 billion in 2014, an increase of 1.4%. The average annual growth rate since 2004 was 2.5%.
In constant prices, the 2015 estimate increased by 0.6% since 2014 and the average annual growth rate since 2004 was 0.5%.
Total expenditure on SET represented 0.60% of gross domestic product (GDP), a decrease from 0.62% in 2014. As a percentage of GDP, the level has fluctuated between 0.60% and 0.82%, with an average estimate of 0.70% for the period 2004 to 2015.
Nôl i'r tabl cynnwys5. Research Councils account for almost a third of spending on science, engineering and technology
UK government’s estimates of science, engineering and technology (SET) are categorised into expenditure by Research Councils, Higher Education Funding Councils (HEFCs) and by civil and defence departments, all of which include elements of knowledge transfer. Also included are estimates of the UK’s contribution to the EU’s R&D expenditure made by HM Treasury.
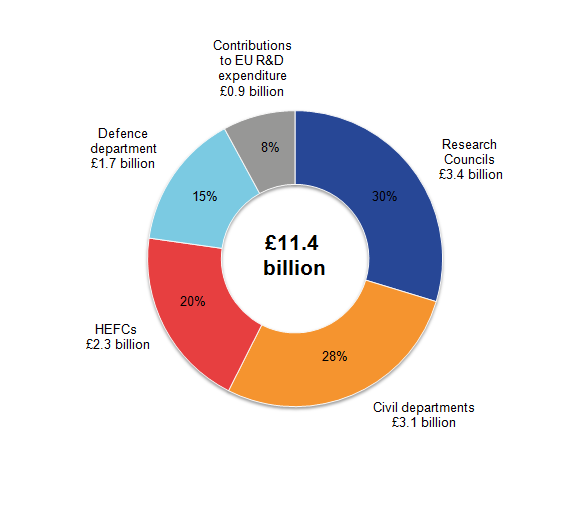
Figure 1 shows the contribution each sector made to the SET estimate in 2015. Almost one-third (30%) of UK government expenditure on SET was by Research Councils, with civil departments and HEFCs contributing 28% and 20% respectively. Defence expenditure and contributions to EU R&D expenditure made up the remaining 15% and 8% respectively.
Figure 1: Composition of UK government expenditure on science, engineering and technology, 2015
Source: Office for National Statistics
Notes:
- Percentages sum to 101 due to rounding.
- HEFCs - Higher Education Funding Councils.
Download this image Figure 1: Composition of UK government expenditure on science, engineering and technology, 2015
.png (25.6 kB) .xls (27.1 kB)
Figure 2 shows changes in SET components between 2004 and 2015 in constant prices. Defence expenditure decreased by £1.0 billion (39%) from £2.7 billion in 2004 to £1.7 billion in 2015. In contrast, over the same period there was growth in civil departments’ expenditure on SET of £0.7 billion.
Figure 2: Components of UK government expenditure on science, engineering and technology in constant prices, 2004 to 2015
Source: Office for National Statistics
Notes:
- HEFCs – Higher Education Funding Councils.
Download this chart Figure 2: Components of UK government expenditure on science, engineering and technology in constant prices, 2004 to 2015
Image .csv .xls6. Decrease in Research Councils' expenditure on science, engineering and technology
Research Councils UK (RCUK) is the strategic partnership of the UK's seven Research Councils. Each year the Research Councils perform research and development (R&D) covering the full spectrum of academic disciplines, from the medical and biological sciences to astronomy, physics, chemistry, engineering, social sciences, economics, environmental sciences, and the arts and humanities.
Expenditure on science, engineering and technology (SET) by Research Councils was £3.4 billion in 2015. This was down £24.7 million (1%) since 2014. In constant prices, this was a rise of £0.4 billion (15%) since 2004.
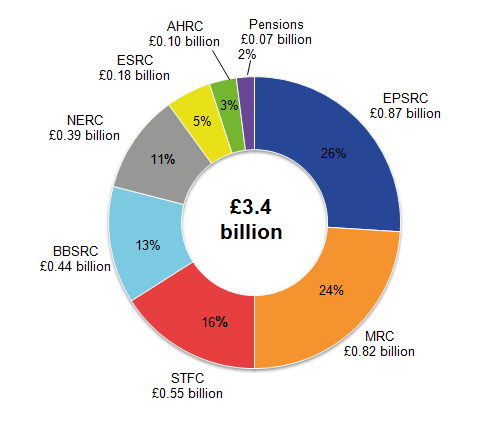
The research council with the highest expenditure on SET (£0.9 billion in 2015) continued to be the Engineering and Physical Sciences Research Council (EPSRC), representing 26% of Research Councils' SET expenditure. However, while the EPSRC saw a drop of 4%, the Medical Research Council’s expenditure grew by 14% from £0.7 billion in 2014 to £0.8 billion in 2015, representing 24% of all Research Councils’ expenditure on SET. The Medical Research Council also had the highest growth since 2004, in constant prices, with a growth of 74%.
The Research Councils’ estimated expenditure on SET includes their pension arrangements. These pension contributions are included separately in the datasets associated with this publication and in Figure 3.
Figure 3: Breakdown of UK Research Councils’ expenditure on science, engineering and technology, 2015
Source: Office for National Statistics
Notes:
- EPSRC – Engineering and Physical Sciences Research Council
- MRC – Medical Research Council
- BBSRC – Biotechnology and Biological Sciences Research Council
- STFC – Science and Technology Facilities Council
- NERC – Natural Environment Research Council
- ESRC – Economic and Social Research Council
- AHRC – Arts and Humanities Research Council
Download this image Figure 3: Breakdown of UK Research Councils’ expenditure on science, engineering and technology, 2015
.png (26.5 kB) .xls (27.1 kB)
7. Civil departments' expenditure on science, engineering and technology increases
The UK government owns many research institutes and laboratories that carry out research and development (R&D), which are managed by various government departments. It also uses a range of suppliers with facilities to carry out research, both inside and outside the UK.
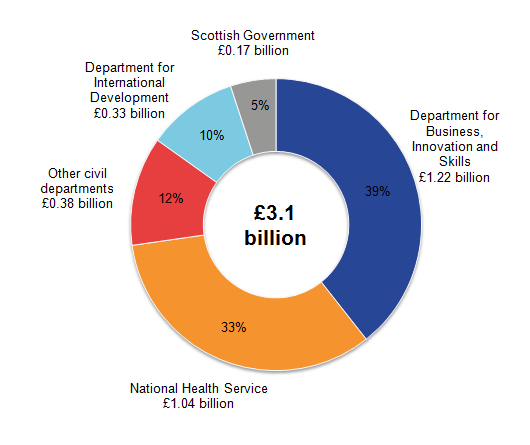
In 2015, expenditure by civil departments on science, engineering and technology (SET) was £3.1 billion, showing growth of £86.8 million (3%) since 2014. In constant prices, the growth since 2004 was 27%. In 2015, four departments contributed £2.8 billion (88%) to the total. The Department for Business, Innovation and Skills (BIS) was the largest contributor to this, with expenditure of £1.2 billion, making up 39% of total civil departments’ expenditure on SET (Figure 4). The Department for Business, Innovation and Skills was replaced by the Department for Business, Energy and Industrial Strategy in July 2016.
Figure 4: Breakdown of UK government civil departments’ expenditure on science, engineering and technology, 2015
Source: Office for National Statistics
Notes:
- Percentages sum to 99 due to rounding.
Download this image Figure 4: Breakdown of UK government civil departments’ expenditure on science, engineering and technology, 2015
.png (26.3 kB) .xls (27.1 kB)
8. Decrease in Higher Education Funding Councils' expenditure on science, engineering and technology
Higher Education Funding Councils (HEFCs) promote and fund teaching and research in higher education institutions (HEIs).
All HEIs (including universities) provide finance statistics to the Higher Education Statistics Agency (HESA). Grant income provided by HEFCs is used as a proxy to estimate government-funded research and development (R&D) expenditure in HEIs. This is explained in more detail in the UK gross domestic expenditure on research and development Quality and Methodology Information.
In 2015, expenditure on science, engineering and technology (SET) by HEFCs was £2.3 billion, a decrease of £88.0 million (4%) since 2014. In constant prices, this was a decrease of £105.4 million (4%) since 2014 and an increase of £28.7 million (1%) since 2004. This was in contrast to the decrease from the peak of £2.6 billion in 2009 (Figure 2).
The Higher Education Funding Council for England (HEFCE) provides the most research funding as it has the highest number of HEIs. In 2015, expenditure by HEFCE on SET was £1.8 billion. This was 80% of the total HEFCs' expenditure on SET, a similar level to recent years.
Nôl i'r tabl cynnwys9. Defence expenditure on research and development decreases
Defence expenditure on science, engineering and technology (SET) was £1.7 billion in 2015, a drop of £41.8 million (2%) since 2014. In constant prices, since 2004, defence expenditure has decreased by £1.0 billion (39%) (Figure 2). While defence research fell by 23% over this period, to £0.6 billion, defence experimental development fell by 45% to £1.1 billion.
Nôl i'r tabl cynnwys10. UK more than doubles contribution to EU research and development expenditure
In 2015, the UK contributed £0.9 billion to EU research and development (R&D) expenditure. In constant prices, this was an increase of £0.5 billion (127%) more than doubling the figure in 2004. These figures were provided by HM Treasury and are broad estimates. This is because member states’ contributions are not made to individual expenditure programmes, but to the EU budget as a whole. They are therefore referred to as “indicative UK contributions to EU R&D expenditure.”
Nôl i'r tabl cynnwys12. Quality and methodology
The UK government expenditure on science, engineering and technology Quality and Methodology Information document contains important information on:
- the strengths and limitations of the data and how they compare with related data
- users and uses of the data
- how the output was created
- the quality of the output including the accuracy of the data
About the data
The following points should be noted when examining this bulletin or the data tables:
- note that £1.0 billion equals £1,000 million in this release
- the majority of the data series started in 2001 and constant price comparisons have been made using the start of the current dataset in 2004
- the 2013 and 2014 estimates have been revised where necessary to take account of misreporting and late returns
- estimates of launch investment loan repayments received by government from business are no longer included following a review of how these payments should be reported
- gross domestic product (GDP) deflators at market prices and money GDP used is non-seasonally adjusted; the GDP deflators at market prices, and money GDP: December 2016 (Quarterly National Accounts) can be viewed as a measure of general inflation in the domestic economy