Cynnwys
- Main points
- Collaboration
- Things you need to know about this release
- Food, water, energy and materials – provisioning services
- Air filtration and carbon sequestration – regulating services
- Recreation – cultural services
- Asset valuation – what is the value of natural capital in the UK?
- Quality and Methodology
1. Main points
This bulletin presents 10 service accounts, containing estimates of the quantity and value of services being supplied by UK natural capital. These services include food, water, air filtration and recreation.
- The partial asset value of UK natural capital was estimated to be £761 billion in 2015.
- 58% of this value was attributable to cultural and regulating services (recreation, pollution removal and carbon sequestration).
- In 2015, 9 times as much energy was produced from renewable sources than was produced in 1997
- UK mineral production has generally declined since the time series began, however UK timber production has increased by almost 50%.
2. Collaboration
This publication is produced in partnership with the Department for Environment, Food and Rural Affairs (Defra). For full details about the natural capital accounting project please refer to our website.
The recently published 25 Year Environment Plan restated the government’s commitment to working with the ONS to develop a full set of natural capital accounts for the UK that are widely understood. Such accounts for the UK will help support the monitoring of progress under the plan as well as providing evidence and statistics to inform better decision making as envisaged in the plan.

3. Things you need to know about this release
Natural capital refers to the physical natural resources and the benefits that these resources provide through ecosystem services. Ecosystems provide many services which contribute to human well-being, such as food, water, air filtration and recreation. This bulletin uses the term ecosystem service throughout which generally refers to living (biotic) components of the Earth which provide services to humanity. However, non-living (abiotic) components, such as oil and gas used for energy, are also included in this release.
This bulletin presents 10 service accounts, containing estimates of the quantity and value of services being supplied by UK natural capital. A summary of the key trends is presented in this bulletin, but the full time series can be found in the datasets that accompany this release. Where available, estimates are presented between the period 1997 to 2015 and all monetary valuations are given in 2015 prices deflated using the September 2017 GDP deflator.
The services are presented by type, which include provisioning, regulatory and cultural. Types of service are defined at the beginning of each section.
All methods are experimental and are subject to adjustment and improvement as the UK natural capital accounts are developed. The monetary accounts should be interpreted as a partial or minimum value of UK natural capital, as a number of ecosystem services are not currently measured, such as regulating water flows (flood protection). The forthcoming UK Natural Capital Roadmap 2020 will explain the priorities for the development of the Natural Capital accounting project, including addressing current data gaps.
These accounts are produced alongside the habitat accounts for farmland, freshwater and woodland, published in July 2017. As well as non-monetary and monetary service flow estimates, the habitat based accounts also include information about size (extent) and quality (condition) of particular natural assets.
Nôl i'r tabl cynnwys4. Food, water, energy and materials – provisioning services
Nature in the UK provides food, water and materials for society; these are known as provisioning services. Table 1 presents the services captured and not captured in the account at present.
Table 1: Provisioning services - products such as food, water, fibre and fuel
| Included | Not included | |||
|---|---|---|---|---|
| Energy, both renewable and non-renewable sources | Wild animals | |||
| Minerals | Wild plants | |||
| Timber | Navigation – use of waterways for transportation | |||
| Agricultural production and caught fish1 | ||||
| Water | ||||
| Source: Office for National Statistics | ||||
| Notes: | ||||
| 1. Farmed animals are not included in these estimates as they are seen as produced rather than natural assets, instead the grass and feed that livestock eat are regarded as ecosystem services and so are included. Similarly, only caught fish is included and aquaculture (farmed fish) is excluded. | ||||
Download this table Table 1: Provisioning services - products such as food, water, fibre and fuel
.xls (26.6 kB)Figure 1 presents the change in the physical supply of agricultural biomass (crops and feedstock), timber and minerals between 1997 and 2015, as well as the amount of water abstracted and tonnes of fish caught in the UK. Annual valuations of these services are presented in Figure 2.
Timber production has seen a marked rise since 1997
Timber production has increased by almost 50% since 1997, although between 2014 and 2015 timber production fell slightly. The recent fall is partly attributable to more trees being removed and destroyed under Plant Health Legislation. The majority of trees removed under this legislation were softwood, such as Japanese larch suspected of being infected by Phytophthora ramorum . The recent decrease is also seen in the 2015 timber valuation presented in Figure 2.
Agricultural biomass in 2015 was the third most valuable service in the UK natural capital accounts
The volume of agricultural biomass (crops, feedstock and grazing) produced has stayed relatively stable between 2000 and 2015, however, the volume of crops produced (arable and horticultural crops, and feedstock) increased by 20% between 1997 and 2015, whilst grazed biomass (an estimate of grass and other vegetation consumed by animals) fell. The large increase in production and value between 2013 and 2014 is partly attributable to favourable weather conditions in 2014.
Agricultural biomass in 2015 was the third most valuable ecosystem service in the UK natural capital accounts, behind provision of recreational opportunity and production of renewable energy.
General decline in the volume of fish caught at sea and inland
Tonnes of fish caught have steadily declined since 1998. This decline can be attributed to a variety of factors, including EU fishing quotas and increased numbers of fish produced in fish farms (not captured in the natural capital accounts). The volume of fish caught increased by 20% between 2013 and 2014, the largest increase since the time series began, this was followed by a fall of 7% between 2014 and 2015.
Fish valuations, presented in Figure 2, tend to be volatile and changes are often a result of increasing or decreasing operating costs, such as fuel costs, repair costs and crew costs.
Volume of water being abstracted is falling, indicating more efficient use of water
Water abstracted in the UK has fallen by 18% since 2000. A possible reason for the decline is more efficient and sustainable use of water, as advocated in the Water Act 2003. Additionally, fewer licences have been granted for water abstraction, with fewer being issued annually in the last decade than between 1997 and 2002.
The value of water abstraction fell in 2015 to £588 million, this compares to £1.2 billion in 2014. This trend mimics declining physical water abstraction volumes and can also be attributed to higher operating costs.
Value of minerals as a services fell by 60% following 2012 peak
The UK mines several minerals, two-thirds of which are limestone and dolomite, and sand and gravel. Mineral production decreased by 25% between 2007 and 2015 and the value of the service decreased in recent years falling 60% since it peaked in 2012. Many of the minerals are typically used in construction and possible reasons for the decline are the recent economic downturn and increased use of recycled minerals in construction and timber framed pre-fabricated construction (UK Mineral Forum, 2014).
Figure1: Select provisioning service production, 2000 to 2015 (2000 = 100)
UK
Source: Office for National Statistics, Environment Agency, MENE survey, British Geological Survey, Defra, Forestry Commission, FAO
Notes:
- Non-indexed production data are available in the reference tables provided with this release.
- Mineral production includes, sandstone, limestone & dolomite, chalk, igneous rock, salt, sand & gravel, slate, clays & kaelin, other N.E.C., fertiliser minerals, gypsum, potash and peat.
Download this chart Figure1: Select provisioning service production, 2000 to 2015 (2000 = 100)
Image .csv .xls
Figure 2: Annual values of select provisioning services, 2000 to 2015 (£ million, 2015 prices)
UK
Source: Office for National Statistics, Forestry Commission, FAO
Notes:
- Mineral estimated using monetary valuations are published in the British Geological Survey’s (BGS) United Kingdom Minerals Yearbook. Includes, sandstone, limestone & dolomite, chalk, igneous rock, salt, sand & gravel, slate, clays & kaelin, other N.E.C., fertiliser minerals, gypsum, potash and peat.
Download this chart Figure 2: Annual values of select provisioning services, 2000 to 2015 (£ million, 2015 prices)
Image .csv .xlsIn 2015, 9 times as much energy was produced from renewable sources than was produced in 1997
Natural resources in the UK are used to provide energy in the form of electricity and heat. Figure 3 presents energy produced from UK oil and gas resources and renewable sources, predominantly wind, solar and hydropower. Production in this section should not be confused with energy consumption which includes imported fuel resources and other forms of energy sources such as nuclear.
Figure 3: Energy produced by UK oil and gas and renewable sources, thousand tonnes of oil equivalent, 1997 to 2015
UK
Source: Office for National Statistics, Digest of UK Energy Statistics, Oil and Gas Authority
Notes:
- Includes oil and gas production. Sourced from the Oil and Gas Authority.
- Includes energy generated from wind, solar, hydro, sewage, landfill, energy from waste combustion, co-firing with fossil fuels, animal biomass and anaerobic digestion. Energy generated from plant biomass has been excluded to avoid double counting with plant used for bio-fuel in agricultural production.
- Due to data limitations the renewable source valuation excludes a number of key costs attributed to renewable energy production.
Download this chart Figure 3: Energy produced by UK oil and gas and renewable sources, thousand tonnes of oil equivalent, 1997 to 2015
Image .csv .xlsThe volume of energy produced from UK oil and gas resources has fallen since 1999 and production is expected to continue to fall going forward (Oil and Gas Authority). Energy produced in the UK from renewable sources has increased dramatically and in 2015 nine times as much energy was produced from renewable sources than was produced in 1997. National and international incentives, including the EU Renewable Energy Directive and Renewable Obligation (RO) target, have helped contribute towards the increase.
Figure 4 presents the annual valuations of renewable energy produced in the UK and energy produced from UK oil and gas resources. In 2015, for the first time the value of energy generated in the UK by renewable resources was greater than that of energy produced by UK oil and gas resources. Increased electricity generated from renewable sources between 2014 and 2015 (26%) contributed to the increase in value between this period. However, due to data limitations the renewable source valuation excludes a number of key costs attributed to renewable energy production, therefore is an overestimate. Further work is required to estimate the costs excluded.
The oil and gas valuations are volatile as they are dependent on their respective prices. For example, growth between 2002 and 2008 can be attributed to growth in oil prices (over $140 or £75 per barrel). The large fall in value between 2014 and 2015 are in part from the fall in UK oil and gas production combined with historically low oil and gas prices (lowest oil price since 2004).
Figure 4: Value of UK oil and gas and renewable energy sources, 1997 to 2015 (£ million, 2015 prices)
UK
Source: Office for National Statistics, Oil and Gas Authority
Notes:
- Includes energy generated from wind, solar, hydro, sewage, landfill, energy from waste combustion, co-firing with fossil fuels, animal biomass and anaerobic digestion. Energy generated from plant biomass has been excluded to avoid double counting with plant used for bio-fuel in agricultural production.
- Monetary valuations for renewable sources is only available back to 2010.
Download this chart Figure 4: Value of UK oil and gas and renewable energy sources, 1997 to 2015 (£ million, 2015 prices)
Image .csv .xls5. Air filtration and carbon sequestration – regulating services
As well as tangible material provisioning services, natural assets in the UK provide a number of typically intangible regulating and cultural services, such as clean air, regulating water flows to prevent flooding and opportunities for recreation and inspiration.
This section presents two such ecosystem services that are classed as regulating ecosystem services. Many more services are provided but have not yet been developed with the account, as shown in Table 2. As methods and estimates are developed for other services they will be included in these aggregate accounts.
Table 2: Regulating Services
| Included | Not included | |
|---|---|---|
| Regulating services, producing benefits such as water purification, climate regulation, pollution and flood hazard reduction | ||
| Carbon sequestration | Waste water cleaning | |
| Air pollution removed by vegetation | Mediation of smell, noise and pollution removed by water | |
| Flood, erosion and landslide protection | ||
| Temperature regulation | ||
| Water flow control and water condition regulation | ||
| Source: Office for National Statistics | ||
Download this table Table 2: Regulating Services
.xls (26.6 kB)
Figure 5: Tonnes of carbon sequestered and air pollutants removed by vegetation in the UK, thousand tonnes, 2007 to 2015
UK
Source: UK Greenhouse Gas Inventory and Centre for Ecology and Hydrology.
Notes:
- Pollution removal includes the removal of PM10, PM2.5, SO2, NH2, NO2 and O3.
Download this chart Figure 5: Tonnes of carbon sequestered and air pollutants removed by vegetation in the UK, thousand tonnes, 2007 to 2015
Image .csv .xls15% more carbon was sequestered by UK vegetation in 2015 than in 1997
15% more carbon was sequestered by UK vegetation in 2015 than was sequestered in 1997, equivalent to over 3 billion tonnes. Projections provided by the National Atmospheric Emissions Inventory forecast annual sequestration to continue to increase until 2019. The government’s non-traded carbon price is used to estimate the value of this ecosystem service, which is shown in Figure 6. The carbon price stays fairly constant at around £60 to £61 per tonne.
Vegetation removing pollution is valued highly at just over £1billion
The amount of pollution removed by UK vegetation in physical terms is far less, however, the service of removing pollution is valued highly due to the damage pollution causes to human health. The majority of the value is attributed to the removal of fine particulate matter (PM2.5) from the atmosphere, as explained in the article, The UK environment - fighting pollution, improving our health and saving us money.
PM2.5 has a diameter of 2.5 micrometers, which is about 3% of the diameter of a human hair, and can bypass the nose and throat to penetrate deep into the lungs, leading to potentially serious health effects and healthcare costs. The decline in value between 2007 and 2015 is largely due to less pollution being emitted into the atmosphere for vegetation to remove, rather than a reflection of changing condition or extent of vegetation.
Figure 6: Annual Value of carbon sequestration and air pollutant removed by vegetation in the UK, 2007 to 2015 (£ million, 2015 prices)
UK
Source: UK Greenhouse Gas Inventory and Centre for Ecology and Hydrology.
Notes:
- Pollution removal includes the removal of PM2.5, SO2, NO2 and O3.
Download this chart Figure 6: Annual Value of carbon sequestration and air pollutant removed by vegetation in the UK, 2007 to 2015 (£ million, 2015 prices)
Image .csv .xls6. Recreation – cultural services
This section presents the cultural service of nature providing recreational opportunities. Many more cultural services are also provided by natural capital in the UK, such as aesthetic appreciation and heritage value, as shown in Table 3. These cultural service accounts are not yet developed.
Table 3: Cultural services
| Included | Not included |
|---|---|
| Cultural services, producing non material benefits for example recreation enjoyment and aesthetic experience | |
| Setting for outdoor recreation (day trips by UK residents) | Scientific and educational interactions |
| Heritage and aesthetic interactions | |
| Value place on nature simply existing (non-use and symbolic values) | |
| Settings for outdoor physical activity (health benefits) | |
| Source: Office for National Statistics | |
Download this table Table 3: Cultural services
.xls (26.6 kB)Slight decrease in hours spent in the natural environment in 2015
Over 4.3 billion recreational hours were spent in the natural environment in 2015, a decline of 5% compared to 2014 but an increase of 11% since the time series began in 2009. Walking, both with and without a dog, are the most popular types of recreational activities to partake in natural areas. Although less popular, playing with children, eating or drinking out and running are also common activities.
Figure 7: Time spent in natural environment and monetary valuation, 2009 to 2015
UK
Source: Monitor of engagement with the Natural Environment (MENE) and Natural England
Notes:
- Data is reported March to February, 2009 = Mar 2009 to Feb 2010
Download this chart Figure 7: Time spent in natural environment and monetary valuation, 2009 to 2015
Image .csv .xlsRecreational visits in nature are valued based on expenditure on that trip. Despite time spent on recreational activity increasing between 2009 and 2015, the value of this service has fallen by 26% since 2009 from £7.9 billion to £5.8 billion. By only using expenditure the value of recreational service is heavily underestimated as free trips, such as short walks in local parks which have incurred no cost are not captured. Further research to assess the effects of local green space on house price data which could potentially capture these free recreational trips is being conducted and will be published later in 2018.
Figure 8 presents expenditure by type in 2009 and 2015. The majority of expenditure goes towards fuel and public transport travelling to the site, so low petrol prices in 2014 and 2015 will have contributed to the decrease between 2009 and 2015. Less expenditure on admission fees is also contributing to the declining value.
Figure 8: Total expenditure incurred to access natural areas, 2009 and 2015 (£ million 2015 prices)
UK
Source: Monitor of engagement with the Natural Environment MENE) and Natural England.
Notes:
- Data is reported by financial year, 2009 = 2009/2010
Download this chart Figure 8: Total expenditure incurred to access natural areas, 2009 and 2015 (£ million 2015 prices)
Image .csv .xls7. Asset valuation – what is the value of natural capital in the UK?
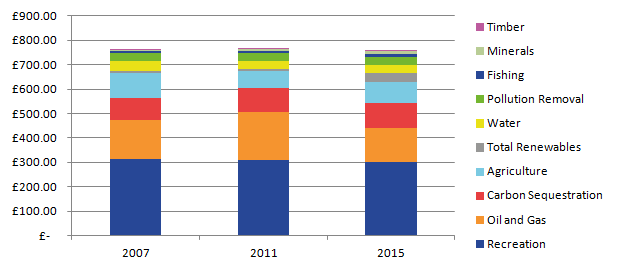
Figure 9 presents partial UK natural capital asset value estimates for 2007, 2011 and 2015 by ecosystem service. The reference tables that accompany this release provide the full time series.
The partial estimate of UK natural capital was £761 billion in 2015. This compares with £764 billion in 2007 and £767 billion in 2011. Although the asset valuation for oil and gas fell by almost a quarter between 2011 and 2015, this was offset by increases in other services particularly renewable energy and agricultural biomass.
In 2015, UK natural capital assets supplying cultural and regulating services made up the largest proportion of the natural capital assets currently measured (58%).
This is a partial value as many ecosystem services provided by natural assets in the UK are not yet estimated and the total value is expected to be higher than that given here.
The asset values are estimated by capitalising the annual flow of services from the natural resource that are expected to take place over a projected period. This period is known as the asset life. The annual environmental service flows reported in the previous section provide the basis for the projected flows. Under this valuation approach, a change in a given natural capital’s asset value can be interpreted as a reduction or increase in the ability to provide the associated environmental services into the future. This method, known as Net Present Valuation (NPV), is explained in more detail in the methodology section of this release.
Many of the environmental services presented in this bulletin are produced from renewable resources whose stock is not exhausted over time, for example UK woodland delivering carbon sequestration. For these services a 100-year asset life has been assumed.
As data on future flows is limited, a decline in the asset value generally signifies a decline in annual flow between periods. Exceptions are carbon sequestration and oil and gas, where future physical sequestration rates and oil and gas production are modelled to 2050. These projections have been incorporated.
Figure 9: Estimation of the value of UK natural capital in 2007, 2011 and 2015 (£ billion, 2015 prices)
UK
Source: Office for National Statistics, Monitor of engagement with the Natural Environment( MENE) and Natural England.
Notes:
- Data for recreation is only available for the years 2009 to 2015. The 2009 asset value is assumed to be the same as 2007 asset valuation.
- Data for renewable energy is only available for the years 2010 to 2015. The 2010 asset value is assumed to be the same as 2007 asset valuation.
Download this image Figure 9: Estimation of the value of UK natural capital in 2007, 2011 and 2015 (£ billion, 2015 prices)
.png (10.1 kB) .xlsx (10.4 kB)
8. Quality and Methodology
We have used a wide variety of sources for estimates of UK Natural Capital, which have been compiled in line with the guidelines recommended by United Nations (UN) System of Environmental-Economic Accounting Central Framework and System of Environmental-Economic Accounting Experimental Ecosystem Accounting principles, which are in turn part of the wider framework of the System of National Accounts. As the UN guidance is still under development, ONS and Defra published a summary of the principles underlying the accounts, this will be updated later in 2018.
The methodology used to develop these estimates remains under development; the estimates reported in this publication are experimental and should be interpreted in this context. Experimental Statistics are those that are in the testing phase, are not yet fully developed and have not been submitted for assessment to the UK Statistics Authority. Experimental Statistics are published to involve customers and stakeholders in their development and as a means of building in quality at an early stage. Further information on Experimental Statistics can be found on our website. Revisions to monetary estimates and detailed information on the data sources and methodologies are presented in this section.
Revisions to monetary valuations
This section explains why the annual and asset values have changed since those presented in 2016. Table 1 presents the valuations in previous publication and those in this publication.
Table 4: Monetary valuation revisions, 2014 (£ million, 2015 prices)
| Annual Flow | Asset value | ||||||
|---|---|---|---|---|---|---|---|
| 2016 Bulletin | 2018 Bulletin | 2016 Bulletin | 2018 Bulletin | ||||
| Provisioning Services | |||||||
| Agriculture | £1,329 | £3,424 | £32,501 | £88,741 | |||
| Fishing And Aquaculture (now fishing) | £386 | £297 | £9,186 | £11,155 | |||
| Timber | £226 | £270 | £4,267 | £5,956 | |||
| Water | £1,208 | £1,207 | £29,346 | £35,363 | |||
| Mineral | £215 | £620 | £3,753 | £9,667 | |||
| Oil and Gas | £7,138 | £7,278 | £22,726 | £140,058 | |||
| Wind and hydropower (now total renewable energy) | £2,159 | £1,292 | £54,668 | £21,186 | |||
| Regulating Services | |||||||
| Carbon Sequestration | £1,673 | £1,566 | £61,016 | £103,160 | |||
| Pollution Removal | 1 £4,526 | £1,144 | £114,753 | £32,677 | |||
| Cultural Services | |||||||
| Recreation | £6,550 | £6,550 | £167,085 | £302,143 | |||
| Total | £25,409 | £23,649 | £499,301 | £750,105 | |||
| Source: Office for National Statistics | |||||||
| Note: | |||||||
| 1. At the time a 2014 estimate was not available, a 2011 valuation is presented here. | |||||||
Download this table Table 4: Monetary valuation revisions, 2014 (£ million, 2015 prices)
.xls (28.2 kB)A number of revisions have been made to estimates since the previous publication in 2016. Asset valuations have predominantly increased for two reasons; firstly, the asset life assumption for renewable services has increased to 100 years following an extensive review of the choice of discount rate and asset life. Previously the asset life was set at 50 years.
Asset valuations for recreation now incorporate population and income projections. See the recreation methodology for further details.
Oil and gas asset valuations have been heavily revised as projected oil and gas revenue and expenditure information to 2040 are no longer published by the Office for Budget Responsibility (OBR). Projected production estimates are published by the Oil and Gas Authority (OGA) and asset values have been revised to incorporate production projections only and assume income and expenditure to remain constant.
Renewable energy sourced from wind and hydropowers were originally calculated from published company accounts information. Gross Value Added for renewable energy production is now estimated from ONS Environmental Goods and Services (EGSS) estimates.
Pollution removal estimates were developed further and are now estimated using a sophisticated, dynamic spatial modelling approach developed by the Centre for Ecology and Hydrology. See the air pollution removal methodology for further details. Agriculture annual flows have been revised upward, this a result of downward revisions to capital stock estimates for this industry in ONS National Accounts.
Methodology
This section describes the methodology used to develop the UK natural capital accounts. The broad approach to valuation and the overarching assumptions made are explained in this section, followed by a more detailed description of the specific methodologies used to value the individual components of natural capital and physical and monetary data sources.
We welcome feedback regarding any of the approaches presented.
Annual ecosystem service flow estimates
Two approaches are used to value the annual service flows. For carbon sequestration, pollution removal, recreation and timber an estimate of physical quantity is multiplied by a price.
For oil and gas, minerals, water, agricultural produce, fish and renewable energy, a “residual value” resource rent approach is used. Before detailed data source and methodology is described the resource rent approach is defined.
1.1. Resource rent definition and assumptions
The resource rent can be interpreted as the annual return stemming directly from the natural capital asset itself, that is, the surplus value accruing to the extractor or user of a natural capital asset calculated after all costs and normal returns have been considered.
The steps involved in calculating the resource rent are given in Table 5. Variations of this approach are applied depending on the category of natural capital under assessment, the variations are explained in the individual ecosystem service methodology.
Table 5: Derivation of resource rent
Output Less Operating costs Intermediate consumption Compensation of employees Other taxes on production PLUS other subsidies on production Equals Gross operating surplus – SNA basis Less Specific subsidies on extraction Plus Specific taxes on extraction Equals Gross operating surplus – resource rent derivation Less User costs of produced assets (consumption of fixed capital + return to produced assets) Equals Resource rent Source: Office for National Statistics Download this table Table 5: Derivation of resource rent
.xls (27.1 kB)The majority of data used in resource rent calculations are taken from the Office for National Statistics Supply and Use tables. Return to produced asset estimates are calculated using the nominal ten-year government bond yield published by the Bank of England, and deflated using the gross domestic product (GDP) deflator to produce the real yield. This rate is relatively conservative compared to those expected in certain markets, such as oil abstraction and water supply, and could overstate the resulting resource rent estimates.
Asset valuation – net present value
The net present value (NPV) approach is recommended by the System of Environmental-Economic Accounts (SEEA) and it is applied for all ecosystem services to estimate the asset value. The NPV approach estimates the stream of services that are expected to be generated over the life of the asset. These values are then discounted back to the present accounting period. This provides an estimate of the capital value of the asset relating to that service at a given point in time. There are three main aspects of the NPV method:
- Pattern of expected future flows of values.
- Asset life – time period over which the flows of values are expected to be generated.
- Choice of discount rate.
2.1. Pattern of expected future flows of services
A key factor in the valuation of natural capital is determining the expected pattern of future flows of services. These paths are not observed and hence assumptions concerning the flows must be made, generally as a projection of the latest trends. A more basic way to estimate the expected flows is to assume that the current flow (averaged over recent years) is constant over the asset life, but this might not be the case. In some cases more information is available on future expected levels of services in non-monetary terms or future unit prices. Where there are readily available official projections, these have been taken into account, but otherwise the default assumption in these estimates is that the value of the services is constant over time.
This paper assumes constant service values throughout the asset life, except for the estimates for oil and gas flows and carbon sequestration, where official projections are used.
Where the pattern of expected service values is assumed to be constant, it is based on averages over the latest five years, up to and including the reference year in question. This is set out in the equation below.
Equation to calculate future service values
Where SV = service value and t = reference year
2.2. Asset life
The asset life is the expected time over which the services from a natural resource are expected to be provided. An estimate of the asset life is a key component in the NPV model because it determines the expected term over which the service flows from an asset should be discounted. This publication takes one of three approaches when determining the life of a natural capital asset.
- Non-renewable natural capital assets: Where a sufficient level of information on the expected asset lives is available this asset life is applied in the calculations. Where a sufficient level of information on their respective asset lives is not available a 25-year asset life is assumed.
- All other natural capital assets: A 100-year asset life is applied to all assets that fall within this category of natural capital.
2.3. Choice of discount rate
A discount rate is required to convert the expected stream of service flows into a current period estimate of the overall value. A discount rate expresses a time preference – the preference for the owner of an asset to receive income now rather than in the future. It also reflects the owner’s attitude to risk. The use of discount rates in NPV calculations can be interpreted as an expected rate of return on the environmental assets.
Based on an extensive review by external consultants, ONS and Defra use the discount rate set out in the HM Treasury Green Book (2003, page 100). In line with guidance set out in the document, estimates presented in this publication assume a 3.5% discount rate for flows projected out to 30 years, declining to 3.0% thereafter, and 2.5% after 75 years.
Methodology by service
Table 6 provides a broad overview of the steps involved in calculating a resource rent using a residual value approach. While this method forms the overarching basis to producing many of the estimates presented in this publication, slight adjustments to the method are required for individual service flows. The following section provides an in-depth explanation of the adjustments made for each service, together with more detail where the resource rent approach has not been used.
3.1. Agricultural biomass
Agricultural biomass relates to the value of crops, fodder and grazed biomass provided to support agricultural production in the UK. Physical production is obtained from UK June and December Surveys. Valuations are based on data for the SIC subdivision class: Crop and animal production, hunting and related service activities.
Owner-occupier farms whose “wages” would not necessarily be recorded under compensation of employees have not been fully accounted for at present. As a result, resource rents for the reference period covered may be overestimated as notional “wages” (essentially paid out of the profit of the farm) have not been taken out of the calculation. Further work in this area will need to consider changes in the diversity and productivity of the farming sector.
3.2. Water
Physical data for water abstraction are sourced from Scottish Water for Scotland and the Department for Environment, Food and Rural Affairs (Defra) for England and Wales. Data for Wales are surface water only. No industry water data is available for Scotland so only data for public water supply are included to maintain consistency. Removing industry data also avoids double counting with the valuation of hydropower.
Northern Ireland Water state on their website that approximately 560 million litres of good quality drinking water is supplied every day. This figure is converted into million cubic metres per year and 20% leakage assumed. This estimate is then applied for all years in the data series.
Monetary estimates are based on resource rents calculated for the SIC subdivision class: Water collection, treatment and supply.
The definition of this industry subdivision states: “the collection, treatment and distribution of water for domestic and industrial needs. Collection of water from various sources, as well as distribution by various means is included”. A limitation of this approach, therefore, is that the calculated resource rent is not purely related to water supply, but also includes the process of treating the water.
Future work is required to better value the range of services relating to water provided by the natural environment.
3.3. Fish
Physical data for the weight of fish captured from inland waters is from the Food and Agriculture Organisation (FAO). Aquaculture is not included within the estimates. Valuations are calculated using a resource rent based approach on the industry subdivision: Fishing and aquaculture.
Aquaculture or farmed fish, like farmed livestock have been removed from estimates as farmed fish are viewed as a produced asset and not a natural asset. The proportion of fish caught by weight compared to fish farmed has been used to remove aquaculture from the resource. For example, in 2015 27% of fish produced were farmed rather than caught; therefore, 27% of the resource rent was removed.
This method does not recognise that farmed fishing could be less resource intensive and more productive than catching fish at sea or in inland waters. Further work is needed to assess if other data sources could be used to estimate the value of caught fish only.
The residual value approach is used to value the ecosystem services from freshwater to fish capture. Ratio of fishing from inland freshwater to all types of fishing is applied to resource rent as only monetary data is available for the whole of fishing and aquaculture. This assumes that the unit costs and revenue from inland fishing are the same as for the whole of marine, freshwater fishing and aquaculture.
3.4. Minerals
The residual value approach to determining resource rent, as set out in the previous section, is used to estimate monetary values related to all categories of UK mineral assets.
Physical production estimates are sourced from the British Geological Survey’s (BGS) United Kingdom Minerals Yearbook publication.
The mineral resource rent is calculated using data from SIC subdivision class: Other mining and quarrying.
3.5. Oil and gas
The estimates are based on the methodology published by the Office for National Statistics (ONS) in June 2013. The methodology relied on an Office for Budget Responsibility (OBR) forecast of oil and gas production and prices, and the incomes and expenditures derived from these. This year OBR have not produced these forecasts and are not anticipating their production going forward.
Production forecasts are provided by the Oil and Gas Authority (OGA) to 2035. Future flows now follow dependent on these forecasts alone and do not adjust for price or revenue changes. The asset value time series has been revised to ensure consistency and previous OBR forecasts used have been removed.
3.6. Renewable energy
Energy generated by renewable source is published in the BEIS’s DUKES publication (Table 6.1.1). Other renewable sources published in the reference tables include, sewage, landfill, energy from waste combustion, co-firing with fossil fuels, animal biomass and anaerobic digestion. Energy generated from plant biomass has been excluded to avoid double counting with plant used for bio-fuel in agricultural production.
The monetary estimates are gross value added only and not resource rent calculations, therefore are over estimates. Gross value added estimates were calculated from the environmental goods and services sector (EGSS) estimates. A detailed publication on EGSS estimates was published in January 2017, in which calculations and data sources have been fully described. GVA for renewable energy production is apportioned out by renewable energy source based on production.
This method will be reviewed in the coming year.
3.7. Timber
The method used to value the provisioning services related to timber supply requires two inputs: the stumpage price and the physical amount of timber removed. Annual flow values are then generated by multiplying the two factors together.
The stumpage price is the price paid per standing tree, including the bark, for the right to harvest timber from a given land area. It is sourced taken from the Forestry Commission Timber Price Indices publication (2017).
Removals estimates are taken from Forestry Commission Timber Statistics and converted from green tonnes to metres cubed (m3) overbark standing, using a conversion factor of 1.222 for softwood and 1.111 for hardwood.
Forests in the UK are assumed to be sustainably managed. As such, timber is judged to be a renewable resource and is given a 100-year asset life.
The asset values are based on a retrospective five-year rolling average of annual flow estimates, up to a given reference year. For instance, annual flow projections for 2008 would be based on the average annual flow for the 2004 to 2008 period.
3.8. Carbon sequestration
Estimates relate to the removal of carbon gas from the atmosphere by UK terrestrial ecosystems. The approach used combines data on the physical changes in subdivisions of the LULUCF sector (published by BEIS), with information on the non-traded price of carbon.
Due to data constraints values related to carbon sequestration by marine ecosystems, including those intertidal areas such as coastal margins, are not included in current estimates. As a result, annual flow values related to carbon sequestration services are likely to be an underestimate.
The LULUCF sector breakdown identifies carbon sequestration activities in the following subcategories:
- Forest Land remaining Forest Land
- Land converted to Forest Land
- Grassland remaining Grassland
- Land converted to Grassland
For the years 2007 to 2015, actual physical estimates of carbon sequestration by land use class are sourced from the UK greenhouse gas inventory.
In the asset valuation, projections of carbon sequestration rates are provided for the years 2016 to 2050 by the National Atmospheric Emission Inventory (NAEI). Baseline 1 projections are used. Thereafter, estimates are based on the projected carbon sequestration level in 2050, and held constant for the remainder of the 50-year period.
The carbon price used in calculations is based on the projected non-traded price of carbon schedule. This is contained within the data table 3 of the Green Book supplementary guidance.
For years used in the projections beyond 2050, the carbon sequestration rate is assumed to be constant as at 2050 levels.
3.9. Air pollution removal by vegetation
Air quality regulation estimates have been supplied in consultation with Eftec and the Centre for Ecology and Hydrology (CEH). The method and estimates are heavily revised from those published previously, reflecting a more sophisticated, dynamic spatial modelling approach. A methodology report published in July contains details of the changes, full methodology and estimates for all habitats.
Calculation of the physical flow account uses the EMEP4UK atmospheric chemistry and transport model which generates pollutant concentrations directly from emissions, and dynamically calculates pollutant transport and deposition, taking into account meteorology and pollutant interactions. This differs from the previous draft account which used a static methodology where pollutants were considered in isolation, incorporating only limited effects of meteorology, and where effects of pollutant transport in the atmosphere as well as the feedback of the deposition on air concentration were not considered.
The health benefits were calculated from the change in pollutant exposure from the EMEP4UK scenario comparisons, that is the change in pollutant concentration to which people are exposed. Damage costs per unit exposure were then applied to the benefitting population at the local authority level for a range of avoided health outcomes:
- respiratory hospital admissions
- cardiovascular hospital admissions
- loss of life years (long-term exposure effects from PM2.5 and NO2)
- deaths (short-term exposure effects from O3)
Future flow projections used for asset valuation incorporate population projections and an assumed 2% increase in income per year (declining to 1.5% after 30 years and 1% after 75 years). Income elasticity is assumed to be 1. More work is being conducted in this area.
3.10. Outdoor recreation
The recreation estimates are based on expenditure incurred to travel to the natural environment and expenditure incurred during the visit. This expenditure method considers the market goods consumed as part of making the recreational visit (that is, fuel, public transport costs, admission charges and parking fees). This expenditure is currently assumed to proxy a marginal price for accessing the site.
Natural England’s Monitoring Engagement in the Natural Environment (MENE) survey is the primary data source. The MENE survey collects information about the way people engage with the environment, such as visiting the countryside, enjoying green spaces in towns and cities, watching wildlife and volunteering to help protect the natural environment. The survey involves weekly waves of interviewing and explores in detail a visit to a site by respondents during the last 7 days (Natural England, 2015).
The MENE survey covers England only, so results are scaled up to the UK using population estimates.
Future flow projections used for asset valuation incorporate population projections and an assumed 2% increase in income per year (declining to 1.5% after 30 years and 1% after 75 years). Income elasticity is assumed to be 0.5. More work is being conducted in this area.
The recreation estimates have been developed by Ricardo-AEA, who also reviewed various different methods of valuing recreation. It was concluded only admission fees and travel expenditure should be included in the valuation as including the opportunity cost of time presents considerable conceptual and practical problems. However, this will cause an underestimation, as the value of visits that have incurred no cost, for example, a walk along a local riverbank, will not be captured. This is an area of further research.