1. Other pages in this release
This publication contains estimates of public service healthcare productivity in the UK on a calendar year basis, along with brief guidance on the methods used and how to interpret the statistics. This release also includes a separate article providing more detailed analysis on public service healthcare productivity in England on a financial year basis and the annual article on total UK public service productivity estimates:
- Public service productivity, healthcare, England: financial year ending 2018
- Public service productivity: total, UK, 2017
2. Main points
- Public service healthcare productivity grew 0.9% in 2017 because of output growth of 2.4% exceeding inputs growth of 1.5%.
- Productivity growth in 2017 was similar to the annual average for the series since 1995 of 0.8%, although both output and inputs growth were well below their respective series averages of 4.5% and 3.7%.
- On average, output and inputs growth have been slower during the 2010s than the 2000s, but productivity growth higher, with the period since 2009 accounting for most of the productivity growth over the whole series, 1995 to 2017.
- The quality adjustment added 0.4 percentage points to output growth in 2017, indicating an increase in service quality; this was a larger quality adjustment effect than in 2016 but slightly below the annual average since 2001.
- The level of non-quality adjusted productivity increased by only 0.7% over the period 1995 to 2009, but between 2009 to 2017 rose by a further 9.7%.
3. Public service healthcare productivity overview
Public service healthcare productivity is estimated by comparing growth in the total quantity of healthcare output provided (adjusted for quality where possible) with growth in the total quantity of inputs used. If output growth exceeds input growth, productivity increases, meaning that more output is being produced for each unit of input. Conversely, if input growth exceeds output growth then productivity will fall.
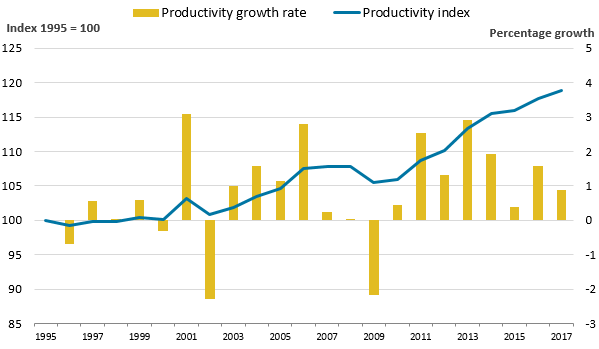
Figure 1a: Public service healthcare productivity rose by 0.9% in 2017, marking the eighth year in a row of productivity growth
Public service healthcare productivity index and growth rate, UK, 1995 to 2017
Source: Office for National Statistics
Notes:
- Annual growth rates are shown as bars (measured against the right axis) while the cumulative changes in the series since 1995 are shown by the lines (measured against the left axis and indexed to a level of 100 in 1995).
Download this image Figure 1a: Public service healthcare productivity rose by 0.9% in 2017, marking the eighth year in a row of productivity growth
.png (15.9 kB) .xls (36.9 kB)
Figure 1a shows that public service healthcare productivity grew 0.9% in 2017, slightly faster than the average annual growth rate of the whole time series between 1995 and 2017 of 0.8%1.
Figure 1a shows that productivity growth has fluctuated over time, but has been more consistently positive during the 2010s than during the earlier period, with the majority of productivity growth in the series being recorded since 2009.
Figure 1b: On average, productivity has grown faster during the 2010s than the 2000s, although inputs and output have grown more slowly
Public service healthcare output, inputs and productivity indices and growth rates, UK, 1995 to 2017

Source: Office for National Statistics
Notes:
- Output is quality adjusted.
Download this image Figure 1b: On average, productivity has grown faster during the 2010s than the 2000s, although inputs and output have grown more slowly
.PNG (31.5 kB) .xls (39.4 kB)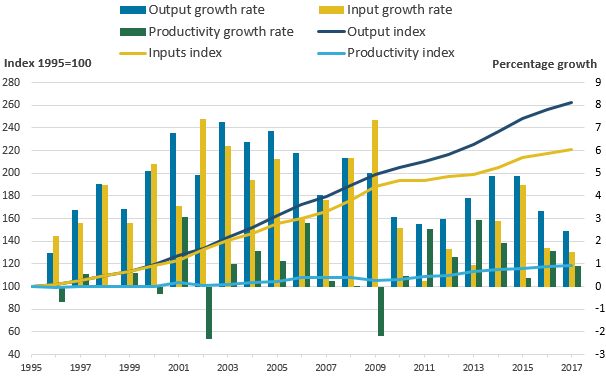
Figure 1b shows that the productivity increase of 0.9% in 2017 was caused by output growing at 2.4%, while inputs grew at a lower rate of 1.5%.2
Productivity growth in 2017 slowed relative to growth in 2016 (of 1.6%) as, while inputs and output growth both slowed, output growth slowed more substantially than inputs growth.
While growth in inputs and output are slower during the 2010s than the 2000s, productivity growth has generally been faster because the slowdown in inputs growth has been more substantial than the slowdown in output growth.
It should be noted that these productivity estimates provide a measure of the amount of output that is produced for each unit of input, but they do not measure value for money or the wider performance of public healthcare services. They do not indicate, for example, whether the inputs have been purchased at the lowest possible cost, or whether the desired outcomes are achieved through the output provided.
Notes for: Public service healthcare productivity overview
Growth rates for a single year are given as the growth between the stated year and previous year. For example, the growth figure for 2017 is the growth measured between 2016 and 2017. Growth rates for a period of more than one year are given as the growth between the first and the last year in that period. For example, growth between 2015 and 2017 represents growth between the level of a series in 2015 and its level in 2017.
While productivity growth is calculated using the difference between output and input growth, productivity growth is calculated using unrounded data and therefore the productivity growth figures in this article may differ from figures calculated using rounded output and input growth rates.
4. Inputs
Inputs in the public service healthcare productivity measure are broken down into three components:
- labour, or staff inputs
- goods and services inputs, which include the intermediate consumption of equipment used by healthcare providers, such as gloves and syringes; this component also includes GP-prescribed drugs, services provided by non-NHS organisations and agency staff costs
- capital consumption, which covers the cost of depreciation of capital goods (items that are anticipated to be in use over several years, such as buildings and vehicles) over time
Labour inputs are largely measured using changes in the number of full-time equivalent employees of the health service, weighted by their average earnings. Inputs for goods and services are estimated by adjusting expenditure for each sub-component using appropriate measures of inflation, known as deflators. This removes the effects of price changes from current price expenditure and so produces a quantity input measure. Capital consumption is measured using the perpetual inventory method, as used in the UK National Accounts.
To produce the total inputs index, the growth rates of the three input components are weighted by their share of total expenditure and then combined. Goods and services inputs and labour inputs account for the largest shares of inputs expenditure and therefore have a greater weight and a greater effect on the overall inputs index than capital consumption which accounts for only a small share of expenditure.
Figure 2a: Inputs growth of 1.5% in 2017 was similar to the previous year, but below the average growth of the whole time series of 3.7%
Contributions to public service healthcare inputs growth by component, UK, 1995 to 2017
Source: Office for National Statistics
Notes:
- The contribution to growth for each component depends on both its growth rate and its weight in total inputs.
Download this chart Figure 2a: Inputs growth of 1.5% in 2017 was similar to the previous year, but below the average growth of the whole time series of 3.7%
Image .csv .xlsFigure 2a shows total inputs growth and how growth in each component contributes to the growth in overall inputs. In 2017, inputs grew by 1.5%, down from 1.7% the previous year and below the 3.7% average growth for the whole time series.
Figure 2b: In 2016 and 2017, labour inputs growth exceeded goods and services inputs growth, in contrast to the rest of the time series
Public service healthcare inputs quantity growth by component, UK, 1995 to 2017
Source: Office for National Statistics
Download this chart Figure 2b: In 2016 and 2017, labour inputs growth exceeded goods and services inputs growth, in contrast to the rest of the time series
Image .csv .xlsThe overall input growth in 2016 and 2017 was similar to the period between 2010 and 2013, the only other part in the time series where inputs growth was comparably low. However, the causes of low input growth were different for the two periods. Between 2010 and 2013, slow input growth was attributable to small falls in labour input of an average of 0.5% per year1. However, low input growth in 2016 and 2017 was mainly attributable to low growth in goods and services inputs, with labour inputs growing faster than at any other point in the 2010s.
Slower goods and services inputs growth and faster labour inputs growth were partly caused by related changes in agency and NHS bank staffing. NHS bank staff fulfil a similar role to agency staff, working variable hours in response to demand. As agency staff are not NHS employees, their costs are included within the goods and services inputs, while bank staff, who are NHS employees, are included in labour inputs.
Recent policy changes in the NHS in England, which are discussed in more detail in Public service productivity: healthcare, England, financial year ending (FYE) 2018, have resulted in a shift away from agency staff and towards using NHS bank staff. The rise in expenditure on NHS bank staff in England in FYE 2017 and FYE 2018 was roughly offset by the fall in expenditure on agency staff, meaning the combined effect of these two staff groups on overall inputs was relatively small.
Overall, the labour component of inputs grew 2.6% in 2017, in line with 2016, while goods and services inputs grew 0.5%, slightly down on the previous year’s 1.0%.
It should be noted that NHS bank staff in England have been included in the inputs for the first time² in this publication, but as data on NHS bank staff spending is only available from FYE 2016, this spending only affects the final two years of the time series.
Notes for: Inputs
Goods and services input growth also slowed during the period between 2010 and 2013, but at an average rate of 2.8%, was substantially higher than the 0.5% growth for 2017.
The chain-linking methodology used to construct the output and inputs indices means that the indices are constructed from a series of growth rates between consecutive pairs of years. As, a result, where new items are included, such as NHS bank staff in FYE 2016, these do not result in step-changes in the level of inputs or output. More information on chain-linking is available from this methodological note (PDF, 58KB).
5. Output quantity
The quantity of healthcare output is measured using the number of individual healthcare activities performed, weighted by the cost of each activity. As a result of this weighting process, growth in treatments that are common and expensive has a greater effect on the output index than a similar rate of growth in treatments that are uncommon and low-cost.
Healthcare output is estimated separately for each of the following sectors, which are weighted together to produce an overall quantity output series:
- hospital and community health services (HCHS) – includes hospital services, community care, mental health and ambulance services
- family health services (FHS) – includes general practice and publicly-funded dental treatment and sight tests
- GP prescribing
- non-NHS provision – includes healthcare funded by the government but provided by the private or third sector
Figure 3a: In 2017, quantity output growth for all four components slowed
Public service healthcare quantity output growth by component, UK, 1995 to 2017
Source: Office for National Statistics
Notes:
- HCHS – Hospital and Community Health Services.
- FHS – Family Health Services.
Download this chart Figure 3a: In 2017, quantity output growth for all four components slowed
Image .csv .xls
Figure 3b: In 2017, quantity output grew at its slowest rate since 1996
Contributions to public service healthcare quantity output growth by component, UK, 1995 to 2017
Source: Office for National Statistics
Notes:
- HCHS – Hospital and Community Health Services.
- FHS – Family Health Services.
- The sum of components of quantity output may not equal total output as the components and total output are independently splined to convert the data from financial to calendar year.
- The contribution to growth for each component depends on both its growth rate and its weight in total output.
Download this chart Figure 3b: In 2017, quantity output grew at its slowest rate since 1996
Image .csv .xlsIn 2017, public service healthcare quantity output (excluding quality adjustment) grew by 2.1%, continuing the slowdown in output growth seen in 2016. This reduction in output growth can be attributed to slower growth across all four components.
In recent years, the largest contribution of the four output components to healthcare output growth has come from HCHS, the category which accounts for most healthcare expenditure and therefore the greatest weight in total output. Growth in HCHS output in 2017 was 2.0%, slightly down from 2.5% in 2016 and its lowest growth rate since 2011.
Growth in non-NHS provision was relatively volatile in the early years of the series and grew particularly quickly over the period 1996 to 2009, when it averaged 13.9% per year. After this period, growth was steadier up to 2014, but recently the series saw a return to higher volatility with 16.3% growth in 2015 and only 3.1% in 2017, the slowest growth rate since 1999. Because of a lack of activity data, the output for non-NHS services is assumed to be equal to inputs and so changes in growth in this element has minimal effect on productivity.
GP-prescribed drugs are also measured on an “output-equals-inputs” basis and also grew particularly slowly in 2017, with growth of 2.6%.
Growth in the output of FHS was also lower in 2017 than in recent years, but the relatively stable growth rate of this component, partly because of the use of modelled estimates based on demographic data for general practice for England, means this component only had a small effect on the change in overall output growth.
Growth in the quantity of healthcare provided should be seen in the context of healthcare demand and its drivers. One of these drivers is an ageing population: while the total UK population grew at an annual average rate of 0.6% over the period 1995 to 2017, the population aged 75 years and over grew at 1.3%. However, research by bodies such as the Organisation for Economic Co-operation and Development suggests that demographic effects, such as a larger population and an increasing number of people aged 75 years and over, have a relatively small impact on healthcare expenditure and output growth. Factors such as medical advances, healthcare institutions and public expectations are viewed as more significant factors in explaining increases in healthcare expenditure and output over time (see Public spending on health and long-term care: a new set of projections for more information).
Nôl i'r tabl cynnwys6. Output quality
Healthcare quantity output is adjusted for changes in quality of the service from 2001 onwards. The quality adjustment incorporates a range of factors covering short-term post-operative survival rates, the estimated health gain from hospital procedures, waiting times, patient satisfaction and primary care outcomes. The quality adjustment is applied to the output of hospital and community health services, and family health services, which together account for 79% of output.
More information about quality adjustment in public service productivity is available in this guide, while information about the quality adjustment used for healthcare output can be found in Quality adjustment of public service health output: current method (PDF, 152KB).
A positive quality adjustment indicates that the quality of healthcare services provided, as defined by the selection of indicators used in the quality adjustment, has improved.
It should be noted that while the quality adjustment aims to cover a range of relevant aspects of healthcare quality, it cannot be taken as a comprehensive indicator of the quality or outcomes of all NHS services.
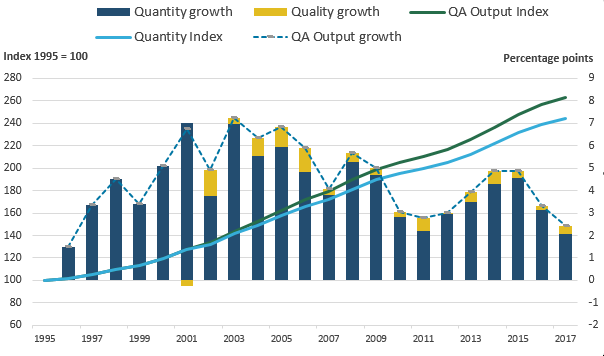
Figure 4: The quality adjustment has increased output growth in all years, except for 2001
Public service healthcare quantity and quality adjusted output indices and growth rates, UK, 1995 to 2017
Source: Office for national Statistics
Notes:
- QA - quality adjusted.
- The sum of components of output may not equal total output because of the method for splining data from financial to calendar year.
Download this image Figure 4: The quality adjustment has increased output growth in all years, except for 2001
.PNG (30.0 kB) .xls (51.2 kB)
In 2017, the quality adjustment added 0.4 percentage points to the output growth rate. This was a slight increase from quality growth of 0.2 percentage points in 2016 and slightly below the average adjustment across the time series¹ of 0.5 percentage points.
After adjusting for quality, output growth was still slower in 2017 than in 2016, at 2.4% and 3.3% respectively.
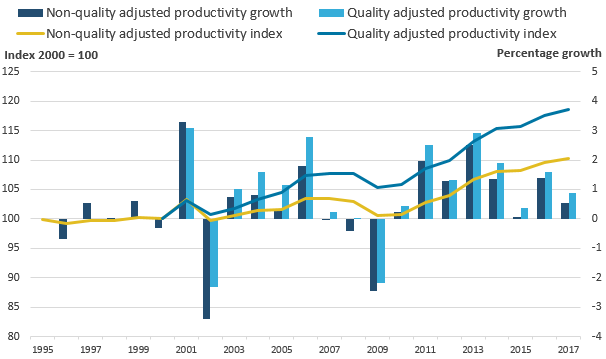
Figure 5: The quality adjustment accounted for 45% of the overall increase in healthcare productivity between 2000 and 2017
Public service healthcare quantity and quality-adjusted productivity indices and growth rates, UK, 1995 to 2017
Source: Office for National Statistics
Download this image Figure 5: The quality adjustment accounted for 45% of the overall increase in healthcare productivity between 2000 and 2017
.PNG (21.9 kB) .xls (39.4 kB)
Figure 5 shows the growth of healthcare productivity with and without the quality adjustment applied, with both series indexed to 2000, the year before the quality adjustment was introduced.
Over the period 2000 to 2017, quality-adjusted productivity grew at an average rate of 1.0% and non-quality adjusted productivity grew at an average rate of 0.6%. Over the whole time series from 1995 to 2017, non-quality adjusted productivity grew at an average rate of 0.5%. However, changes in non-quality adjusted productivity amounted to only a small increase in this measure between 1995 and 2009, with most of the increase happening since 2009.
The gap between the quality adjusted and non-quality adjusted productivity indices shown in Figure 5 has widened steadily over the period. This has occurred because, while the effect of quality adjustment on annual output growth has been small, the quality adjustment has been positive in every year except 2001.
Notes for: Output quality
- Quality adjustment is calculated on data for England only. Figures for the UK may differ from those for England because of the “cubic splining” method used to convert financial year data into calendar years.
7. Revisions
Several methodological improvements have been introduced in this publication, resulting in a substantial revision to average productivity growth over the period 1995 to 2016 relative to the previous release. These improvements include:
- developments to the methodology for deflating goods and services inputs, including the introduction of the NHS Cost Inflation Index
- introduction of NHS bank staff in England into labour inputs from financial year ending (FYE) 2016
- methodological improvements to the estimation of capital consumption
- introduction of a “days adjustment” to account for the effect of year-to-year changes in the number of working days and total days on healthcare output
More information on these changes is available in Methodological developments to public service productivity: healthcare.
There are further revisions to the series because of regular revisions to data sources used and the process used to convert financial year data into calendar years, which can cause small changes to the path of previous years’ growth rates when an additional year is added to the series.
Following these revisions, the average annual growth rate for quality adjusted productivity between 1995 and 2016 decreased by 0.1 percentage point to 0.8% and the average annual growth rate for non-quality adjusted productivity over the same period was revised down from 0.6% to 0.4%. The difference in the size of the revision effect between quality adjusted and non-quality adjusted measures is largely due to rounding, rather than differences in the impact of methodological changes on quality adjusted and non-quality adjusted productivity.
Figure 6: Methodological improvements have resulted in a downward revision in healthcare productivity, reducing total growth between 1995 and 2016 from 21.0% to 17.7%
Growth rate and index for public service healthcare productivity for current and previous publication, UK, 1995 to 2017

Source: Office for National Statistics
Download this image Figure 6: Methodological improvements have resulted in a downward revision in healthcare productivity, reducing total growth between 1995 and 2016 from 21.0% to 17.7%
.PNG (22.4 kB) .xls (40.4 kB)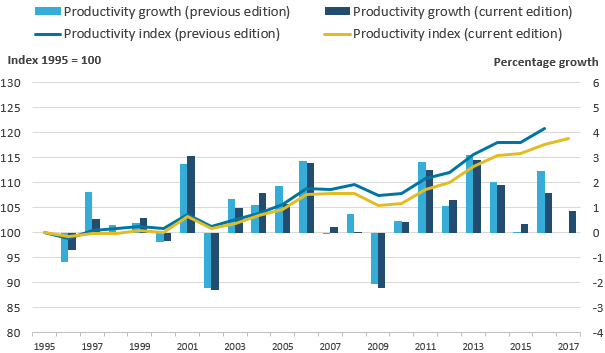
Input revisions
Estimates of capital consumption have been substantially revised following methodological improvements to the estimation of this element in the UK National Accounts that were incorporated in Blue Book 2019. These improvements included reviewing and updating asset lives for non-financial assets such as buildings, and machinery and equipment. Life lengths for the majority of assets have been shortened, leading to an upward revision to the growth rate of capital consumption and the share of overall inputs it accounts for.
Goods and services inputs have been revised because of changes in the methodology used for the deflators, which convert inputs expenditure into a volume measure by accounting for input cost inflation. These changes include the adoption of the new NHS Cost Inflation Index (NHSCII) and changes to the deflation of expenditure on non-NHS providers, general practice goods and services costs, dentistry and ophthalmology and agency staff. These revisions have moved the goods and services index in different directions at different points in the series.
It should be noted that the new NHSCII has been created using data on the goods and services consumed in the NHS in England, but in most cases makes use of whole economy measures of price change in the sorts of goods and services used in the NHS. Further discussion of these caveats can be found in Section 3 of Public service productivity: healthcare, England, financial year ending 2018.
Labour inputs have been revised because of the inclusion of NHS bank staff in England from 2015 onwards. Because of the fast growth in NHS bank staff expenditure in 2016, this has resulted in a substantial upward revision to inputs in 20161. There were also smaller revisions to labour inputs from regular updates of source data for GPs in England and NHS staff numbers in Wales.
Figure 7 shows the combined effect of the changes in data and methodology on the input growth and levels in this year’s publication relative to the previous publication. The revisions generally result in an increase in inputs growth in most years, leaving the level of inputs in 2016 2.0% higher in this publication than in the previous publication, with capital consumption being the leading cause.
Further detail on the revisions to each component of inputs for England is available in Public service productivity: healthcare, England, financial year ending 2018.
Figure 7: Revisions to inputs result in a 2.0% increase in the level of inputs in 2016
Growth rate and index for public service healthcare inputs for current and previous publication, UK, 1995 to 2017

Source: Office for National Satistics
Download this image Figure 7: Revisions to inputs result in a 2.0% increase in the level of inputs in 2016
.PNG (30.7 kB) .xls (40.4 kB)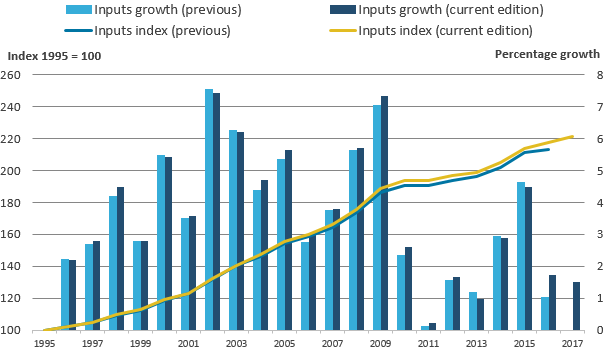
Output revisions
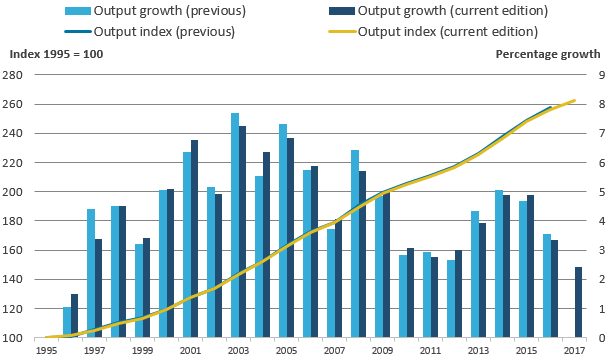
Output has been revised throughout the series because of the introduction of a “days adjustment”, to account for the effect on output of leap years and year-to-year changes in the number of working days because of the position of bank holidays and weekends. The “days adjustment” reflects the fact that leap years and the difference in the annual number of working days can affect the annual output of different parts of the healthcare service; with leap years having a greater effect on urgent care and the number of working days having a greater effect on scheduled treatment and consultations.
The “days adjustment” results in changes to the year-on-year growth rates across the series, but does not affect the long-run trend of output, in so far as the growth rate between any two years with the same number of working days and total days will be unchanged by the “days adjustment”.
The total growth in output across the series has been affected by changes to the deflation of the non-NHS component of output, resulting in slightly more growth over the series of this component of output. However, as non-NHS provided services are measured using the “output-equals-inputs” approach, these changes will have little effect on productivity.
Figure 8: Year-on-year output growth rates have changed across the series following the introduction of the ”days adjustment”, although the average annual rate is only slightly revised
Growth rate and index for public service healthcare quality-adjusted output for current and previous publication, UK, 1995 to 2017
Source: Office for National Statistics
Download this image Figure 8: Year-on-year output growth rates have changed across the series following the introduction of the ”days adjustment”, although the average annual rate is only slightly revised
.PNG (32.2 kB) .xls (41.0 kB)
It should be noted that while the output data are also shared with the UK National Accounts, differences will arise from Office for National Statistics (ONS) public service productivity estimates operating an open revisions policy. This means that new data or improved methods can be incorporated with each release of the public service productivity articles and can be implemented for the entire time series of data. However, we do not yet have a schedule for introducing the “days adjustment” into the UK National Accounts and the deflator methodology changes affecting non-NHS provided output will not affect the UK National Accounts, where the definition of government output differs in a manner that excludes publicly-funded but privately-provided services. This is explained in more detail in Section 11: Comparisons with other measures of output and productivity.
Notes for: Revisions
- The chain-linking methodology used to construct the output and inputs indices means that the indices are constructed from a series of growth rates between consecutive pairs of years. As, a result, where new items are included, such as NHS bank staff in FYE 2016, these do not result in step-changes in the level of inputs or output. More information on chain-linking is available from this methodological note (PDF, 58KB).
8. Public service healthcare productivity data
Public service productivity estimates: healthcare, UK
Dataset | Released 8 January 2020
Public service healthcare growth rates and indices for inputs, quality and non-quality adjusted output and productivity, totals and by components, for UK, 1995 to 2017.
9. Glossary
Inputs
Inputs are resources used to produce healthcare services. Inputs are not the same as expenditure and instead are expressed in volume terms, so an increase in staff pay will not increase inputs, but an increase in staff numbers will. Inputs can be measured directly, such as by cost-weighted staff numbers or indirectly, using appropriately deflated expenditure.
Public service healthcare productivity
Productivity is a measure of the amount of service provided (which can be either quality-adjusted or non-quality-adjusted output) for the quantity of inputs used. “Public service” relates to the fact that all healthcare services paid by the public sector are included in this measure.
Quality adjustment
In line with the recommendations of the Atkinson Review (PDF, 1.08MB), a quality adjustment is applied to the estimate of healthcare quantity output to control for the success of the service in meeting selected outcomes. For more information Quality adjustment of public service health output: current method (PDF, 152KB).
Quantity output
The quantity of output is the amount of healthcare services provided and is mostly measured using the number of healthcare activities performed, weighted by the cost of each activity.
Weighting
Weighting refers to the relative importance of changes in individual inputs or output components to changes in the overall inputs or output index. The weight assigned is usually based on cost and so, for example an increase of one hip replacement will have a greater effect on output growth respectively than one outpatient consultation.
Nôl i'r tabl cynnwys10. Measuring the data
Quality and methodology
More quality and methodology information on strengths, limitations, appropriate uses, and how the data were created is available in the Public service productivity: healthcare QMI.
Acknowledgements
The authors of this article are Narcisa Florea and James Lewis. The authors would like to thank Adriana Castelli, James Gaughan and Idaira Rodriguez Santana from the University of York for the provision of quality adjustment data and comments, and colleagues from the Department of Health and Social Care, NHS England and NHS Improvement, NHS Wales, Northern Ireland Executive, Scottish Government and Welsh Government: Sharon Allen, Fiona Boyle, Alastair Brodlie, Cathy Costello, James Gordon, Zareen Khan, John Morris, Paudric Osborne, Robert Scott, Bethan Sherwood, Joel Solway and Duncan Watson for the provision of output and input data and comments.
Nôl i'r tabl cynnwys11. Comparisons with other measures of output and productivity
No single productivity measure is definitive and productivity measures cannot alone provide a perfectly comprehensive view of service efficiency, as they do not indicate whether the inputs have been purchased at the lowest possible cost, or whether the desired outcomes are achieved through the output provided.
The productivity statistics published in this article are based on a concept of output as measured by government consumption expenditure rather than government or state production. This follows from the submission of the estimates of the volume of government output that are used in this article (prior to any quality adjustment) to the gross domestic product (expenditure) (GDP (E)) side of the UK National Accounts. This means that we are using a measure of government-purchased output, regardless of what type of business unit produced the output. As with other aspects of the methodology employed in producing these statistics, this approach is consistent with that recommended by the Atkinson Review (PDF, 1.08MB).
In the case of healthcare, although most expenditure is used to fund state providers of healthcare services and its administration, there is a growing component of expenditure on private and third sector-provided healthcare services. This is included within government output in our articles, even though it is provided by business units that are classified as private businesses or non-profit institutions serving households (NPISH) in the UK National Accounts, and this is why the term “public service” is used instead of “public sector”.
Traditional measures of private sector or whole-economy productivity, including those published by the Office for National Statistics (ONS), use a supply or production framework. These measures of productivity use Standard Industrial Classification (SIC 2007) categories of production as the measure of output and are on a gross value added (GVA) basis. Input measures count the labour (jobs or hours) used in the production of these goods and services to estimate labour productivity series such as those produced by the ONS. We also produce Experimental Statistics on market sector multi-factor productivity, which include labour and capital services as inputs.
The interpretation of the expenditure-based productivity estimates presented in this article should therefore be taken as a measure of the productivity of government-funded healthcare services for individuals in the UK (from whatever type of business unit), and not necessarily government-provided services. Caution should be used when considering the differences between productivity measures published using GVA-based measures of output, such as the ONS’s labour productivity statistics, and the gross output approach used in these public service productivity statistics.
More information on the difference between these two approaches is available in a paper we published in June 2015: Comparing public service productivity estimates.
Nôl i'r tabl cynnwys