1. Main points
Alternative methods reduce estimated annual hours worked in the UK by 8%, compared with the Office for National Statistics’ (ONS's) published estimates, using standardised adjustments to annual leave, sickness and maternity leave from a panel of countries.
We are developing a new method, using UK-specific data to produce estimates of annual hours per worker in the UK, which will be more consistent with national accounts concepts.
We plan to recommence the international comparisons of productivity (ICP) annual bulletin in 2021, in a way which better communicates the inherent uncertainty in ICP estimates.
We aim to collaborate further with international partners to develop a common framework of labour input measurement to allow comparisons on a more consistent basis.
2. Overview
This article provides an update on our work to review and improve the methodology used to estimate hours worked in the UK for productivity analysis, and to explore how international comparisons of productivity could be carried out on a more comparable basis. It follows our previous article on the measurement of labour inputs and international comparisons, which gives important context to this work.
International comparisons of productivity require estimates of each country’s output (gross domestic product, GDP), and labour inputs (total hours actually worked in all jobs in the economy), as well as a means, such as purchasing power parities (PPPs), to remove the effect of differential changes in prices between countries. It is necessary for all these metrics to be measured on a consistent basis to deliver a true international comparison.
In this article we focus on the international comparability of hours actually worked per worker. However, there may also be potential comparability issues in the other components of productivity. For example, see Section 7 of International comparisons of GDP during the coronavirus (COVID-19) pandemic for a discussion of GDP measurement. Productivity’s reliance on several different measures leads to inherent uncertainty in all international comparisons of productivity.
For productivity estimates, the labour input needs to be consistent with GDP, the output measure. This presents a challenge because GDP is a national accounts concept, while labour market metrics are produced against standards maintained by the International Labour Organisation (ILO). While the National Accounts and ILO definitions of actual hours worked are aligned, the two frameworks differ in some important areas, including the production boundary, and these differences require adjustments to align the labour input measures with national accounts concepts.1
Responding to these difficulties, the Office for National Statistics (ONS) partially funded an Organisation for Economic Co-operation and Development (OECD) working paper: International productivity gaps: Are labour input measures comparable? to investigate the comparability across countries of labour inputs used in productivity analysis. The paper concluded that there is wide variation in the sources used to estimate labour inputs internationally, and also a range of common adjustments applied to bridge from the source data to national accounts concepts. This is discussed in more detail in our previous article, Improving estimates of labour productivity and international comparisons.
The OECD paper applied a 'simplified component method (SC)' to the EU member states and a small number of other countries, using European Union Labour Force Survey (EULFS) data, to estimate average annual hours actually worked per worker across countries on a consistent basis.
In this article we extend our previous article’s discussion of the OECD paper’s results by exploring the implications of the SC method on the UK’s estimates. We then discuss work currently in progress to develop a UK-tailored component method, which builds on the SC approach to develop a method for estimating hours worked in the UK for productivity analysis. Finally, we explore future steps to improve the comparability of international comparisons of productivity.
Notes for: Overview
- Data sources on total hours actually worked in all jobs in the System of National Accounts (SNA) production boundary are not readily available. This is why we use separate series of hours worked and workers employed to produce labour input estimates for productivity measures, while ensuring they are aligned with national accounts concepts, rather than the headline ONS national statistics.
3. Simplified component method results
Organisation for Economic Co-operation and Development (OECD) paper findings
Figure 1 is a reproduction of Figure 4.1 from the OECD’s International productivity gaps working paper. It depicts estimates of average annual hours per worker according to three different methods:
- National Accounts: each country’s own published estimates consistent with National Accounts, produced using their own sources and methods (yellow diamonds)
- LFS simplified component (SC): a methodology developed by the OECD which estimates annual hours worked for all countries based on usual hours plus component adjustments from the European Union LFS, using common adjustment factors across all counties, with a small number of further adjustments applied to all countries (dark blue diamonds)
- LFS direct: estimates using actual hours from the Labour Force Survey with no further adjustments (green bars)
Figure 1: On average, countries using the direct method have higher estimates of hours worked than countries using the component method
Average annual hours worked per worker; LFS-based direct method, LFS based simplified component method and official national accounts, 2016

Source: The Organisation for Economic Co-operation and Development (OECD)
Notes:
Figure 1 is an adaptation of Figure 4.1 in the OECD’s working paper, reproduced with the author’s permission.
As stated in the working paper, the OECD’s SC method is explicitly a second-best option to component methods calculated at a national level in country’s official statistics using country-specific data. The SC method is used by the OECD only to substitute official direct method estimates where the necessary data are available.
The OECD has since confirmed Ireland has changed its methods to use a component method.
Download this image Figure 1: On average, countries using the direct method have higher estimates of hours worked than countries using the component method
.PNG (113.6 kB)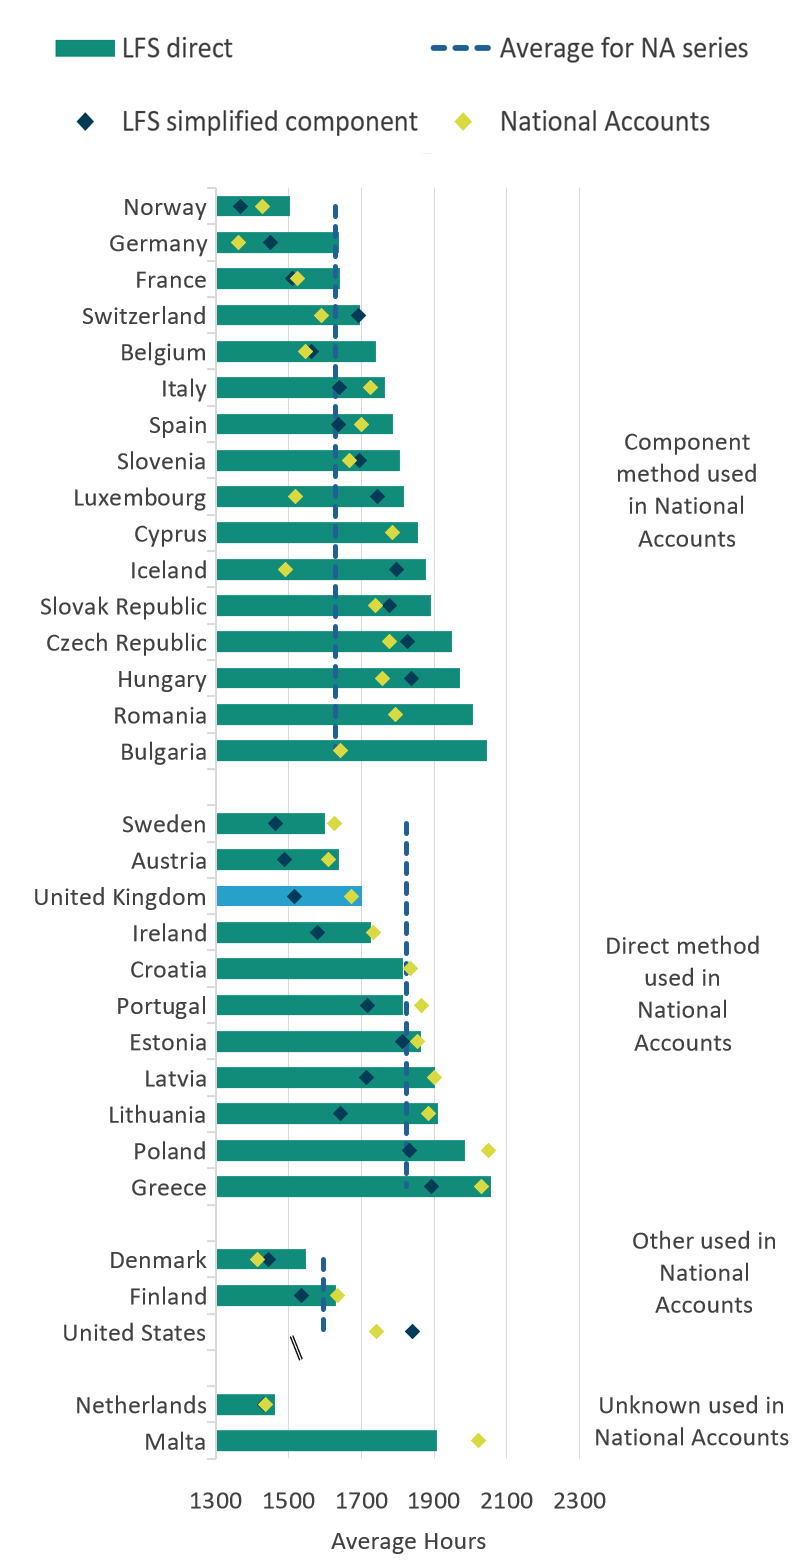
Figure 1 illustrates that national accounts estimates of hours worked for countries using the direct method without adjustments are consistently higher than the simplified component (SC) method estimates, while the national account estimates for countries using the component method have no clear relationship with the SC method estimates.1
This suggests that the direct method may over-estimate annual hours worked, compared with component methods. In Figure 1 the UK is one of 11 countries2 using the direct method without further adjustments – the OECD has since confirmed Ireland has changed its methodological approach.
The data also indicates that compared with the national accounts estimates, universal use of the SC method would bring the UK’s hours into closer alignment with other comparator countries. For example, using national accounts estimates, annual hours worked per worker in 2016 were 310 hours higher in the UK than in Germany, causing a considerable impact on comparative rates of productivity. However, when the simplified component method is used for both, the UK’s annual hours were considerably lower (by 9.4%) and Germany’s were higher (by 6.4%), reducing the difference in annual hours to 65 hours. Consistent use of the SC method would reduce the difference in hours worked between the UK and Germany by 245 annual hours, or 4.7 hours a week.
However, a blanket application of the SC method may not be the best mechanism to provide comparable estimates. For example, Germany makes a series of adjustments to their data to derive the current national accounts estimates, taking advantage of country-specific sources and knowledge. It is important to consider the methodological rationale for such adjustments, and what empirical evidence and data is applied to calculate these adjustments for each country.
The evidence that the direct method over-estimates annual hours worked, and the large reduction in the hours gap between the UK and comparable countries from using the SC method, together provide the impetus for us to develop a similar improved methodology for the UK using UK-specific data. This would enable us to compare against other countries on a number of different like-for-like approaches: direct against direct, SC against SC, tailored adjustments against tailored adjustments. Comparisons undertaken on different bases, such as direct against tailored adjustments, appear to lead to inconsistent results and a dataset that is hard to interpret.
To proceed in this direction, it is important that we understand both the data used for the UK in the SC method and whether there may be tailored adjustments using more UK-specific data we could make to our estimates of hours worked, which could align UK estimates more closely with national accounts concepts, as in other countries.
Notes for: Simplified component method results
The direct method annualises the average weekly hours worked directly collected from the data source, usually a continuous labour force survey, for all weeks of the calendar year. The component method starts with data on normal, usual, paid or contractual hours, and a series of component adjustments are applied using a variety of data sources to move to the target concept of annual hours actually worked. Some countries use the direct method with additional adjustments, and they are counted as using the component method for this comparison.
The latest list of countries using the direct method: Austria, Croatia, Estonia, Greece, Latvia, Lithuania, Poland, Portugal, Sweden, United Kingdom.
4. Latest simplified component method results for the UK
Compared with the direct method, the simplified component (SC) method produces a lower estimate of annual hours worked per worker in the UK. In 2019, the SC method estimate was 1,538 annual hours worked, compared with 1,668 hours from the direct method; a difference of 130 hours a year, or 29.6 compared with 32.1 hours a week.
Our preferred measure of labour productivity, output per hour, is calculated by dividing gross value added (GVA) or gross domestic product (GDP)1 by hours worked. Therefore, the simplified component method’s lower estimate of hours reduces the size of the denominator, resulting in an equivalently higher estimate of labour productivity.
However, while there is a considerable difference in the level of hours, the effect on growth rates is minimal. Figure 2 shows the UK’s hours worked per worker each year according to each method between 1995 and 2019.
Figure 2: Between 1995 and 2019, the direct method and simplified component method estimates of hours worked followed very similar paths
Annual hours worked per person in employment, 1995 to 2019, UK
Source: Direct method estimates are from the ONS; simplified component method estimates are from the OECD
Notes:
- Between 1995 and 2019 average annual hours in the direct method series decreased by 52 hours; in the component method series they decreased by 55 hours over the same period, demonstrating the similarity in growth rates.
Download this chart Figure 2: Between 1995 and 2019, the direct method and simplified component method estimates of hours worked followed very similar paths
Image .csv .xlsTo summarise, the difference between the direct method (currently in use; blue line) and the SC method (green line) in the UK is a difference of levels, but with little impact on growth rates.
Further work has been carried out to understand the source of the difference in hours observed in Figure 2. The direct method uses the actual hours from the Labour Forcey Survey (LFS) directly, while the SC method uses European Union Labour Force Survey (EULFS) data that contains harmonised data derived from each country’s LFS responses. The methods also take alternate approaches, using different variables drawn from the LFS: the direct method asks how many hours were actually worked, while the simplified component method asks first how many hours are usually worked, and then whether the hours actually worked in the latest week were different from usual and why. The Labour Force Survey user guidance volume 2 has details of the question phrasings in the UK’s LFS.
The use of usual hours and component adjustments has little to no impact on the final hours estimate, because in cases where actual and usual hours are different and an adjustment is made, the size of the adjustment is equal to the difference between actual and usual hours. Instead of changing the total, the alternate routing breaks down average actual hours into average usual hours, plus adjustments for factors like annual leave and sick leave, which sum to the same total.
The primary reason why the SC method has lower estimates for annual hours worked is because the Organisation for Economic Co-operation and Development (OECD) makes further adjustments to the components of annual leave, maternity leave, and sickness leave, after adding hours worked in additional jobs to account for hours worked in all jobs. The SC method makes these adjustment to each countries’ estimates and to the components derived from the EULFS.
Annual leave adjustment
If a household in the LFS is unavailable for interview but was interviewed in the previous wave, responses from the previous wave are rolled forward for one wave. This is referred to as imputation, and it is carried out to minimise non-response bias on the rationale that most LFS variables do not change from one quarter to another for most people. Data are not rolled forward after a second consecutive non-response.2
The OECD reasoned that when it comes to taking leave this is not a value-neutral assumption. If non-response was uncorrelated with hours worked, this forward imputation would not affect estimates of hours worked. However, people on holiday are disproportionately likely to be unavailable for interview, for example if they travel instead of staying at home, leading them to not respond.
For respondents who are unreachable because they are on holiday, the survey rolls forward their response from the previous quarter, which is likely to reflect a normal working week. This results in a potential under-estimation of annual leave taken, and equivalent over-estimation of annual hours worked.
Identifying this issue, the SC method uses collectively agreed holiday entitlements from Eurofound. This assumes all employees take all the leave they are entitled to, and it does not account for those in flexible working arrangements who aren’t entitled to collectively negotiated periods of leave. They replace the LFS-derived estimate of annual leave with the Eurofound-derived estimate, and the result is a reduction in estimated annual hours worked of around 100 hours.
Maternity leave and sick leave adjustments
Based on unpublished historic comparisons of LFS sickness leave estimates with data from other sources, the OECD estimates that the direct method under-reports both maternity and sickness leave by around 50%. To compensate, the SC method doubles the size of the contribution of these components for all countries, compared with the values derived from the EULFS. In the case of the UK, estimated annual hours worked decrease by a further 60 hours.
These findings suggest the difference between the UK’s direct method and SC method estimates is not caused by whether average hours worked is derived directly from the 'actual hours' question of the LFS or indirectly through the 'usual hours' question plus component adjustments. Rather the important factors are the further adjustments made to the total arrived at through the LFS.
Breaking down actual hours into usual hours and component adjustments makes it possible to compare the size of each component derived from the LFS with estimates from other sources, and make adjustments to individual components. The SC method makes such adjustments to annual leave, maternity leave and sickness leave based on data available to all countries. Section 5 describes potential ways we could make more accurate adjustments to components in the UK using domestic sources.
Notes for: Latest simplified component method results for the UK
GVA is normally used for productivity estimates but GDP is a close proxy that is more readily available for timely international comparisons.
See the LFS user guidance volume 1, Section 12.1, and the LFS Quality and Methodology Information (QMI) Section 5.
5. A UK-tailored component method
First steps
To produce comparable estimates to other countries, the UK needs to assess which adjustments should be applied, using all available data sources to align with national accounts and address any biases.
To do this, we have begun work to develop a proof of concept for a UK-tailored component method, making use of the full range of available sources in the UK to find the best estimate for each component adjustment, and to align the resulting estimate as closely as possible with national accounts concepts. If successful, the intention is for this measure to eventually be used for all productivity estimates at the Office for National Statistics (ONS), and potentially to be used in national accounts.
Unlike the simplified component (SC) method which uses the European Union Labour Force Survey (EULFS), the UK-tailored component method will use the UK’s Labour Forcey Survey (LFS) in the short-term. Further decisions on data sources will be dependent on wider work to explore and understand the potential of other data sources and improved surveys to fill this role. Additional sources will be used to triangulate individual component and make further scope adjustments.
The first step is to develop a component breakdown modelled on the SC method, to understand the difference between actual and usual hours worked in the LFS. Each respondent whose actual and usual hours differ is asked to choose from a list of reasons why they worked more or fewer hours than usual. Their responses can be used to isolate the impact of each specific reason on actual hours, and express these impacts as a series of component adjustments.
In this way, the direct estimate of actual hours from the LFS can be broken down into usual hours and a series of component adjustments.
Provisional findings
Figure 3 shows the size of each component adjustment made in the move from usual hours to annual actual hours. These results are based on all persons in employment in 2019, derived from the LFS with no further adjustments.
Figure 3: The largest component adjustment is for other leave/holiday, followed by varing work hours and sick leave
Component adjustments from usual to actual hours in the Labour Force Survey (LFS), percentage of usual hours, 2019, all persons in employment, UK
Source: Office for National Statistics - Labour Force Survey
Notes:
- These results are a work in progress, and the specific values are likely to change so they are indicative only.
Download this chart Figure 3: The largest component adjustment is for other leave/holiday, followed by varing work hours and sick leave
Image .csv .xlsCollectively these adjustments break down the annual difference between actual hours worked and usual hours worked, as reported in the LFS with no further adjustments. In 2019 the total adjustment from usual to actual hours, including second jobs, is 221 hours, or 12% of usual hours. By quantifying each component adjustment, we can identify the most impactful components for estimates of hours worked, and hence for international comparisons of productivity.
Based on this break down, the most important component is other leave or holiday, followed by varying work hours or overtime, sick leave, and maternity and paternity leave. These are the main component adjustments to explain the difference between actual and usual hours in the LFS. Their large impact implies they will be the most important components for a UK-tailored component method to triangulate with additional sources. Other components, like labour disputes and bad weather, have only a small impact and are likely to be less important.
Nôl i'r tabl cynnwys6. Future developments: The UK-tailored component method
Replicating the analysis explained in Section 5 for multiple periods will allow the creation of a time series, allowing us to check whether the leading factors remain constant through time. We will separate out the results for employees and the self-employed as well as a whole-workforce aggregate. It will also be on a quarterly basis, to enable eventual integration into our quarterly productivity statistics. Once this stage is complete, the next step is a scoping exercise to identify the main potential adjustments needed and which data sources could be used. These adjustments fall into two main categories:
- adjustments to components
- other adjustments
Adjustments to components
Once the individual component adjustments have been isolated, it is possible to triangulate the size of each adjustment using additional sources.
As discussed in Section 4, the simplified component (SC) method’s adjustments to annual leave, maternity leave and sickness are the main drivers of the gap between the SC method and direct method estimates for the UK. These components are particularly important both because they lead to large adjustments in hours, and because they are areas where there is reason to believe there is bias.
The SC method currently uses Eurofound holiday entitlements and a 50% assumed under-estimation of maternity leave and sickness leave, applied to all countries. We are exploring using UK-specific sources to arrive at more accurate adjustments to these components.
Even when there is no reason to doubt the Labour Force Survey (LFS)-derived components, additional sources can be used to triangulate the size of each component, increasing our confidence in our estimates or leading us to adjust them as needed. The additional sources used could be administrative data, business surveys, new emerging data sources, academic studies, or even other variables from the LFS. For example, there are dedicated questions on sick leave that currently aren’t used in this methodology.
Other adjustments
Where the component adjustments address potential bias in LFS reporting, these other adjustments aim to explicitly align the measurement of hours worked with national accounts concepts, for consistency with gross value added (GVA). The adjustments needed will depend on the main source used, so they necessarily vary across countries.
In the UK, estimates of hours and jobs for productivity statistics are adjusted to include the military, which are outside the scope of the LFS, using data from the Ministry of Defence. (See the Labour productivity QMI Section 6.) The hours and jobs estimates used in productivity, but not in published labour market statistics, also use additional information to match the workforce to industries on a reporting unit basis, which is more consistent with national accounts. However their totals are constrained to the labour market totals, so this has no effect at the whole-economy level.
An important issue for the UK is that LFS coverage (aligned with International Labour Organization (ILO) concepts) is based on household residency in the geographic territory, where labour inputs (aligned with national accounts concepts) should be aligned with the employer’s residency in the economic territory. Measurement of labour inputs consistent with national accounts therefore requires a conceptual adjustment from resident households to those in employment working for resident institutional units; and an adjustment from the geographic territory to the economic territory.
We currently do not make adjustments in a number of areas.
Border workers
Workers who work in one country but reside in another, such as those who live in the UK but work in a country other than the UK. These workers will be captured by the LFS, but should not be included in the labour input for productivity estimates. Similarly those working in the UK but living outside it will not be captured by the LFS, but should be included.
Territorial enclaves
Territorial enclaves are clearly demarcated land areas located in other territories which are used by governments that own or rent them, for example embassies, consulates, military bases, scientific stations, and so on. Workers who work in territorial enclaves are not captured by the LFS, but they should be included in our estimates of labour inputs for productivity estimates.
Unobserved economy
Unobserved economy such as illegal activities like the drugs trade, business activity that goes unreported to avoid tax liabilities, and cash-in-hand payments in the informal sector. While this activity is captured in measures of output in the national accounts, LFS respondents may not fully reveal this information in an interview, so hours worked in these areas are under-reported.
Other adjustments
There are other adjustments made by some countries to align with the System of National Accounts (SNA) production boundary by including groups out of scope of the main source; for example, working students, working prisoners, own-account production of goods, and so on.
There is a list of common categories of adjustments made to labour inputs, in Box 2.2 of the OECD working paper. Having identified these potential inconsistencies between the input and output measures used to calculate productivity, we will look for adjustments to estimates of hours worked to improve their consistency with the coverage of output measures. The next step is a scoping exercise to identify which adjustments are needed and which sources are available.
Nôl i'r tabl cynnwys7. Future developments: international comparisons of productivity
While the UK-tailored component method could improve labour input estimates for estimating productivity in the UK by ensuring better data alignment with national accounts, it will not entirely solve the problem of international comparability. There is still wide variation in the sources, methods and adjustments used across countries, which makes it difficult to arrive at a single set of comparable estimates. Table 1 of our Improving estimates of labour productivity and international comparisons article gives more detail on the sources and adjustments used across the G7, and the resulting variation in estimates can be seen in Figure 1.
For this reason, we consider that a more sophisticated method needs to be deployed which reflects these differences.
An ideal system for comparing labour inputs internationally would be robust enough to enable consistency of estimates, but flexible enough to allow each country to make full use of its own sources, enabling the production of high quality estimates that are comparable with one another.
This system could take the form of a framework or a manual, taking account of lessons learned in different countries, explicitly laying out which adjustments need to be made to align with national accounts concepts from any given type of source, and the adjustments needed to account for known limitations of each source. It could also identify which data sources or types of source are likely to be most effective for each adjustment. Countries would then apply this framework to their own data sources.
As a first step, we will look to collaborate with our international partners to begin exploring the feasibility of such a system. However, this is likely to be a long-term endeavour, so it does not offer an immediate solution to the publication of international comparions of productivity.
In the short term we will also explore how we can improve the way we can communicate the challenges in these international comparisons. There are several degrees of uncertainty in international comparisons of productivity (ICP), because it relies on consistent measurement of hours worked and employment, but also of gross domestic product (GDP) and reliable purchasing power parities. This means point estimates, such as those previously published in our ICP bulletin, may present spurious accuracy, potentially giving users false confidence in the precision of the results.
One possibility is using ranges, to acknowledge the ambiguity inherent in ICP. They may present a better balance of giving an informative international picture while recognising the degree of uncertainty. While we do not have unlimited resources, or the expertise to calculate source data for every country, it may be possible to estimate a plausible range for each country compared with the UK by exploring the different methods and data published by different countries for labour inputs, output measures, and purchasing power parity (PPP) estimates. This approach would emphasise the longer-term trends between countries. We will discuss this approach in more depth in future releases.
We will work closely with our international partners to understand their measures and data in more detail, in an effort to build a more informed and comprehensive picture. We will explore the data needed to estimate these ranges around each country’s productivity estimates, and aim to recommence publication of ICP in 2021.
We welcome views from users on this proposed way forward. Please contact us at productivity@ons.gov.uk. In particular we welcome views on potential data sources to inform the component adjustments to the UK-tailored component method; on recommencing the ICP publication later this year in a way that better reflects the uncertainty of comparison; and on the merits of an international framework for measuring labour inputs for productivity comparisons.
Nôl i'r tabl cynnwys8. Glossary
Component method
A method of estimating hours worked which starts with normal, usual, paid or contractual hours and then moves to the concept of hours actually worked through a series of explicit adjustments called components, such as annual leave or maternity leave.
Direct method
A method of estimating hours worked which annualises average weekly hours worked directly collected from the data source, usually a continuous labour force survey, for all weeks of the calendar year.
European Union Labour Force Survey (EU-LFS)
A European Union-wide household survey capturing data about the labour market. It is collated by harmonising responses to the national Labour Force Survey of each member state.
Labour Force Survey (LFS)
The UK’s Labour Force Survey is a continuous quarterly household survey which captures data about the labour market including employment and hours worked. Many countries have their own Labour Force Surveys.
Simplified Component Method (SC)
A method for estimating hours worked developed by the OECD, which uses EU-LFS data for each country. It is designed to illustrate the variation in sources and methods across countries, and is a second-best to national efforts that make use of all available sources.
Nôl i'r tabl cynnwys