1. Acknowledgements
We are grateful for comments received on earlier versions of this article from Mary O’Mahony (King’s College London) and Dan Mawson (Department for Business, Energy and Industrial Strategy).
Nôl i'r tabl cynnwys2. Main points
- New, experimental production-side purchasing power parity (PPP) exchange rates have been published by Eurostat, which enable a more detailed analysis of the UK’s “productivity gap” with other leading economies by industry.
- UK labour productivity was 15.4% below the average for the other G7 advanced economies on an output per worker basis in 2016, and 15.1% below on an output per hour worked basis.
- The UK’s aggregate productivity gap to other leading European economies is replicated at the industry level in 2014 – although the size of the gap varies.
- While the UK’s level of labour productivity by industry is weak relative to the other large European economies according to these estimates, it experienced relatively strong growth in labour productivity between 2014 and 2016.
3. Introduction
The persistent weakness of UK labour productivity relative to other countries is one of the key features of the UK economy. This gap is the subject of the International comparisons of productivity release, which indicates that UK labour productivity was 15.4% below the average for the other G7 advanced economies on an output per worker basis in 2016, and 15.1% below on an output per hour worked basis. While the size of this gap has varied through time, it is remarkably persistent. In 1997, for instance, the UK’s gap to the G7 was 14.5% and 11.7% on an output per worker and per hour basis respectively. More analysis of these headline results can be found in the main release.
The long-standing nature of this productivity gap has generated significant policy interest, but analysis to explain it depends on the availability of comparable data across countries and appropriate exchange rates. Policy-maker and researcher interest in productivity differentials is motivated by the potential for “catch-up”, as the stronger (or weaker) productivity performance of one economy may suggest policy lessons for another. Typically, work carried out in this area uses data on gross domestic product (GDP) or gross value added (GVA) – the measurement of which is governed by international statistical regulation – adjusted using purchasing power parity (PPP) exchange rates, and a comparable measure of labour input to estimate labour productivity across countries at either the whole economy or industry level.
Among the principal challenges of this work is the use of PPP exchange rates. These are typically derived for the “expenditure side” of GDP, and consequently relate the power of a unit of one currency to purchase final demand in terms of another. While this is appropriate for analysis at the whole economy level, an alternative formulation – building PPPs from the “production side” – is recognised as being more appropriate for analysis of labour productivity at the industry level (Eurostat-OECD, 2012). Although work in this area is limited, new, experimental production-side PPPs for 2014 have recently been published by Eurostat in Olislager and Konijn (2016)1.
This short article uses these new production-side PPPs to present annual estimates of labour productivity for 29 European countries on a nine-industry breakdown. These estimates are principally for 2014 as this is the year for which the new PPPs are calculated, but there is also some limited analysis of growth rates between 2014 and 2016 by industry and country. Comparability is achieved using estimates of gross value added (GVA) and labour inputs by industry from a common source (Eurostat) and by converting Euro-based GVA using price level indices (PLIs) from Olislager and Konijn (2016). The estimates presented here are experimental, and we welcome user feedback on their use and usefulness.
Notes for: Introduction
- Olislager, L. and Konijn, P. 2016. ‘Eurostat Review on National Accounts and Macroeconomic Indicators’
4. Methods and data
Work to compare the levels of labour productivity in different countries typically uses data on gross domestic product (GDP) or gross value added (GVA), a set of purchasing power parity (PPP) exchange rates and multi-country information about labour input. To ensure comparability, data are usually extracted from international sources – often from the Organisation for Economic Co-operation and Development (OECD) or Eurostat databases which contain these variables. The GDP or GVA estimates are converted to a single currency using the PPP exchange rate, and then divided through by a comparable labour measure – usually hours, jobs or workers. In the Office for National Statistics' (ONS') headline International comparisons of productivity release, these data are drawn from the OECD and this methodology is applied to estimate whole economy labour productivity in a range of countries.
Purchasing power parities
With notable exceptions (see EU KLEMS 2007, Timmer, Ympa and van Ark 2007, Mason, O’Leary, O’Mahoney and Robinson 2008, Inklaar and Timmer 2012), researchers typically use PPP exchange rates which are based on the “expenditure side”. The methodology for the calculation of these PPPs is set out in Eurostat-OECD (2012). This involves comparing the prices of similar products in each bilateral pair of economies, before weighting these product-level PPPs by their respective shares of total expenditure. Further adjustments are made to ensure that these bilateral indices are internally consistent at the multi-lateral level. The resulting PPP exchange rates capture the amount of each currency which is required to purchase a common basket of goods and services, which in turn enables the conversion of the total expenditure of an economy in domestic currency units into a common international currency1.
While these expenditure-based PPPs are suitable for cross-country comparisons, they are limited in their usefulness for productivity analysis. Expenditure-side PPPs enable the estimation of comparable whole-economy GDP or GVA in a common currency, and therefore allow researchers to calculate the relative levels of whole economy labour productivity. The price base of expenditure-side PPPs is purchaser prices which include imports, exclude exports, and include trade and transport margins and net taxes – that is they are appropriate for the conversion of GDP at market prices. However, industry-level GVA is calculated at basic prices. Therefore, traditional expenditure-side PPPs are not the appropriate exchange rates for the conversion of industry-level output: for this, production-side PPPs – which compare the relative prices of the output of different industries – are required. The expenditure-side PPP exchange rates strictly enable a comparison of the purchasing power of the value generated by the whole economy and have no industry dimension. By contrast production-side PPPs enable a comparison of the relative levels of output generated by an industry across countries in a common currency.
Production-side PPPs have historically proved considerably more difficult to construct, partly owing to data availability. Olislager and Konijn (2016) describe the method by which they have calculated PPPs for the production side of GDP. Their estimates are generated solely using official European Datasets. In particular, they draw detailed estimates of product-level prices from the production industries using the Production of the European Community (PRODCOM) survey (based on unit values – see limitations section); they use data from the established PPP programme for a number of products and draw GVA weights by industry from Eurostat’s national accounts and structural business survey statistics. This mixture of consumer prices and producer prices allows for a high coverage of activities contributing to GDP, enabling an extensive industry breakdown. Estimates of PPPs in this work cover 31 European countries: the EU282, Switzerland, Iceland and Norway.
These PPPs enable analysis of productivity differences across countries at the industry level, and can therefore identify whether the UK’s productivity gap affects all industries equally, or if it varies across industries. Consistent with the original paper, we use price level indices (PLIs) to create comparable GVA measures across countries. PLIs are the ratios of PPPs to market exchange rates and provide a comparison of countries’ price levels relative to the EU average. For a more detailed description of the methodology underlying the estimation of these PPPs, refer to Olislager and Konijn (2016).
Output and total hours
In an effort to minimise the risk of introducing other inconsistencies, we follow the original authors and use GVA and hours worked data from Eurostat. GVA in current prices is the measure used for the calculation of productivity in 2014, which is drawn from Eurostat’s 'Gross value added and income by A10 industry breakdowns' dataset. In light of the recent updates to the UK National Accounts, which at the time of release were not yet reflected in Eurostat datasets, we have used ONS GVA data for the UK appropriately adjusted using the market exchange rate4. The companion labour metric for the calculation of output per hour is total hours, which comes from Eurostat’s 'Employment by A10 industry breakdown dataset. For the calculation of growth rates between 2014 and 2016 we use chain linked volume (constant price) GVA, from the same dataset as current price GVA. Differences in the methods and data employed in this article limit the comparability of these results with our headline International comparisons of productivity release: see the limitations section.
The operation used to calculate our output per hour measures across countries can be detailed formally as below:
Country and industry breakdown
Estimates are presented for 29 European countries – the EU28 excluding Malta and with the addition of Norway and Switzerland. As PLIs for non-European countries are not available the non-European G7 (Japan, Canada and the USA) have not been included in this analysis. These PLIs are available at the A64, A21 and A10 categories of industries. However, given the experimental nature of these estimates we have focused on the high level industry groups (A103). It is worth noting that the picture underneath some of these industry groupings may be substantially more variable.
Notes for: Methods and data
This is a considerable simplification and users interested in acquiring a more detailed understanding are urged to review Eurostat-OECD (2012). In overview, the process involves several steps. Firstly, the prices of products which are deemed “representative” of a defined product group – known as Basic Headings – within an economy are averaged and then compared across countries. The Basic Heading group is defined as the level below which product-specific weights are not computable. Consequently, Laspeyres, Paasche and Fisher-type indices are calculated for each bilateral Basic Heading comparison, which form the inputs to subsequent stages. Second, the PPPs are adjusted to be internally consistent at the multilateral level to ensure they are complete and transitive across countries. Third, the resulting Basic Heading PPPs are separately aggregated using shares of total expenditure in both countries and averaged. Fourth, a further set of adjustments are made at the headline level to ensure their transitivity.
The 28 EU member states known as the EU28 consist of: Austria, Belgium, Bulgaria, Croatia, Republic of Cyprus, Czech Republic, Denmark, Estonia, Finland, France, Germany, Greece, Hungary, Ireland, Italy, Latvia, Lithuania, Luxembourg, Malta, Netherlands, Poland, Portugal, Romania, Slovakia, Slovenia, Spain, Sweden and the UK.
The 10 industries in this section are: Agriculture, forestry and fishing (A), Production (B-E), Construction (F), Wholesale and retail trade, transport, accommodation and food service activities (G-I), Information and communication (J), Financial and insurance activities (K), Professional, scientific and technical activities; administrative and support service activities (M-N), Public administration, defence, education, human health and social work activities (O-Q), and Arts, entertainment and recreation; other service activities; activities of household and extra-territorial organisations and bodies (R-U). Real Estate (L) is excluded as the numerator (GVA) includes the imputed rentals of owner-occupiers – which has no equivalent labour input metric.
In order to ensure this methodology would be appropriate we tested it using the previous vintage of ONS data. Converting the previous vintage of ONS pound sterling (£) figures into Euros (€) using the market exchange rate – as calculated by the ratio of GVA (£) to GVA(€) in the Eurostat dataset – we were able to replicate the Eurostat GVA (€) figures.
5. Limitations
The experimental nature of these data means that caution is advised when interpreting the results. This is set out in Olislager and Konijn (2016), who argue that while their results are promising, more work remains to be done. Several limitations should be considered by users.
Firstly, the experimental nature of the methods and data used in this research note limits the consistency of these data with those published elsewhere. In particular, the use of production-side purchasing power parity (PPP) exchange rates, an alternative source for hours; and gross value added (GVA) in place of gross domestic product (GDP) mean that the results presented here may differ from those in the headline ONS International comparisons of productivity release. The use of alternative data sources means that the industry-level productivity data published here are not directly comparable with ONS’ headline measures of labour productivity. The results in this release also differ slightly for some countries from those published in Olislager and Konijn’s (2016) paper as a consequence of revisions to Eurostat’s total hours and GVA data.
Secondly, there are a number of limitations which concern the manner in which the production-side PPPs have been constructed. These are reported at length in Olislager and Konijn (2016), but briefly include:
As is often the case in PPP calculations, the source data required to compute these production-side PPPs was incomplete for some countries. In these cases – and in cases where there was a limited number of price quotes for some products – some imputation was used to ensure a complete set of data. The extent of this imputation varies across industries and countries.
Expenditure-side PPPs were used directly as proxies for production PPPs for some activities. These included construction, health and collective government services, as well as energy production and distribution, real estate and social work activities.
For some goods, Olislager and Konijn (2016) make use of unit values which are calculated using data on values and quantities from the Products of the European Community (PRODCOM) survey. While the authors argue that the detail of the product classification which they use, combined with a cleaning mechanism for censoring outliers, should limit the well-known adverse effects of using unit values1, this may have an impact on their results.
The use of output price measures and weights which are based on value added shares in each industry. Equivalently, these production-side PPPs are “single deflation” measures, rather than a more complete, double-deflated set which would require more granular information on intermediate consumption than is available currently (see Bean 2016).
These issues notwithstanding, Olislager and Konijn (2016) present data which suggests that the aggregate PPPs developed from their procedure differ relatively slightly – if systematically – from the expenditure-side PPPs. They argue that this indicates that their methodology does not produce wildly different results from established methods.
Finally, the price level indices (PLIs) which Olislager and Konijn (2016) develop are for 2014, and as a result they will be less applicable if they are applied to data from different periods – in particular to periods a long time before or after the period for which they are constructed. We have consequently limited our time series analysis to just a three-year window: 2014, 2015 and 2016.
Notes for: Limitations
- There are various issues surrounding the use of unit values for these purposes including the lack of accounting for changes in quality through time. This may cause problems for relatively complex products.
6. Results
The results of this research indicate that the UK’s productivity gap to other leading European economies is replicated at the industry level – although the size of that gap varies. Figure 1 shows level of output per hour in 2014 for the European G7 economies across nine industries (the A10 industries, excluding real estate1), ranked from the lowest to the highest level of UK labour productivity. It shows that the UK has the lowest labour productivity of this group of countries in five industries; and that it is third in the remaining four categories. Even among the UK’s most productive industries measured on this basis – including Production (B-E) and Financial and Insurance Activities (K) – the UK ranks relatively poorly, and there is a substantial gap between the UK and the most productive economy in this group.
Figure 1: Output per hour €, 2014
selected industries and countries
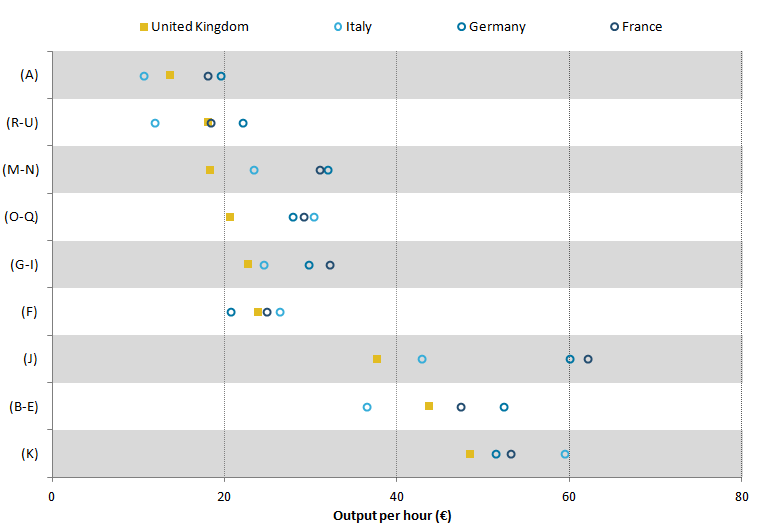
Source: Office for National Statistics, Eurostat
Notes:
- Industry key:
Agriculture, forestry and fishing (A);
Production (B-E);
Construction (F);
Wholesale and retail trade, transport, accommodation and food service activities (G-I);
Information and communication (J);
Financial and insurance activities (K);
Professional, scientific and technical activities; administrative and support service activities (M-N);
Public administration, defence, education, human health and social work activities (O-Q);
Arts, entertainment and recreation; other service activities; activities of household and extra-territorial organisations and bodies (R-U).
Download this image Figure 1: Output per hour €, 2014
.png (18.2 kB) .xls (26.6 kB)
Expanding the analysis to encompass all of the available European economies, there is often a considerable gap between the UK and the European “frontier economy” – the most productive economy in that industry. Figure 2 shows the output per hour level of the UK and the most and least productive countries for which we have data as well as the average (mean). It shows that in most industries, UK productivity lies within the middle of the European economies with an average position of 18th of the 29 nations included. The UK’s productivity performance is largely close to the average for this sample of countries; notable exceptions include relative weakness in the information and communication industry (J) and financial and insurance activities (K), as well as relative strength in the production industries (B-E).
Figure 2: Most and least productive countries per hour alongside the UK, 2014, selected industries
2014, selected industries
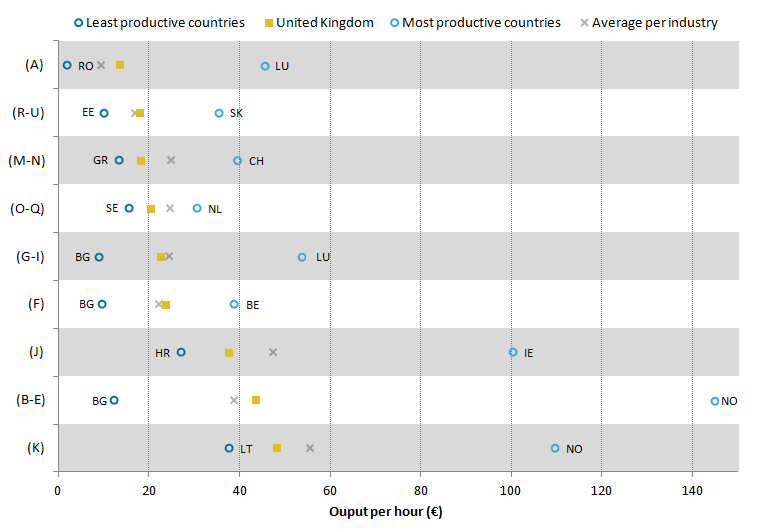
Source: Office for National Statistics, Eurostat
Notes:
Industry key: Agriculture, forestry and fishing (A);
Production (B-E);
Construction (F);
Wholesale and retail trade, transport, accommodation and food service activities (G-I);
Information and communication (J);
Financial and insurance activities (K);
Professional, scientific and technical activities; administrative and support service activities (M-N);
Public administration, defence, education, human health and social work activities (O-Q);
Arts, entertainment and recreation; other service activities; activities of household and extra-territorial organisations and bodies (R-U).Country key: RO – Romania, LU – Luxembourg, EE – Estonia, SK – Slovakia, CH – Switzerland, LT – Lithuania, NL – Netherlands, BG – Bulgaria, BE – Belgium, HR – Croatia, IE – Ireland, NO – Norway, SE – Sweden, GR – Greece.
The difference between UK and Norwegian production B-E here is driven partly by the differences in the employment structure between these countries. The UK has a relatively larger share of manufacturing (C) hours as a proportion of B-E, which is one of the less productive components.
- The data for this chart was updated to include an average column at 15:30 on 6 October 2017.
Download this image Figure 2: Most and least productive countries per hour alongside the UK, 2014, selected industries
.png (19.5 kB) .xls (31.2 kB)
While the UK lags substantially behind the other European economies in level terms, it has experienced stronger productivity growth in recent years relative to the European G7 economies on these measures. Figure 3 shows growth in real output per hour between 2014 and 2016 for the UK and the other European G7 economies by industry – taking data on real GVA growth and total hours for a longer period from Eurostat. The UK has seen its level of output per hour rise in every industry between 2014 and 2016, with the exception of Financial and Insurance activities (K) which showed a slight fall of 0.2%. This can be seen most notably in the Information and Communication industries (J) at 10.1%, Wholesale, Retail, Transport, Accommodation and Food Services industry group (G-I) at 3.5%, and the Agricultural industry (A) at 4.8%. These results are mostly consistent with the main International comparisons of productivity release, which indicates that across this period the UK was towards the front of the pack – ahead of both Italy and Germany, but some distance behind France in growth terms.
Figure 3: Growth in Output per hour €
2014 to 2016, selected industries and countries

Source: Office for National Statistics, Eurostat
Notes:
- Industry key:
Agriculture, forestry and fishing (A);
Production (B-E);
Construction (F);
Wholesale and retail trade, transport, accommodation and food service activities (G-I); Information and communication (J);
Financial and insurance activities (K);
Professional, scientific and technical activities; administrative and support service activities (M-N);
Public administration, defence, education, human health and social work activities (O-Q);
Arts, entertainment and recreation; other service activities; activities of household and extra-territorial organisations and bodies (R-U).
- The German agricultural industry (A) is not observable in this chart; it was excluded in this presentation due to very high productivity growth 2014 to 2016, at 20.7%.
Download this image Figure 3: Growth in Output per hour €
.png (18.8 kB) .xls (18.9 kB)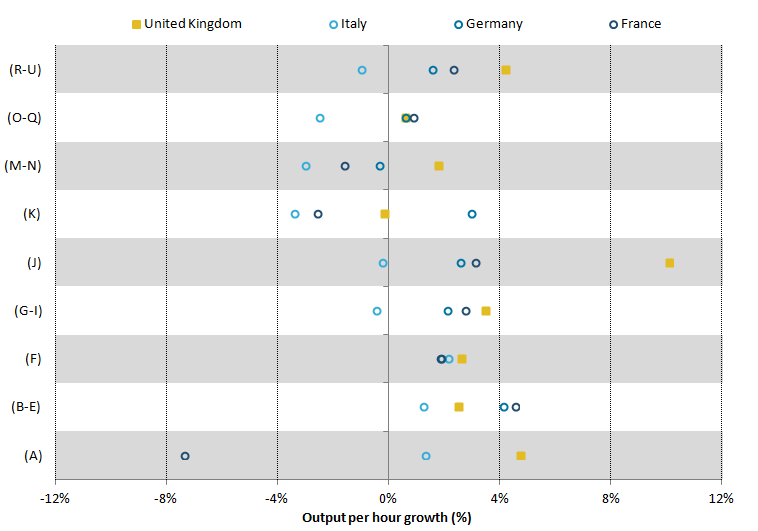
The UK has partly achieved this stronger aggregate productivity growth through an employment structure geared towards those industries which have had faster productivity growth in recent times2.
Figure 4 shows the share of total hours worked in each industry group for the European G7 economies. In particular, the share of hours accounted for by the group of industries J, K, L, M to N, and R to U is largest in the UK, at 31.1%. This group comprised some of the fastest productivity growth industries over this period: Labour productivity in the UK information and communication (J) industry grew by 10.1% between 2014 and 2016 and arts, entertainment and recreation and other service activities (R to U) grew by 4.2%. These are some of the highest growth rates experienced in the European G7 countries between 2014 and 2016, highlighting the UK’s employment structure as one which is weighted towards those industries experiencing the fastest growth.
These industries also hold a larger share as a percentage of total hours in the UK than the other four countries. For example, the information and communication industry (J), accounts for 5% of total hours in the UK compared to 3% for the other European G7 countries in 2014.
Figure 4: Shares of total hours worked by industry group
2014,selected countries and industry
Source: Office for National Statistics, Eurostat
Notes:
- Industry key:
Agriculture, forestry and fishing (A);
Industry (except construction) (B-E);
Construction (F);
Wholesale and retail trade, transport, accommodation and food service activities (G-I);
Information and communication (J);
Financial and insurance activities (K);
Professional, scientific and technical activities; administrative and support service activities (M-N);
Public administration, defence, education, human health and social work activities (O-Q);
Arts, entertainment and recreation; other service activities; activities of household and extra-territorial organisations and bodies (R-U)
Download this chart Figure 4: Shares of total hours worked by industry group
Image .csv .xlsNotes for: Results
We exclude real estate activities (L) as a significant driver of GVA for this industry is imputed rentals – rentals projected to accrue to owner occupied housing – which constitute output but have no accompanying labour input.
The aggregate rate of productivity growth in an economy is determined by (a) the rate of productivity growth within industries and (b) movements of resources and market share towards industries which have a relatively high level of labour productivity. Analysis using ONS’ headline labour productivity release suggests that the latter effect has been an unusually strong drag on UK productivity growth in recent times, emphasising the relative importance of within industry productivity growth.
7. Conclusion
The development of purchasing power parities (PPPs) from the production side of gross domestic product (GDP) by Olislager and Konijn (2016) has allowed for the analysis of productivity levels by industry across most of the major European economies. On this basis this article presents annual estimates of output per hour for 29 European countries on a nine-industry breakdown, for both 2014 and in terms of 2014 to 2016 growth rates. The results indicate that the UK’s weak productivity performance internationally is not an issue in a single industry, but rather a feature of the UK’s performance across a range of industries. While the UK lags behind in level terms, recent UK productivity growth across industries has been strong relative to the other large European economies in recent periods. There is further work to do in the investigation and analysis of the presented productivity figures, and we welcome user feedback on the uses and usefulness of these data. The calculation of production PPPs for further years would also provide a useful basis for further research.
Nôl i'r tabl cynnwys9. References
Olislager, L and Konijn, P. (2016). Eurostat Review on National Accounts and Macroeconomic Indicators EU KLEMS Growth and Productivity Accounts: Statistical Module, ESA 2010 and ISIC Rev. 4 industry classification
OECD and Eurostat (2012), “Calculation and aggregation of PPPs”, in Eurostat-OECD Methodological Manual on Purchasing Power Parities, OECD Publishing.
Inklaar, Rand Timmer, M.P. (2012). The relative price of services. (GGDC Working Papers; Vol. GD-124). Groningen: GGDC.
Timmer, M, Ypma, G, and van Ark, B V. (2007). PPPs for Industry Output: A New Dataset for International Comparisons. s.n.
Bean, C (2016). “Independent Review of UK Economic Statistics”.
Mason, G, O’Leary, B, O’Mahoney, M and Robinson, K. (2008). “Cross-Country Productivity Performance at Sector Level: the UK Compared with the US, France and Germany”. Department for Business Enterprise & Regulatory Reform. BERR occasional paper no. 1.
Nôl i'r tabl cynnwysManylion cyswllt ar gyfer y Erthygl
productivity@ons.gov.uk
Ffôn: +44 (0) 1633 65 1837