1. UK productivity flash estimate: October to December 2018
Output per hour – Office for National Statistics’ (ONS’) main measure of labour productivity – comparing this quarter with a year ago, decreased by 0.2% in the year to Quarter 4 (Oct to Dec) 2018. Output per worker decreased by 0.1% in the year to Quarter 4 (Oct to Dec) 2018.
The quarter-on-year growth rate provides a better measure of the long-term trend of labour productivity growth than the quarter-on-previous-quarter data. Quarterly movements in labour productivity tend to be volatile, and may not indicate the long-term trend of labour productivity growth in the UK.
This flash estimate of UK productivity uses the first available information on output and labour input for the latest quarter. Both these releases lead on comparing growth with the previous quarter. In quarter-on-previous-quarter terms output per hour increased by 0.2% in Quarter 4 2018. In contrast, output per worker decreased by 0.3% (see Figure 2).
The increase in output per hour in Quarter 4 on the quarter-on-quarter basis was the result of a 0.2% increase in gross value added (GVA) (using the preliminary gross domestic product (GDP) estimate) accompanied by 0.1% decrease in total hours worked (using the latest Labour Force Survey data). The decrease in total hours worked was driven by 0.6% decrease in average hours worked, despite a 0.5% increase in employment.
This flash estimate of UK productivity uses the first available information on output and labour input for the latest quarter. Earlier quarters are consistent with the Labour productivity national statistics. These data may be revised in subsequent months. As such, we release the more detailed Labour productivity bulletin after the publication of GDP quarterly national accounts.
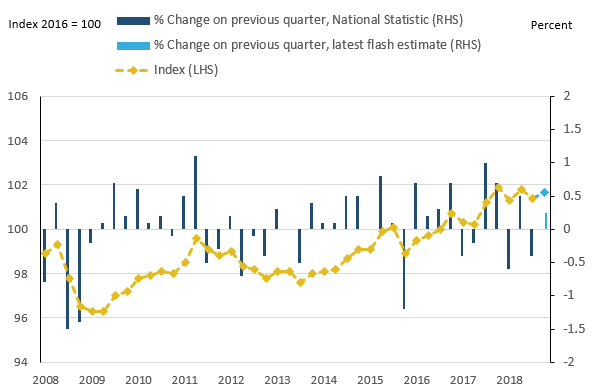
Figure 1: Percentage change on previous quarter and index of output per hour
Seasonally adjusted, Quarter 1 (Jan to Mar) 2008 to Quarter 4 (Oct to Dec) 2018, UK
Source: Office for National Statistics
Download this image Figure 1: Percentage change on previous quarter and index of output per hour
.PNG (19.4 kB) .xlsx (9.6 kB)
This is the second quarterly increase in output per hour in 2018, following a decrease in the previous quarter. Over a longer period, UK productivity growth has been relatively weak – in particular, since the onset of the economic downturn in Quarter 1 (Jan to Mar) 2008 – because the growth in labour market inputs outpaced GDP growth.
Figure 2: Percentage change on previous quarter and index of output per worker
Seasonally adjusted, Quarter 1 (Jan to Mar) 2008 to Quarter 4 (Oct to Dec) 2018, UK

Source: Office for National Statistics
Download this image Figure 2: Percentage change on previous quarter and index of output per worker
.PNG (18.9 kB) .xlsx (20.8 kB)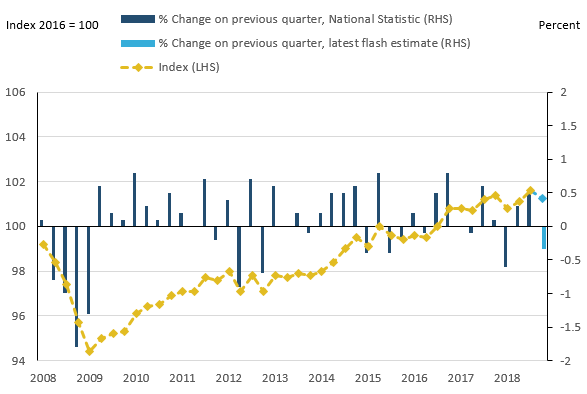
Both employment – which captures the total number of people in work – and total hours – which captures both changes in employment and working patterns – fell in the course of the economic downturn, though total hours fell further reflecting a fall in the average hours of those in employment. However, as GDP fell by a larger proportion in the economic downturn than either hours or employment and has grown slowly by historical standards during the recovery, productivity growth has been subdued since the downturn and has recovered more slowly compared to previous downturns.
The most recent estimate of GDP indicated that the UK economy grew by 0.2% in Quarter 4 2018, in contrast to the decrease of 0.1% in total hours worked. Employment over the same period went up 0.5%. Figure 3 shows these relative movements over the post-downturn period. It indicates that in Quarter 4 2018, all three economic indicators were above their pre-recession levels with GDP, hours and employment being 12.1%, 9.1% and 9.8% respectively.
Figure 3: Index of gross value added (chained volume measure), employment level (aged 16 and over) and total hours worked (weekly)
Seasonally adjusted, Quarter 1 (Jan to Mar) 2008 to Quarter 4 (Oct to Dec) 2018, UK
Source: Office for National Statistics
Download this chart Figure 3: Index of gross value added (chained volume measure), employment level (aged 16 and over) and total hours worked (weekly)
Image .csv .xlsThe increase in GVA in Quarter 4 2018 reflects growth in services, offset by contractions in both production and construction. Services contributed 0.35 percentage points towards GVA growth whilst production and construction negatively contributed by 0.15 and 0.02 percentage points, respectively. The growth of GVA on the quarter corresponds with the growth of the UK labour market, as the number of people aged 16 years and over in employment increased by 0.5% to 32.6 million over the same period. This growth in employment was driven by an increase in the self-employed, which grew by 1.7% in Quarter 4 2018; employment for both full and part-time employees increased in the same period by 0.3%.
Nôl i'r tabl cynnwys2. Data sources and revisions
Gross domestic product (GDP) data for Quarter 4 (Oct to Dec) 2018 are from the GDP first quarterly estimate, UK: October to December 2018, published on 11 February 2019.
Figure 4: Output per hour, current and previous flash estimates
Seasonally adjusted Quarter 4 (Oct to Dec) 2015 to Quarter 3 (July to Sept) 2018, UK
Source: Office for National Statistics
Download this chart Figure 4: Output per hour, current and previous flash estimates
Image .csv .xlsLabour market data, for the same period are from the Labour market statistics – February 2019 statistical bulletin, published on 19 February 2019.
Data for the earlier quarters, Quarter 1 (Jan to Mar) 2008 until Quarter 3 (July to Sept) 2018, are consistent with the Labour productivity national statistics. Figure 4 shows revisions to growth rates on the quarter compared to the first flash estimates published for the corresponding period. The aim is to show the reliability of the initial flash estimates over time.
Details of the policy governing the release of new data are available from the UK Statistics Authority.
Nôl i'r tabl cynnwys