1. Introduction
Traffic cameras are a valuable source for understanding the level of activity in towns and cities, as well as changing patterns of mobility. The UK has thousands of publicly accessible traffic cameras with providers ranging from national agencies to local authorities. These include:
- Highways England, who stream images from 1,500 cameras located across the major road system of England
- Traffic Wales
- Transport for London, with more than 900 cameras
- Reading Borough Council
The images traffic cameras produce are publicly available, low resolution and do not permit people or vehicles to be individually identified. However, our research shows that they are a good indicator for overall levels of “busyness” in urban areas. As such, they are a valuable complement to other mobility and traffic data in order to understand the economic and social effects of changing patterns of behaviour during the coronavirus (COVID-19) pandemic.
More information on this experimental research is available in the Data Science Campus blog.
Currently these indicators are not official statistics and are considered experimental. They provide insight and value, but they will be further improved upon over the coming weeks and months. Therefore, you can expect these series to be revised.
Nôl i'r tabl cynnwys2. The data sources
The traffic camera data sources typically consist of either static images or clips of video taken from static cameras. These are openly accessible and usually provide a low resolution image (see Figure 1). One of the advantages of these sources is that the cameras update very frequently, with new images being available usually every few minutes. This allows for the construction of counts of objects (such as pedestrians or cars) that capture the levels of activity at different times of days, throughout the entire week.
Figure 1: Segment of traffic camera video footage from St Giles Circus in London. Cars, pedestrians and buses are clearly visible in the image

Source: Transport for London
Download this image Figure 1: Segment of traffic camera video footage from St Giles Circus in London. Cars, pedestrians and buses are clearly visible in the image
.png (446.9 kB)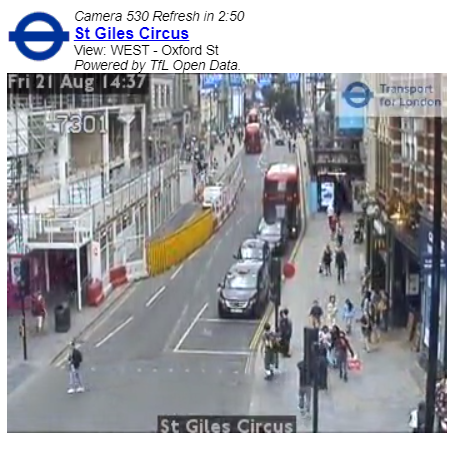
The main limitations of this type of traffic camera footage are:
- not every vehicle or pedestrian passing by the camera is counted as footage is only taken at regular intervals
- no information on flows can be produced, such as the origin, destination or route of travel
- the accuracy of the counts is dependent on multiple aspects, such as occlusion of the objects, illumination, weather, choice of machine learning model, training sets and camera image resolution
As such, this source is more suited to produce an overall estimate of “busyness” or activity in urban areas that complements other faster indicators.
The full list of open websites we reviewed is available in the Data Science Campus blog.
We selected a subset of sites from the list and have built up a profile of historical activity on their cameras. We selected:
- Durham (since 7 May 2020).
- London (11 March 2020)
- Manchester (17 April 2020)
- North East (1 March 2020)
- Northern Ireland (15 May 2020)
- Southend (7 May 2020)
- Reading (7 May 2020)
These locations give broad coverage across the UK whilst also representing a range of different sized settlements in both urban and rural settings.
Nôl i'r tabl cynnwys3. How we measure busyness
The series we produce are aimed at estimating the degree of “busyness” (pedestrian and vehicle activity) in towns and cities. It relies on automated cloud infrastructure that transfers and stores images from publicly available traffic cameras and then analyses those images. Following the retrieval of the images, the processing can be roughly divided into a machine-learning pipeline, followed by a statistical pipeline for time series analysis.
Machine-learning pipeline
The machine-learning pipeline is to locate and identify the semantic objects of vehicles and pedestrians from images and produce the counts of moving objects (see Figure 2). The data flow in Figure 2 shown in grey processes spatial information from a single image. That is, each image is processed independently without considering other images captured before or after it. The blue flow processes spatial and temporal information for an image and its most recent neighbouring images.
Figure 2: Diagram representing the different stages of object detection in order to count the number of moving objects in the traffic camera images

Source: Office for National Statistics
Download this image Figure 2: Diagram representing the different stages of object detection in order to count the number of moving objects in the traffic camera images
.png (17.7 kB)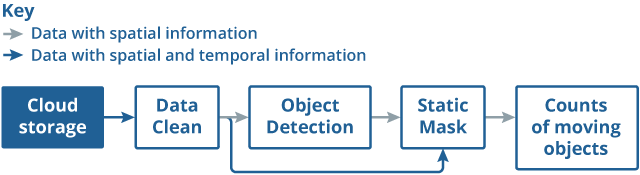
Ideally new images are fetched every 10 minutes from cameras, for example, by application programming interface (API) or from Amazon real-time storage. However, in practice images can be duplicated if the host did not update them in time. Cameras can be periodically offline and display dummy images. Images can also be partly or completely distorted because of physical problems with a camera. Data cleaning is therefore an important part to remove these problematic images and thus improve the quality of statistical outputs.
The object detection step uses spatial information to identify vehicles and pedestrians on a single image. Here a deep learning model, called Faster Region-based Convolutional Neural Network (Faster-RCNN) is applied.
As we are aiming to detect activity it is important to filter out static objects such as parked vehicles using temporal information. The static mask step applies the structure similarity measure (SSIM) to exact background and then to determine whether the pedestrian and vehicles are static or moving. Only moving objects are counted to generate time series.
More details on the algorithms, evaluation and validation of the machine-learning pipeline can be found in the blog.
Time series processing and analysis
Once counts of objects are available for a traffic camera, we carry out a number of processing steps to:
- compensate for missing or low quality images
- aggregate the cameras to a town or city level
- remove seasonality to facilitate interpretation of the results
The methodology for the traffic camera time series has been updated, commencing with the data corresponding to the week of 31 August to 6 September 2020 (published on 10 September 2020). From this date, instead of applying the seasonal decomposition imputation to the entirety of the series, it is applied to the data from the latest four weeks, with the previously imputed data remaining unchanged. The main benefit of this change is making the processing simpler and faster, which allows more time for quality assuring the results.
The imputation consists of identifying missing periods of data from each of the cameras, and then replacing these missing counts (usually missing because of technical faults) of each object type by estimated values. We carried out imputation by applying seasonal decomposition. First, the seasonality of the series is removed, then the mean is imputed to the missing periods, and then the seasonality of the series is reapplied. The imputation was applied with the ImputeTS package in R.
Following imputation, the counts of each object type are aggregated for each of the locations of interest. For example, for Reading all the cars counted by all the traffic cameras (including imputed counts) are added up to produce the car time series.
Once the series have been aggregated, we seasonally adjusted each series to make interpretation of the results clearer. Seasonal adjustment removes fluctuations because of the time of day or day of the week from the data, making it easier to observe underlying trends in the data. We applied seasonal adjustment using TRAMO/SEATS on hourly, as well as daily time series. The data were also transformed in order to remove the possibility of the seasonal adjustment process resulting in negative values.
Presentation of the data
For the faster indicators the data are presented as a number of time series with daily periods. These series are refreshed weekly and seasonally adjusted to facilitate the identification of trends in the data.
Nôl i'r tabl cynnwys4. Strengths and limitations of the source
The traffic camera data are best suited at detecting trends in “busyness” or activity in town and city centres. They are not suited for estimating the overall amount of vehicle or pedestrian movements, or for understanding the journeys that are made. They provide high frequency (hourly) and timely (weekly) data, which can help to detect trends and inflection points in social behaviour. As such, they provide insights that complement mobility and transport data.
Strengths
There are a number of strengths to the analysis of traffic camera data.
The data are very timely. We can process data up to the day prior, and we can produce these every week. If needed, the process can be scaled in order to produce more frequent time series, such as updating a dashboard on a daily basis.
A large array of different objects are detected. The traffic camera pipeline allows us to detect cars, buses, motorcycles, vans, pedestrians, and so on. This is, indeed, one of the few sources of data that can detect pedestrians on pavements.
Reuses a public resource. The series make further use of traffic camera images that are already collected by local authorities and transport bodies. Therefore there is no additional cost to their collection.
It is cost efficient. The cloud infrastructure to produce these series costs hundreds of pounds a month. This is substantially lower than the costs associated with having staff identifying the different vehicle types or deploying infrastructure in place for carrying out an equivalent task.
Town centre coverage. The cameras provide coverage of the centre of towns and cities, as well as many areas that receive either retail or commuting traffic and pedestrian flows.
Large number of cameras. There is a large, already available, network of traffic cameras, and for each location we can tap into many of these at once.
Individuals and vehicles are not identified. No details about individuals or vehicles are stored or processed, such as number plates or faces.
Limitations
Coverage is limited. Although many traffic cameras are available, they are clustered in towns and cities. It is more difficult to locate traffic cameras in smaller settlements. Currently we do not produce any series for Wales.
Accuracy depends on external factors. Accuracy of detecting different object types depends on many factors outside our control. The positioning of cameras can make it difficult to detect certain object types, for example, and the image quality depends on weather and technology.
Counts are always underestimated. Sensors placed on roads can be used to count every vehicle passing by the sensor, but the traffic camera images only provide images at regular intervals, and depend on the accuracy of the machine-learning model for counting objects. Therefore, this source is more suited for estimating trends rather than absolute numbers.
Nôl i'r tabl cynnwys5. Comparison with other sources
Department for Transport traffic data
Department for Transport (DfT) produce statistics on road traffic for Great Britain from 275 automatic traffic count sites. In addition, they provide statistics on cyclists, bus travel and rail travel. Their vehicle counts are further disaggregated into cars, light commercial vehicles and heavy goods vehicles.
These data are not directly comparable with the traffic camera data, as the coverage is different (overall Great Britain as opposed to a selection of towns and cities), but it is of use for assessing whether the traffic camera sources can be used to estimate inflection points in traffic. Figures 3 and 4 show all vehicle activity for the traffic camera sources and DfT for London and the North East (Newcastle and Sunderland) respectively. The DfT data reflect the Great Britain movements. Note that the traffic camera series has been seasonally adjusted in order to reduce some of the variability associated with weekdays.
Figure 3: Degree of activity for traffic cameras relative to 11 March 2020 for London and DfT estimated level of road traffic for Great Britain relative to the equivalent date in February 2020
Daily counts of all motor vehicles, seasonally adjusted, London and Great Britain
Source: Transport for London, Department for Transport
Download this chart Figure 3: Degree of activity for traffic cameras relative to 11 March 2020 for London and DfT estimated level of road traffic for Great Britain relative to the equivalent date in February 2020
Image .csv .xls
Figure 4: Degree of activity for traffic cameras relative to 1 March 2020 for the North East and DfT estimated level of road traffic for Great Britain relative to the equivalent date in February 2020
Daily counts of all motor vehicles, seasonally adjusted, London and Great Britain
Source: North East traffic cameras, Department for Transport
Download this chart Figure 4: Degree of activity for traffic cameras relative to 1 March 2020 for the North East and DfT estimated level of road traffic for Great Britain relative to the equivalent date in February 2020
Image .csv .xlsConsidering the differences in coverage, and the location of count sites (highways, urban and rural) and traffic cameras (solely urban), both sources provide similar inflection points in activity in mid- and late-March. Similarly, both sources provide a similar trend of increasing activity from May onwards, with somewhat differing levels.
Google mobility data
Google and Apple provide aggregate reports on movement trends across a number of categories of places such as grocery stores, retail and entertainment venues or workplaces. In Figures 5 and 6 we compare the mobility series produced by Google with the pedestrian activity that we have estimated from traffic cameras for London and the North East, respectively. The Google data uses a baseline based on a median for each day of the week for the period between 3 January and 6 February 2020.
Figure 5: Comparison of traffic camera pedestrian counts with Google mobility data for Greater London
Daily counts of pedestrians, seasonally adjusted, Greater London
Source: Transport for London, Google mobility data
Download this chart Figure 5: Comparison of traffic camera pedestrian counts with Google mobility data for Greater London
Image .csv .xls
Figure 6: Comparison of traffic camera pedestrian counts with Google mobility data for the North East of England (Tyneside)
Daily counts of pedestrians, seasonally adjusted, Tyneside
Source: North East traffic cameras, Google mobility data
Download this chart Figure 6: Comparison of traffic camera pedestrian counts with Google mobility data for the North East of England (Tyneside)
Image .csv .xlsIn these series there is a good correspondence between the series with respect to inflection points in the data. However, there are remarkable differences with respect to levels, as Google mobility data includes all movements carried out by individuals to the places of interest, while traffic camera data includes all observations of pedestrians on selected streets. The traffic camera series are also likely to count pedestrians who are not visiting to any of the destinations analysed by Google. It is worth noting that some of the visitors in Google data might be making their visits in cars, which wouldn’t be reflected in the pedestrian time series.
Nôl i'r tabl cynnwys