Cynnwys
- Main points
- Things you need to know about this release
- Index of Services (IoS) main figures
- Quarter-on-quarter services growth
- Quarter 1 2018 comparison with previous quarters
- Three-month on a year ago services growth
- Month-on-month services growth
- Links to related statistics
- Upcoming changes
- Feedback on this bulletin
- Quality and methodology
1. Main points
Services output increased by 0.3% in Quarter 1 (Jan to Mar) 2018 compared with Quarter 4 (Oct to Dec) 2017; following growth of 0.4% between Quarter 3 (July to Sept) 2017 and Quarter 4 2017.
Services growth of 0.3% in Quarter 1 2018 is equal to the average quarterly growth in 2017; survey-led evidence suggests that although heavy snowfall in February and March 2018 will have impacted some areas of services output, this was limited.
Business services and finance made the largest contribution to the quarterly growth, contributing 0.18 percentage points.
In the three months to March 2018, services output increased by 1.2% compared with the three months ending March 2017.
The Index of Services increased by 0.1% between February 2018 and March 2018.
Distribution, hotels and restaurants contributed negative 0.16 percentage points to the monthly movement and partially offset positive contributions from the other three main components.
2. Things you need to know about this release
The monthly Index of Services (IoS) provides a timely indicator of growth in the output of the services industries and is the largest contributor to the output approach to the measurement of gross domestic product (GDP), accounting for 79.3% of UK GDP in 2015. Also published today (25 May 2018) is the UK GDP, second estimate: January to March 2018.
The IoS measures UK output in: distribution, hotels and restaurants; transport, storage and communication; business services and finance; and government and other services. These data are used to produce seasonally adjusted estimates of output at chained volume measures (removing the effect of inflation). Unless otherwise stated, all estimates included in this release are based on seasonally adjusted data.
The IoS is an important economic indicator and one of the earliest short-term measures of economic activity. It is used in the compilation of the national accounts and widely used by private and public sector institutions, particularly by the Bank of England and Her Majesty’s Treasury to assist in informed decision and policy-making.
Data for the latest period are primarily based upon the Monthly Business Survey (MBS) of approximately 26,000 businesses as detailed in MBS Turnover in services industries.
In addition, from the October 2017 bulletin published in December 2017, we have also included VAT data across 35 services industries for small- and medium-sized businesses. These have been used to supplement data from the MBS from January 2016 to September 2017. Further information on the use of VAT data was published in the VAT turnover data in National Accounts: background and methodology update.
Further data is received from a wide variety of data sources as described in the GDP(O) source catalogue.
Data relating to the retail industry are broadly comparable with Retail sales, Great Britain: March 2018, published on 19 April 2018.
This March 2018 release contains revisions from January 2018 and is consistent with the National Accounts Revisions Policy. This means that we have incorporated additional data since this period.
Revisions can be made for a variety of reasons. The most common include:
late responses to surveys and administrative sources
forecasts being replaced by actual data
revisions to seasonal adjustment factors, which are re-estimated every month and reviewed annually
HMRC VAT returns replacing MBS data for small- and medium-sized businesses when VAT estimates become available every quarter
The UK Index of Services has been designated by the UK Statistics Authority as National Statistics, in accordance with the Statistics and Registration Service Act 2007 and signifying compliance with the Code of Practice for Statistics.
Nôl i'r tabl cynnwys3. Index of Services (IoS) main figures
Table 1 shows data for the Index of Services (IoS) and each of the main components for March 2018.
Table 1: Index of Services main figures, March 2018, UK
| UK | Percentage Change | ||||||||||||
| Percentage of Services1 | Index number (2015 = 100) | Most recent month on a year earlier | Most recent quarter on a year earlier | Most recent month on previous month | Most recent quarter on previous quarter | ||||||||
| Index of Services | 100.0 | 104.8 | 1.1 | 1.2 | 0.1 | 0.3 | |||||||
| Distribution, hotels and restaurants | 17.3 | 106.3 | 0.1 | 0.7 | -0.9 | -0.1 | |||||||
| Transport, storage and communication | 13.2 | 110.3 | 2.5 | 2.8 | 0.8 | 0.4 | |||||||
| Business services and finance | 41.5 | 105.2 | 1.7 | 1.7 | 0.2 | 0.4 | |||||||
| Government and other services | 28.0 | 100.9 | 0.1 | 0.0 | 0.2 | 0.1 | |||||||
| Source: Office for National Statistics | |||||||||||||
| Notes: | |||||||||||||
| 1. Components may not sum to 100% due to rounding. | |||||||||||||
Download this table Table 1: Index of Services main figures, March 2018, UK
.xls (43.5 kB)4. Quarter-on-quarter services growth
During Quarter 1 (Jan to Mar) 2018, services output increased by 0.3% following growth of 0.4% in Quarter 4 (Oct to Dec) 2017. This is unrevised from the estimate used in the Gross domestic product, preliminary estimate: January to March 2018.
Figure 1: Contributions1 to growth in services between Quarter 4 (Oct to Dec) 2017 and Quarter 1 (Jan to Mar) 2018
UK
Source: Office for National Statistics
Notes:
- Individual contributions may not sum to the total due to rounding.
- Percentage change.
Download this chart Figure 1: Contributions^1^ to growth in services between Quarter 4 (Oct to Dec) 2017 and Quarter 1 (Jan to Mar) 2018
Image .csv .xlsThree of the four main components of the services industries increased during Quarter 1 2018 (Figure 1). In order of their contribution to growth:
business services and finance increased by 0.4%, contributing 0.18 percentage points
transport, storage and communication increased by 0.4%, contributing 0.05 percentage points
government and other services increased by 0.1%, contributing 0.04 percentage points
distribution, hotels and restaurants fell by 0.1%, contributing negative 0.01 percentage points
Business services and finance made the largest contribution to the Index of Services for the third consecutive quarter. Within this component, architectural and engineering activities made the largest contribution, increasing by 3.4% and contributing 0.08 percentage points. In addition to this, legal activities increased by 3.2% and contributed 0.06 percentage points. Partially offsetting this was travel agents and tour operators, which decreased by 4.1%, contributing negative 0.04 percentage points.
Telecommunications and motion pictures were the industries contributing most to the growth in the transport, storage and communication component. They increased by 2.0% and 3.7% respectively and both contributed 0.04 percentage points. In the government and other services component, the largest contribution came from the human health activities industry, which increased by 0.6%, contributing 0.04 percentage points.
Decreases in retail trade, and food and beverage services were the cause for the fall in the distribution, hotels and restaurants component. Retail trade fell by 0.5%, contributing negative 0.03 percentage points. Please see the Retail sales – March 2018 release for more information. Food and beverage services decreased by 0.4% and contributed negative 0.01 percentage points.
Nôl i'r tabl cynnwys5. Quarter 1 2018 comparison with previous quarters
The Index of Services (IoS) growth of 0.3% in Quarter 1 (Jan to Mar) 2018 is equal to the average quarterly growth in 2017. This shows that, although Quarter 1 2018 saw a weaker services growth than Quarter 4 (Oct to Dec) 2017, it is still in line with quarterly services growth over the past year (Figure 2).
Figure 2: Quarterly Index of Services growth between Quarter 1 (Jan to Mar) 2015 and Quarter 1 2018 and the contributions to growth by the four main services components
UK
Source: Office for National Statistics
Notes:
- Individual contributions by the four main components may not sum to total Index of Services growth rate due to rounding.
Download this chart Figure 2: Quarterly Index of Services growth between Quarter 1 (Jan to Mar) 2015 and Quarter 1 2018 and the contributions to growth by the four main services components
Image .csv .xlsFollowing several large quarterly growths in 2016, the growth in Quarter 1 2017 weakened, increasing by 0.2% and has since remained steady. Services increased by 0.3% in Quarter 1 2018, slightly lower than the 0.4% increase in Quarter 4 2017.
Of the four main components, distribution, hotels and restaurants, and government and other services have seen no change to their contribution to IoS growth between Quarter 4 2017 and Quarter 1 2018. Transport, storage and communications, and business services and finance on the other hand have both seen a decrease to their contributions between the two quarters.
On an industry basis, six industries across all four components have seen a large negative difference between Quarter 4 2017 and Quarter 1 2018. Figure 3 compares these contributions across both quarters.
Figure 3: Contributions of Index of Services industries for Quarter 4 (Oct to Dec) 2017 and Quarter 1 (Jan to Mar) 2018
UK
Source: Office for National Statistics
Download this chart Figure 3: Contributions of Index of Services industries for Quarter 4 (Oct to Dec) 2017 and Quarter 1 (Jan to Mar) 2018
Image .csv .xlsThe Index of Services saw a negative 0.17 percentage points difference between Quarter 4 2017 and Quarter 1 2018. The six industries shown in Figure 3 account for a negative 0.32 percentage points switch between the same periods and are the main reason behind the weaker services growth in Quarter 1 2018.
Snow in late February and early March 2018 had little observed impact on these decreases between Quarter 4 2017 and Quarter 1 2018. Retail trade was one exception to this; sales fell in the first quarter due to a large decline in March, with petrol sales seeing a significant slump as a result of the poor weather keeping many shoppers indoors. However, the snow actually helped boost online spending with department stores in particular seeing growth in their web sales. Data relating to the retail industry are broadly comparable with Retail sales - March 2018.
Office for National Statistics (ONS) despatches approximately 26,000 forms per month as part of the Monthly Business Survey (MBS) and of these, 2,800 businesses on average are contacted per month via telephone to discuss their figures. Although snowfall affected much of the UK during Quarter 1 2018, few businesses outside the retail industry reported any significant impact due to bad weather. The ONS business intelligence therefore suggests that the weather had a limited impact on overall growth during the quarter.
There are other reasons why the services sector slowed in Quarter 1 2018. Warehousing and support activities, and postal and courier activities saw large growths in Quarter 4 2017 and contributed 0.05 and 0.03 percentage points respectively. Increased activity around Black Friday and the build-up to Christmas were the cause of these rises. There has now been a slight fall-back in Quarter 1 2018, with both industries contributing negative 0.01 percentage points.
The other three industries are all from the business services and finance main component. Activities of head offices and office administration similarly saw strong Quarter 4 2017 figures, both contributing 0.04 percentage points. They too have fallen back slightly in Quarter 1 2018, contributing negative 0.01 and 0.02 percentage points respectively.
The travel agents and tour operators industry saw less of an increase in Quarter 4 2017 compared with the other five industries, contributing 0.01 percentage points. This industry then saw a fall in Quarter 1 2018, which contributed negative 0.04 percentage points. This fall was driven by the larger businesses within the travel agency component of the industry. This industry has started to see weaker figures since the start of 2017 and also saw a similar quarterly decrease in Quarter 2 (Apr to June) 2017.
Nôl i'r tabl cynnwys6. Three-month on a year ago services growth
Figure 4 shows the three-month on a year ago Index of Services (IoS) growth rates and the average of these growth rates over each year since 2005.
Figure 4: Three-month on a year ago growth and three-month on a year ago annual average between January 2005 and March 2018
UK

Source: Office for National Statistics
Download this image Figure 4: Three-month on a year ago growth and three-month on a year ago annual average between January 2005 and March 2018
.PNG (24.6 kB) .xls (56.3 kB)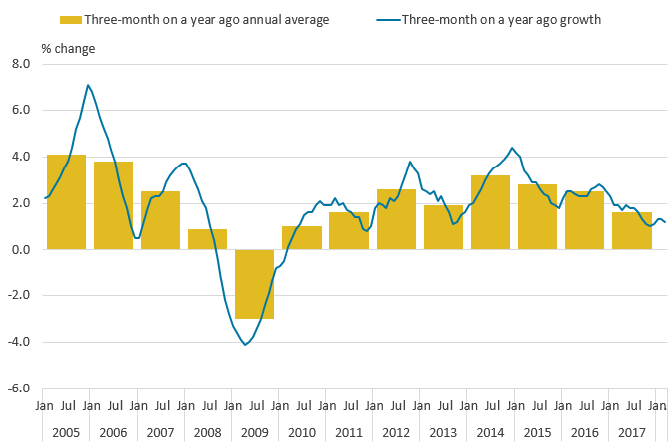
In the three months to March 2018, services output increased by 1.2% compared with the three months ending March 2017. This was last weaker in the three months to December 2017.
Services has seen a slowdown since the start of 2017. However, the annual average for the three-month on a year growth rates indicates that this goes further back. The annual average has weakened each year since 2014. The average for January to March 2018 is 1.3% compared with the average of 1.6% for 2017.
Nôl i'r tabl cynnwys7. Month-on-month services growth
Services output increased by 0.1% in March 2018, following a fall of 0.3% in February 2018.
Figure 5 shows the Index of Services (IoS) month-on-month growth rates since January 2015 and Figure 6 shows the month-on-month contributions of each of the main IoS components for March 2018.
Figure 5: Index of Services headline growth rates from January 2015 to March 2018
UK
Source: Office for National Statistics
Download this chart Figure 5: Index of Services headline growth rates from January 2015 to March 2018
Image .csv .xls
Figure 6: Contributions1 to growth in services between February 2018 and March 2018
UK
Source: Office for National Statistics
Notes:
- Individual contributions may not sum to the total due to rounding.
- Percentage change.
Download this chart Figure 6: Contributions^1^ to growth in services between February 2018 and March 2018
Image .csv .xlsThree of the four main components of the services industries increased during March 2018. In order of their contribution to growth:
transport, storage and communication increased by 0.8%, contributing 0.11 percentage points
business services and finance increased by 0.2%, contributing 0.09 percentage points
government and other services increased by 0.2%, contributing 0.06 percentage points
distribution, hotels and restaurants decreased by 0.9%, contributing negative 0.16 percentage points
The industries contributing most to the increase of 0.1% in March 2018 were:
legal activities, which increased by 3.6%, contributing 0.07 percentage points
motion pictures, which increased by 5.1%, contributing 0.05 percentage points
computer programming, which increased by 1.1%, contributing 0.04 percentage points
Decreases across four out of the five industries within distribution, hotels and restaurants offset much of this growth. These industries were also the largest negative contributions across the whole of the Index of Services in March 2018.
Retail trade decreased by 1.2%, contributing negative 0.08 percentage points. Please see the Retail sales – March 2018 release for more information. Wholesale trade fell by 0.8% and contributed negative 0.04 percentage points. There were also decreases in motor trades, and food and beverage activities. They fell by 1.3% and 1.0% respectively and both contributed negative 0.03 percentage points.
Nôl i'r tabl cynnwys9. Upcoming changes
We published a response to the consultation on proposed changes to the gross domestic product (GDP) release schedule on 19 October 2017. Further details on this response are available on our Consultation Hub. In summary, an estimate of monthly GDP will be published on 10 July 2018 (for the reference period of May) and there will be two quarterly estimates of GDP per quarter rather than the current three; the preliminary estimate of GDP will be deferred by around two weeks and the second estimate of GDP will be brought forward by two weeks to form the new first estimate, meaning the income and expenditure approaches to GDP will be made available earlier than presently. The first estimate of quarterly GDP (for Quarter 2 (Apr to June) 2018) under this new model will be published in August 2018.
This change will mean that the Index of Services (IoS) publication is brought forward from July to align with the other short-term indicators, the Index of Production and Output in the construction industry. Services will publish as normal on 29 June 2018 (for the reference period of April) but will then switch to this new publication model and will publish again on 10 July 2018 (for the reference period of May).
In July 2018, the IoS will also cease presenting data in the bulletin on the four main services components, distribution, hotels and restaurants; transport, storage and communication; business services and finance; and government and other services. Instead, it will break these down into 12 more detailed sector levels. Table 2 shows the current four main components and the sector levels we plan to move to from July.
This change will not affect the datasets that are published alongside the IoS bulletin; we would continue to publish the four main components in the Index of Services industry components to four decimal places.
Table 2: Index of Services sector levels
| Sector | Description |
|---|---|
| G & I | Distribution, hotels & catering |
| G | Wholesale and retail trade; repair of motor vehicles and motorcycles |
| I | Accommodation and food service activities |
| H & J | Transport, storage & communications |
| H | Transportation and storage |
| J | Information and communication |
| K - N | Business services & finance |
| K | Financial and insurance activities |
| L | Real estate activities |
| M | Professional, scientific and technical activities |
| N | Administrative and support service activities |
| O - T | Government & other services |
| O | Public administration and defence; compulsory social security |
| P | Education |
| Q | Human health and social work activities |
| R,S,T | Other service activities |
Download this table Table 2: Index of Services sector levels
.xls (46.1 kB)As part of the transformation of Office for National Statistics data collection, 33,000 Monthly Business Survey forms covering the Production and Services sectors are moving online from paper despatch. This process has begun with 1,000 businesses selected at random for the Index of Production and Index of Services for May 2018. The survey will gradually move to being fully online later this year.
Nôl i'r tabl cynnwys10. Feedback on this bulletin
We welcome your feedback on this bulletin via our short survey.
Nôl i'r tabl cynnwys11. Quality and methodology
The monthly Index of Services (IoS) was developed to provide a timely indicator of growth in the output of services industries, at constant prices for the UK. The IoS is an important component of monthly output (gross domestic product output approach (GDP(O)), representing about 79.3% of UK gross domestic product (GDP) as of 2015. The IoS shares the exact same industry coverage as the corresponding quarterly series within GDP(O).
The Index of Services datasets contain additional material, including:
Monthly Business Survey (MBS) response rates (current and historic)
IoS and main component indices to four decimal places
publication tables
revisions triangles
lower-level time series data
Monthly Business Survey (MBS) turnover of services industries
The Index of Services Quality and Methodology Information report contains important information on:
the strengths and limitations of the data and how it compares with related data
uses and users of the data
how the output was created
the quality of the output including the accuracy of the data